_ Yuri Kofner, economist, Institute for Market Integration and Economic Policy. Munich, 19 July 2020.
Did the Eurasian Customs Union from 2010 (EurAsEC CU) and the Eurasian Economic Union from 2015 (EAEU) increase the economic growth of its member states? How would the economies of the EurAsEC – EAEU member states, if they hadn’t created / joined the EurAsEC customs union in 2010 and the Eurasian Economic Union in 2015?
An indication to this question my by given using the synthetic control method, developed by Abadie, Diamond, and Hainmueller (2010).[1]
The synthetic control method allows for effect estimation in settings where a single unit, e.g., a country, is exposed to an event or policy intervention. It provides a data-driven procedure to construct synthetic control units based on a convex combination of comparison units that approximates the characteristics of the unit that is exposed to the intervention. A combination of comparison units often provides a better comparison for the unit exposed to the intervention than any comparison unit alone. Thus, the synthetic control method combines elements from matching and difference-in-differences techniques.
For this model, the author stipulated the following conditionals: The EAEU member states – Armenia, Belarus, Kazakhstan, Kyrgyzstan, and Russia – were the treated countries and over 180 countries and regions of the world were given as the comparison countries. The dependent variable was GDP per capita in constant USD dollars. The predictor variables were consumer price inflation, gross fixed investment in relation to GDP, the share of manufacturing and construction in GDP, the share of exports in relation to GDP. For the founding countries of the EurAsEC customs union – Belarus, Kazakhstan and Russia – the treatment year was 2010. For Armenia and Kyrgyzstan, which joined with the founding of the EAEU, the treatment year was 2015 accordingly. Accordingly, the predictor or common period was from 1992 to 2009 for BLR, KAZ and RUS, while it was 1992 – 2014 for ARM and KGZ. The result or prediction period was accordingly from 2010 and 2015 to 2019. All data was taken from the World Bank Group.
According to the simulation results, if Belarus, Kazakhstan and Russia hadn’t incepted the Eurasian customs union in 2010, by 2019 their respective GDP per capita would have been 18, 55 and 30 percent lower than they were factually. On average, the GDP per capita of Belarus would have been lower by 700 USD yearly, that of Kazakhstan by 2900 USD and that of Russia by 2000 USD. For Belarus and Kazakhstan, the most significant gain was from the creation of the EAEU single economic space in 2015. Russia experienced a steady welfare gain over the entire study period.
The synthetic control method shows, if Armenia and Kyrgyzstan hadn’t joined the Eurasian Economic Union in 2015, their respective GDP per capita would have been 53 and 9 percent lower in 2019. Armenia’s GDP per capita would have been lower by 1110 USD on average, that of Kyrgyzstan – by 80 USD.
Here it has to be noted that results of the conducted synthetic control method differ from two previous studies by the author using a partial-equilibrium model[2] and a balance of trade cost-benefit analysis[3] which asses the economic effect and significance of the EAEU for its member states, which both assert Belarus and Kyrgyzstan to be the main economic beneficiaries of the EAEU, and Russia with Kazakhstan – the least.
However, all three studies indicate that membership in the EurAsEC customs union and the EAEU aided in the economic and welfare development of the participating countries.
Chart 1. Alternative economic development and welfare gain of Armenia without and with the EAEU (1992-2019, in GDP per capita, constant 2010 USD)
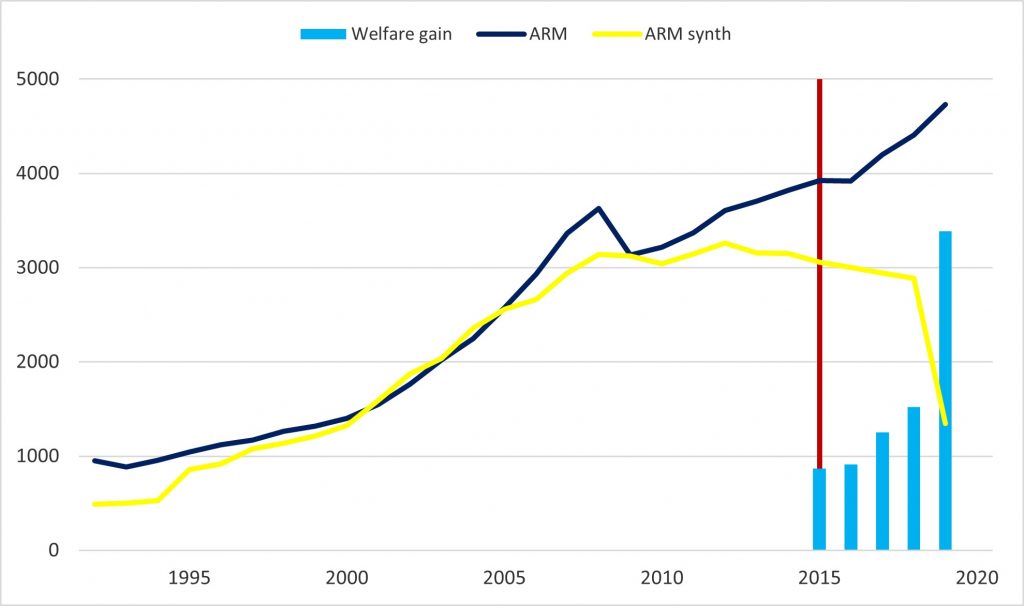
Source: World Bank Data and author’s estimations.
Chart 2. Alternative economic development and welfare gain of Belarus without and with the EurAsEC CU/EAEU (1992-2019, in GDP per capita, constant 2010 USD)
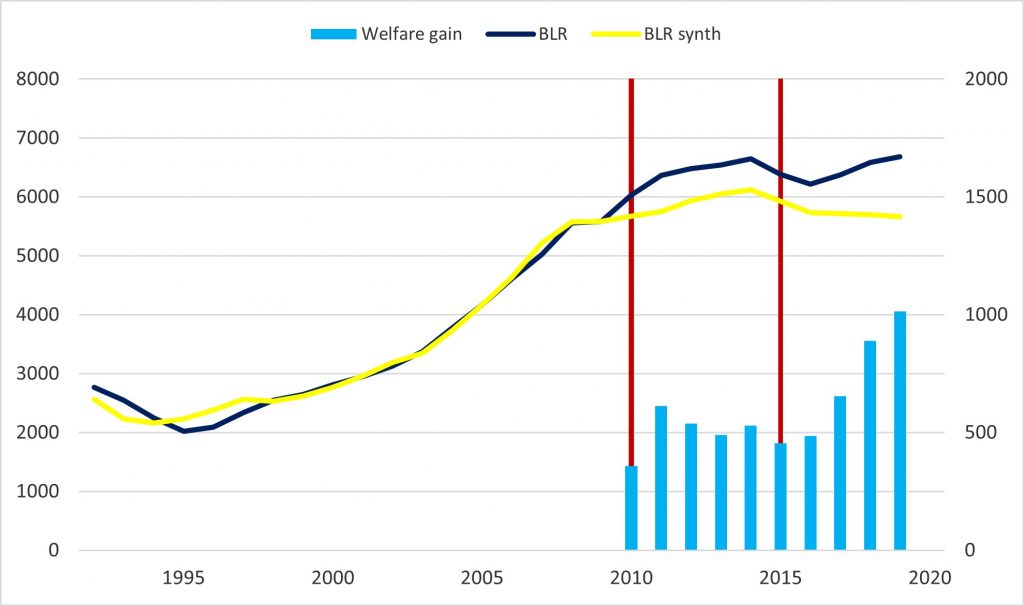
Source: World Bank Data and author’s estimations.
Chart 3. Alternative economic development and welfare gain of Kazakhstan without and with the EurAsEC CU/EAEU (1992-2019, in GDP per capita, constant 2010 USD)
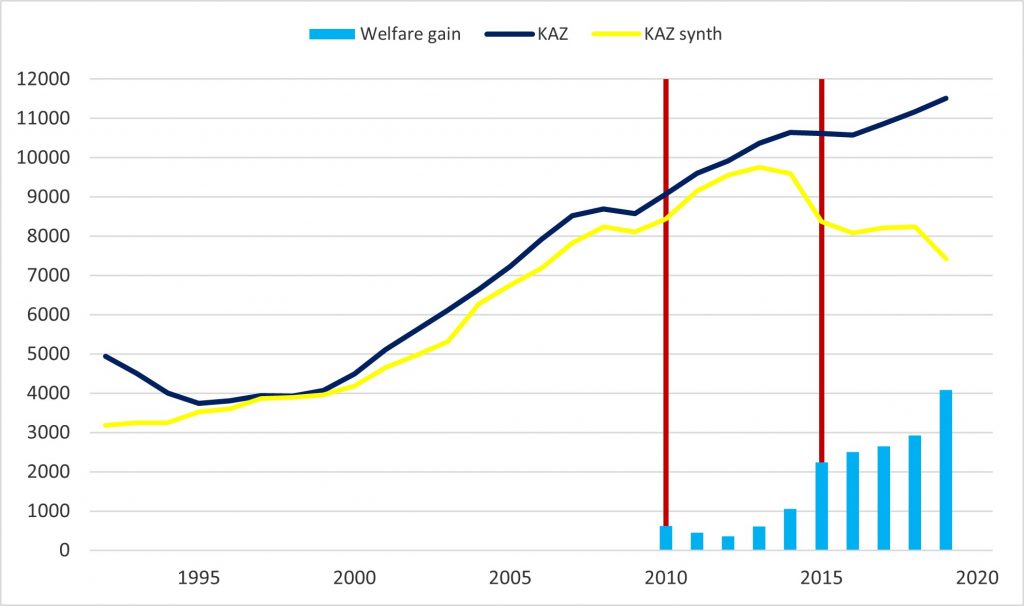
Source: World Bank Data and author’s estimations.
Chart 4. Alternative economic development and welfare gain of Kyrgyzstan without and with the EAEU (1992-2019, in GDP per capita, constant 2010 USD)
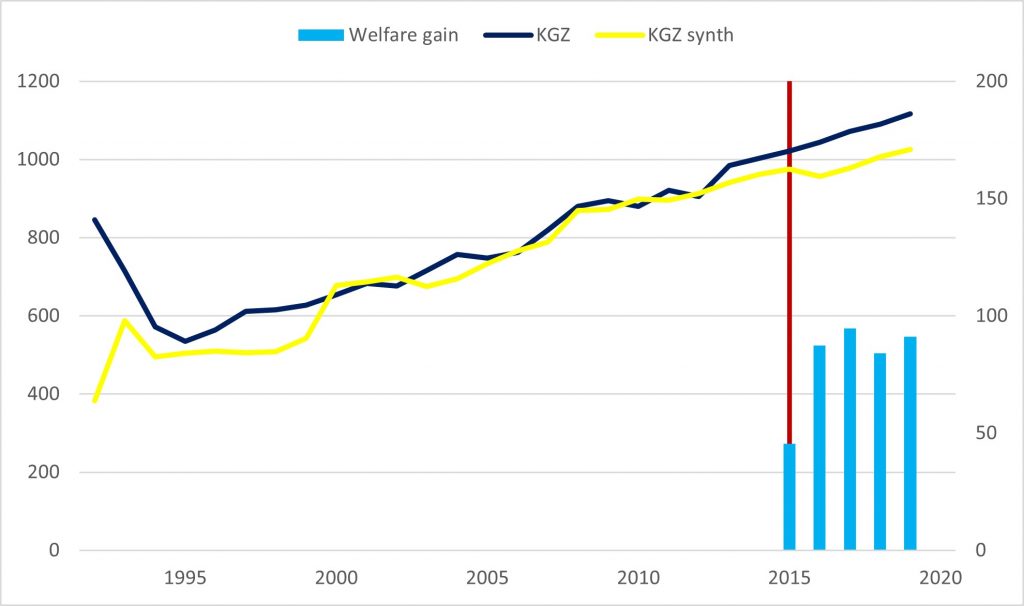
Source: World Bank Data and author’s estimations.
Chart 5. Alternative economic development and welfare gain of Russia without and with the EurAsEC CU/EAEU (1992-2019, in GDP per capita, constant 2010 USD)
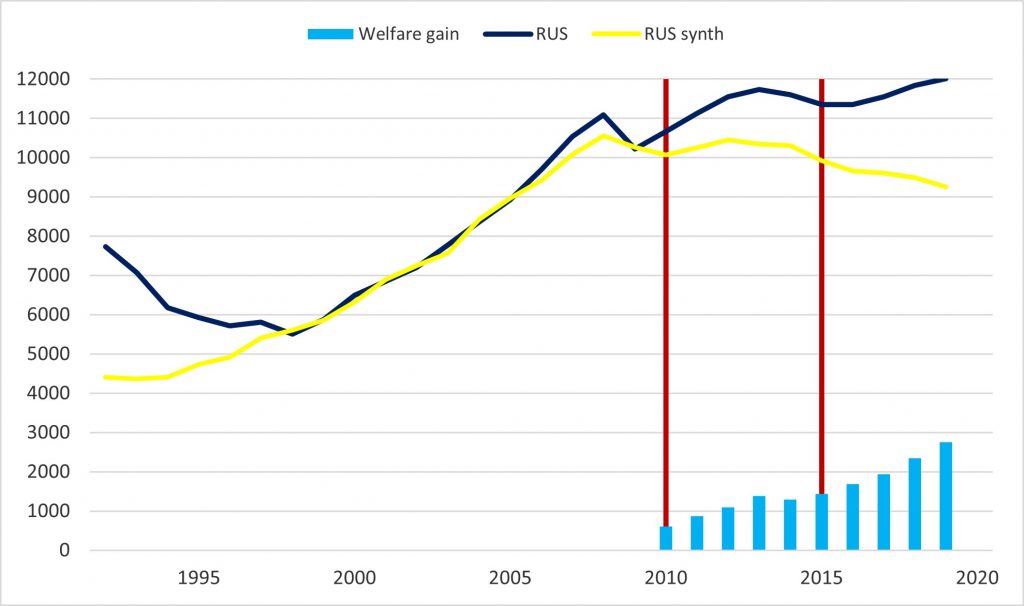
Source: World Bank Data and author’s estimations.
Notes
[1] Abadie A., Diamond A., Hainmueller J. (2010). Synthetic Control Methods for Comparative Case Studies: Estimating the Effect of California’s Tobacco Control Program. Journal of the American Statistical Association. URL: https://economics.mit.edu/files/11859
[2] Kofner Y. (2020). The price of Eurasian disintegration. MIWI Institute. URL: https://miwi-institut.de/archives/114
[3] Kofner Y. (2020). Who wins and who loses from the Eurasian Economic Union? MIWI Institute. URL: https://miwi-institut.de/archives/534
One comment