_ Hubert Ravel, Center for Analysis and Prospective (CAP), Institute of Social, Economic and Political Sciences. 6 December 2021, Lyon.*
Introduction
With 55.6 percent of GDP devoted to public spending in 2019, France holds the record for all forty OECD countries.
This abnormally high level has two major consequences: an excessive level of compulsory levies and a structural public deficit which itself leads to a considerable public debt, all of which weigh on the current and future economic growth of our country.
This reasoning is confirmed by the statistical data (Fig. 1).
Figure 1. GDP growth rate (2010-2019) vs. state quota (public spending in relation to GDP in 2019) of the Euro area member states
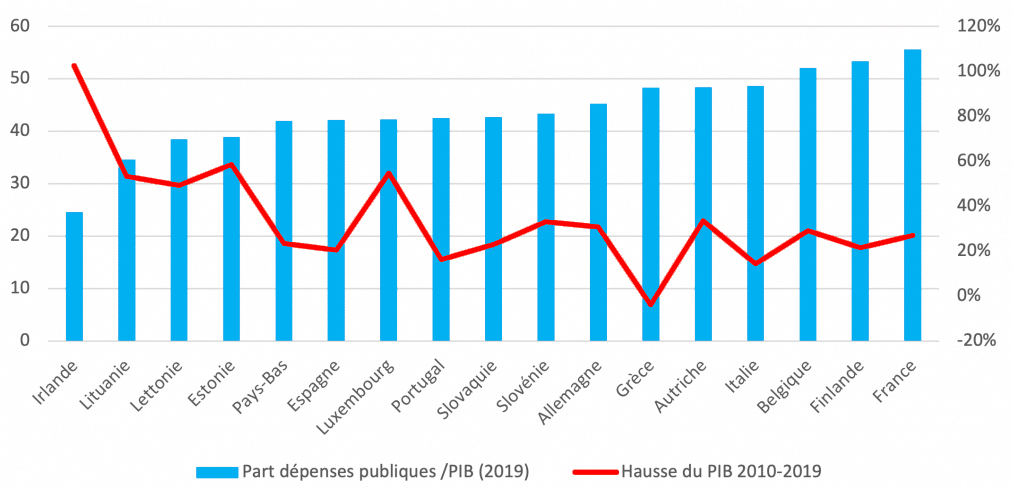
Source: OECD, Eurostat. State quota (public spending in relation to GDP in 2019) (light blue), GDP growth rate (2010-2019) (red).
In Fig. 1. we observe that the lower the share of public expenditure in GDP, the more the GDP growth is lively and vice versa. A regression line can be easily drawn.
If France would have had the average level of public spending in euro-zone countries, i.e. close to the level of Germany, Slovenia or Austria, we can estimate that its growth over the period 2010-2019 would have been 32 percent (31 percent for Germany, 33 percent for Austria and Slovenia, Greece being an atypical case), instead of the 27 percent we actually observed. The shortfall in terms of GDP thus amounts to 90 billion euros in 2019.
The interest in reducing public spending to stimulate growth is therefore well and truly established.
In this regard, we observe that the countries of the euro zone on average succeeded in containing the increase in their public spending during the period 2001 – 2019 (an increase of 0.1 percent in relation to GDP) while France – under the successive presidencies of Jacques Chirac, Nicolas Sarkozy, François Hollande and Emmanuel Macron – failed in this area with a 3.9 percent increase in relation to GDP (Fig. 2).
Figure 2. Evolution of public expenditure in points of GDP from 2001 to 2019
| France | Eurozone | Difference | |
| Social protection | + 4.5 percent | + 2.9 percent | 1.6 percent |
| Debt interest | -1.5 percent | -2.1 percent | 0.6 percent |
| Other public expenditure | + 0.9 percent | -0.7 percent | 1.6 percent |
| Total public expenditure | + 3.9 percent | + 0.1 percent | 3.8 percent |
Source: Eurostat – FIPECO. * The decrease in interest on the debt is due to the fall in interest rates in the Euro area.
Within public expenditure, a distinction must be made between social protection expenditure and other public expenditure. The distribution between the two expenditure blocks, whether in France or in the average of the countries of the euro zone is as follows: 57 percent for social protection and 43 percent for other public expenditure.
With regard to social protection expenditure (57 percent of the total), debates are recurrent in French society and in the political sphere, whether it concerns retirement, the health system, unemployment insurance… The French government regularly announces reforms in this area.
On the other hand, the subject of public expenditure excluding social protection is relatively little discussed by the French government, politicians and the media. However, they represent 43 percent of public spending in France and are again excessive compared to other countries in the euro zone. This subject is therefore in a way a blind spot in the public debate.
However, the Covid-19 pandemic, which has cost and is still very costly to France, drastically increases the public debt of the state. It will therefore be imperative to deal with this issue as soon as possible in order to reduce public deficits and then the debt.
An analysis is all the more necessary as the sovereign expenditure (justice, police, gendarmerie, diplomacy, army) have actually decreased from 4.5 percent in relation to GDP in 1990 to 2.8 percent in 2016. This means that the sovereign functions of the state weaken year after year and make France more vulnerable internally and less influential internationally.
Finally, France and the euro zone countries benefit from relatively moderate debt service due to historically low interest rates, a phenomenon which may not be sustainable. These very low rates hide the real weight of French public debt which, with the pandemic, has experienced another dizzying jump of around 20 points of GDP.
In order to find the right remedies, in economics as well as in medicine, we must first make the right diagnosis.
This is why this study aims to understand the reasons why public expenditure excluding social protection is higher in France than in the other countries of the euro zone.
To conduct this methodical analysis and taking into account the available statistical resources, we have taken the euro zone countries and 2018 as the reference year as the comparison perimeter.
Figure 3. Public expenditure as percent of GDP (2018)
| Eurozone | France | Difference in percent of GDP | Difference in percent (to each other) | |
| Social protection | 26.7 percent | 31.9 percent | 5.2 percent | 19.5 percent |
| Excluding social protection | 20.3 percent | 24.1 percent | 3.8 percent | 18.7 percent |
| Total | 47 percent | 56 percent | 9 percent | 19.1 percent |
Source: Eurostat – FIPECO
We can therefore observe in Figure 3 that in 2018, public spending excluding social protection in France was 18.7 percent higher than the euro zone average. Based on the French gross domestic product of 2.4 billion euros in 2018, the difference therefore amounts to 89.4 billion euros.
The objective of this study is to understand the reasons for this discrepancy.
The impact of CICE in 2018
The Tax Credit for Competitiveness and Employment (CICE) was created by a finance law in December 2012. It was created to finance the improvement of the competitiveness of companies. Its implementation began to impact public spending in 2014 (Fig. 4).
Figure 4. The cost of CICE (2014 – 2020, in bln euros)
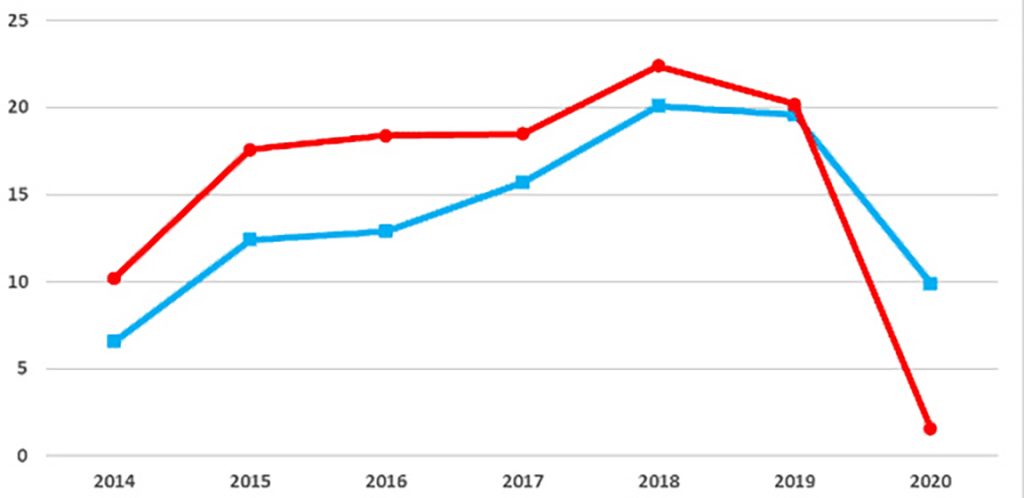
Source: report of the CICE monitoring committee; FIPECO. Budget compatibility (light blue), national compatibility (red).
The device was abolished by the president Macron in 2018 and its impact on public spending is now zero. It has been replaced by a system to reduce employers’ social contributions, which will worsen the public deficit but without increasing public expenditure excluding social protection.
In 2018, the CICE cost 18.9 billion euros, or 0.8 percent of GDP. Excluding the CICE, the gap in public spending excluding social protection with the average for euro-zone countries is therefore 3 percent of GDP.
Given the end of the CICE in 2020 and for the rest of the presentation, it is therefore this 3 percent difference that we will try to explain further down, i.e., the remaining 70.6 billion euros.
Specificities of France
Are there specificities linked to the identity of France which could partly explain the difference in the level of public expenditure with the other countries in the euro zone?
France has two specific features compared to its European neighbours which may partly explain this expenditure gap. On the one hand, it has a national defence that is much more powerful and extensive than its neighbours in the euro zone. On the other hand, it holds many overseas territories. Finally, France is also a net contributor to the budget of the European Union.
National defence
France exercises particular responsibilities in the world. It sits on the United Nations Security Council. It owns nuclear weapons. It carries out numerous external operations in Africa and the Middle East. It is therefore not surprising that its spending in the field of national defence exceeds that of other countries in the euro zone.
In fact, the share of military spending in GDP in France amounts to 1.8 percent of GDP against 1.2 percent of GDP on average in the euro zone (Source: Eurostat-FIPECO), i.e. 50 percent more.
This national defence specificity therefore partly explains the observed gap: 0.6 percent of GDP out of the 3 percent gap (excluding CICE), i.e. 20 percent of the gap or 14.1 billion euros.
Overseas territories
France is the country in the euro zone which includes the greatest number of overseas territories and their weight in the nation is also the highest. In fact, twelve of the twenty-two territories of the EU countries belong to France. They represent a total population of 2.6 million, or nearly 4 percent of France’s total population.
On the side-lines of the West Indian conflict of 2009, the French Government, through the voice of Yves Jego then secretary of state in charge of the Overseas territories, advanced the figure of 16.7 billion euros in terms of total expenditure devoted by the state to overseas, and an additional cost of around 7 billion euros for the national community.[1] At the time, this represented 0.37 percent of the GDP. This additional cost was explained by several phenomena specific to overseas territories:
- The remoteness and geographical dispersion of the territories
- Special advantages reserved for civil servants (1.5 billion euros)
- Tax exemption measures and tax loopholes (3.3 billion euros)
- Various other measures and special situations (2.2 billion euros)
The total updated budget devoted to overseas territories was unveiled in 2020. It now stands at 26 billion euros. If the additional cost is in the same proportions as in 2009 (around 40 percent, it would then amount to 10.4 billion euros today, or around 0.44 percent of GDP. [2]
Taking into account the fact that other countries of the euro zone also have overseas territories (10) but in a smaller proportion and that they too must have additional costs related to this subject, we can undoubtedly “round up” at 0.40 percent of GDP the cost of France’s Overseas territories.
Thus, the specificity of France’s Overseas territories partly explains the difference observed with the average of the other countries of the euro zone to the tune of 0.40 percent of the GDP, i.e. 13.3 percent of the said gap, i.e. another 9.4 billion. euros.
France’s contribution to the budget of the European Union
In 2018, France contributed 22.2 billion euros to the budget of the European Union and received in return 14.8 billion euros. Its net contribution therefore amounted to 7.4 billion euros. The perimeter of the EU and that of the euro zone are different, in particular with the United Kingdom, which weighed heavily in the EU’s GDP. However, the United Kingdom, the largest EU country outside the euro area, was also a net contributor (to the tune of around 5 billion euros in 2015), so this does not correct the level downwards of our net contribution to the EU budget compared to the average for euro area countries.
In this context, France’s net contribution to the EU budget can therefore partly explain the gap in public spending with the average for other euro-zone countries, amounting to 7.4 billion euros, or around 0.30 percent of France’s GDP in 2018.
…
In conclusion of this part, we observe that the specificities of France in the fields of national defence, overseas territories and its net contribution to the budget of the European Union partly explain, that is to say – say up to 1.3 percent of GDP (0.6 percent + 0.40 percent + 0.30 percent) the difference in the weight of public spending between France and the other countries of the euro zone.
The remainder of the gap therefore remains to be explained, i.e. 1.7 percent of GDP (3 percent – 1.3 percent), or 40 billion euros in public spending.
France’s public service
The analysis in Figure 5 shows that France spends significantly more than the other countries in almost all areas with the notable exception of general services, internal security and justice and public debt interest. Of course, there are very large differences depending on the positions considered, which we will come back to later. However, since public power is a service activity, the main explanatory variable for operating costs probably lies in its personnel costs.
Figure 5. Public expenditure (excluding social protection) (2018, as percent of GDP)
| France | Eurozone | Difference to each other | Difference in percent of GDP | ||
| Social housing | 1.1 | 0.6 | 83 percent | 0.5 | |
| Defense | 1.8 | 1.2 | 50 percent | 0.6 | |
| Economic affairs | 5.8 | 4.3 | 35 percent | 1.5 | |
| Leisure, culture and worship | 1.4 | 1.1 | 27 percent | 0.3 | |
| Environmental Protection | 1 | 0.8 | 25 percent | 0.2 | |
| Education | 5.1 | 4.5 | 13 percent | 0.6 | |
| General Services | 4.3 | 4.1 | 5 percent | 0.2 | |
| Homeland security and justice | 1.7 | 1.7 | 0 percent | 0 | |
| Interest on public debt | 1.9 | 2 | -5 percent | -0.1 | |
| Total | 24.1 | 20.3 | 19 percent | 3.8 |
Source: EUROSTAT – FIPECO. * Of which for the CICE 1 percent of GDP.
This is why it is useful to closely analyse the civil service and its sizing, to verify this hypothesis and then to understand the reasons for a possible overstaffing within the French civil service.
International comparisons of public employment are rare and should be treated with caution. Indeed, some countries delegate almost entirely to the private sector the hospital sector while others keep this field in the public sector. Data should therefore be restated excluding public employment in the hospital sector.
A study carried out by France Stratégie (Public Employment Scoreboard – France and international comparisons) published in December 2017 allows us to reconstruct these data for the euro zone countries that are members of the OECD. [3] This study is based on data collected for the year 2015 (Fig. 6).
Figure 6. Number of public administration employees outside the hospital sector per 1000 inhabitants in 2015
| Ireland | 42.5 | |||
| Italy | 43.5 | |||
| Spain | 46.0 | |||
| Portugal | 52.0 | |||
| Germany | 53.5 | |||
| Greece | 59.5 | |||
| Netherlands | 62.5 | |||
| Luxembourg | 64.5 | |||
| Austria | 65.5 | |||
| France | 72.5 | |||
| Belgium | 74.2 | |||
| Finland | 88.0 | |||
| Unweighted average | 60.0 |
Source: France Strategy
We can thus observe that France, with an administration rate (excluding health) of 72.5 civil servants per 1000 inhabitants, is well above the unweighted average for the euro zone which amounts to it has only 60 civil servants. The deviation from the average is 20.8 percent, which is indeed considerable.
This means that where on average a neighbouring country in the euro zone has five civil servants, France has six.
However, two factors should be taken into account: First, the level of subcontracting of public service activities to the private sector which varies from country to country. Second, the national specificities mentioned above (national defence and overseas territories)
Subcontracting
It is clear that a country which outsources a large number of tasks to the private sector needs fewer civil servants and vice versa. However, it turns out that France does not actually subcontract its public service activities to the private sector, as shown in the table below.
Figure 7. Intermediate consumption as a percentage of direct operating expenditure for 10 years (2005-2015)
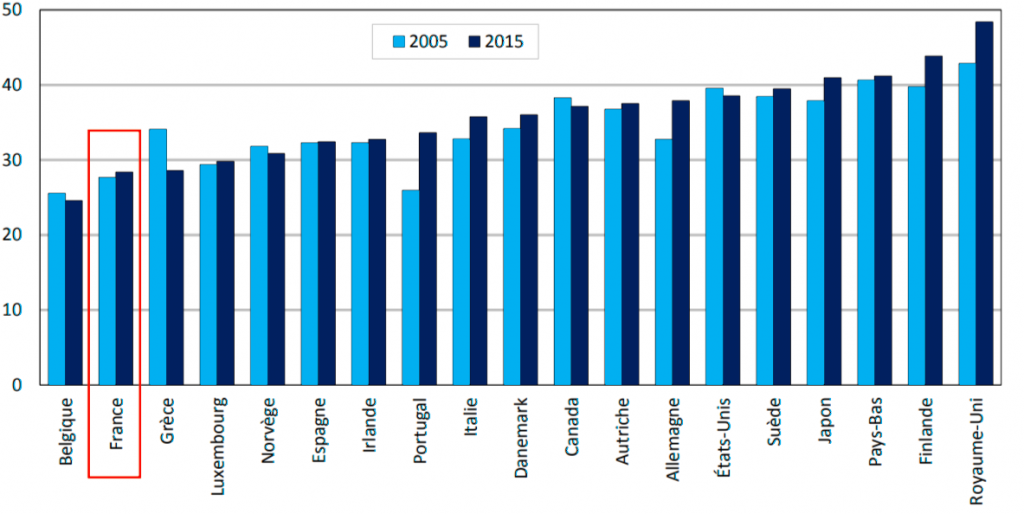
Source: OECD, France Stratégie.
With 28 percent of intermediate consumption, France is well below the average of the euro zone countries belonging to the OECD which is around 34 percent.
In other words, where France has operating expenses of 100 euros, 72 euros are used to pay its officials and 28 euros are devoted to other expenses. On average in the euro area member countries of the OECD, 66 euros are devoted to the remuneration of civil servants and 34 euros to other expenses. This difference could of course come from the remuneration per public official and not from the workforce. However, the France Strategy study shows that France pays its agents on the average of euro-zone countries that are members of the OECD.
We must therefore correct our average for the countries of the euro zone in terms of administration rate (60 agents per 1000 inhabitants) for the low level of subcontracting of public services practiced in France.
By recalculating our data, if the other euro-zone countries had the same level of subcontracting as in France (28 percent of intermediate consumption, the average administration rate would drop from 60 agents per 1,000 inhabitants to 65 agents per 1,000 inhabitants. the gap between France and the mean and the countries of the eurozone going from 20.8 percent to 11.8 percent (from 72.5 to 65).
National defence and overseas
The Frenche ministry of national defence employed 263,000 civil servants in 2017. Considering that France spends one and a half times more than other countries in this area because of its special role, this would mean that we employ, all other things being equal, 87,000 additional agents.
With regard to the overseas territories, we have around 133,000 civil servants (excluding the public hospital service – 30,000 jobs). According to a FIPECO study, the administration rate is 26.7 percent higher than that of the metropolitan area. This represents 28,000 public officials.
Reduced to a French population of 66.4 million inhabitants, these 115,000 agents (87,000 + 28,000) represent 1.7 agents per 1,000 inhabitants. The administration rate for France, corrected for the national defence and overseas effect, therefore amounts to 72.5 – 1.7 equals 70.8 agents per 1000 inhabitants in France .
With the same level of subcontracting as in France, the average administration rate would be 65 agents per thousand inhabitants on average in the euro zone. The difference between the euro zone average and France therefore amounts to 5.8 agents (70.8 – 65) per 1000 inhabitants. This represents a difference of 8.9 percent.
Based on this calculation, assuming that in 2018 the gap with our neighbouring countries remained the same and with a number of civil servants outside the hospital sector which amounted to 4.4 million people in France, the number of civil servants in France exceeding the euro zone average would amount to 365,000 agents excluding defence and overseas territories and taking into account the subcontracting effect.
It is therefore now a question of understanding why France has 365,000 more civil servants than the other countries of the euro zone, all other things being equal.
Civil service in France
The civil service in France, outside the hospital sector, is made up of the state civil service and the territorial civil service (Fig. 8).
Figure 8. Evolution of the civil service in France (2000-2017, outside the hospital sector)
| In thousands of civil servants | 2000 | 2017 | Evolution in percent | Evolution in number |
| State civil service | 2572 | 2507 | -3 percent | -65 |
| Territorial public service | 1327 | 1970 | 48 percent | 643 |
| Public service in total | 3899 | 4477 | 15 percent | 578 |
| Total population | 60.5 | 66.7 | 10 percent | |
| In millions of inhabitants |
Source: INSEE.
Figure 8 shows that, over a period of 17 years, the number of civil servants grew by 15 percent while the French population only increased by 10 percent.
Within this, we observe that the state civil service has remained stable, even slightly declining. On the other hand, the workforce of the territorial public service increased by 48 percent.
Today 56 percent of civil servants come from the state and 44 percent from the local authorities against 65 percent and 35 percent respectively in 2000.
Before going any further in the analysis, we must naturally ask the question whether, over the past twenty years, the state has transferred new powers to local authorities, which could explain this contrasting development.
It appears that Act II of decentralization, set up by the government of Jean Pierre Raffarin in 2003, resulted in the transfer of certain powers from the central government to local communities: vocational training, management of non-teaching staff in high schools and colleges, regional rail transport, individual aid to businesses, regional health programs, tourism policy, management of certain ports and airports, complete management of the RSA, management of part of the national road network, etc. This decentralization program is based on is reflected in the transfer of 140,000 state employees to the local civil service.
If we restate our data taking this transfer into account, then the state civil service at constant perimeter would have increased by 3 percent (instead of a decrease of 3 percent) while the territorial civil service would have increased over the period of 38 percent instead of 48 percent.
These figures should however be considered with caution because the transfers of skills were not necessarily exactly offset by the transfers of personnel according to the fields.
We are therefore going to analyse the two public functions separately while knowing that the borders are porous between the two fields. Consequently, only the major trends should be retained.
State civil service
As we have seen previously, the state civil service has proved particularly economical in terms of staff over the past two decades. Its numbers remained stable while the French population increased by 10 percent. It is therefore reasonable to think that the savings margins are reduced and that the excess staff accumulated during François Mitterands’s two seven-year terms, from 1981 to 1995, have been largely absorbed. This is all the truer when we look at the composition of the state civil service:
Figure 9. State civil service workforce (2017, in thousands of employees)
| Education, teaching and research | 1050 |
| Interior | 295 |
| Defense | 263 |
| Economy, Finance and Industry | 142 |
| Housing, transport and sustainable development | 51 |
| Social affairs, health and work | 19 |
| Others including Justice | 145 |
| Public establishments of an administrative nature | 542 |
| Total | 2507 |
Source: INSEE.
If we indeed review the main employers of the state civil service (Fig. 9):
Education (40 percent of the workforce). It is one of the rare areas where France is at the bottom of the scale in terms of staff, in any case of teaching staff. In fact, the number of teachers per 1,000 pupils is 13, the lowest rate observed in OECD countries belonging to the euro zone.
Interior (12 percent of the workforce). We have seen above that this is one of the areas where France does not spend more than the average for the countries of the euro zone (1.7 percent for security and justice).
defence (10.5 percent of the workforce) It is an area linked to the very identity of France and its role in Europe and in the world. In addition, the armed forces is the ministry where the greatest effort has been made in terms of personnel over the past decades.
We therefore see that on nearly two thirds of the workforce of the state civil service, there is probably not a very large margin of manoeuvre. It is in other ministries and in other public establishments of an administrative nature that there may still be deposits of productivity to be exploited.
Territorial civil service
We have seen above that the staff of the territorial public service increased by 48 percent between 2000 and 2017 or by 38 percent if we take into account the transfers of competence and personnel associated with Act II of decentralization. in place in 2003.
The territorial civil service breaks down as follows (Fig. 10):
Figure 10. Territorial civil service (2017)
| In thousands of civil servants | In percent | |
| Municipal block | 1009 | 53 percent |
| Department | 283 | 15 percent |
| Regions | 88 | 5 percent |
| Public administrative establishments | 520 | 27 percent |
| Total | 1902 | 100 percent |
Source: INSEE
It is interesting to examine the development of what has come to be known as the municipal bloc.
Figure 11. Expenditure of the municipal block in value (base 100 in 2004)
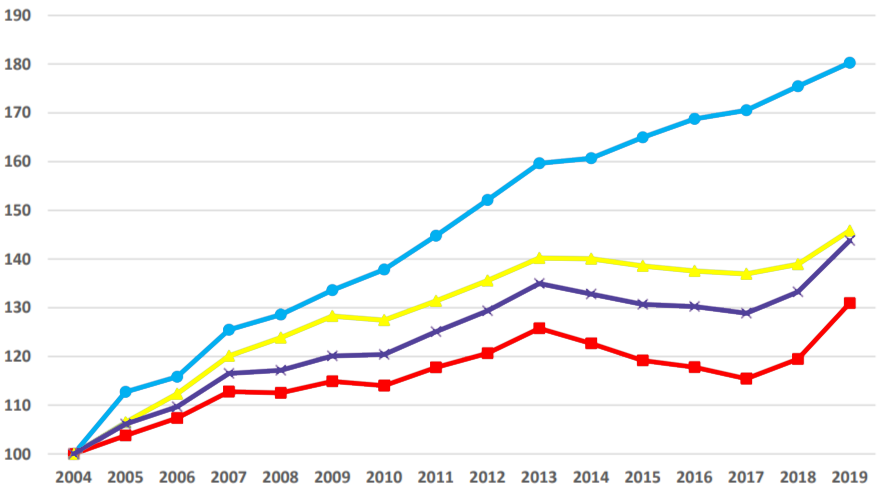
Source: FIPECO [4] . EPCI with its own tax system (light blue); municipalities (red); all local authorities and EPCI (yellow); communal block (purple).
In Figure 11 we observe that the expenditure of the EPCI (public establishments for inter-municipal cooperation) increased by 80 percent between 2004 and 2019 while during the same period the expenditure of the municipalities increased by 30 percent.
The EPCIs, which have gradually taken over from the municipal unions dedicated to the joint management of certain equipment, have their own tax system. They were instituted by the various decentralization laws. There are 1250 today. There are four categories including:
- 21 metropolises
- 14 urban communities
- 222 agglomeration communities
- 997 communities of municipalities
The EPCIs employ 260,000 civil servants, or 14 percent of the regional civil service workforce (70,000 for municipal unions) and spent 52 billion euros in 2019, or around 2 percent of GDP.
In summary, we can say that before the first decentralization law of 1982, France had two levels of local administration: the municipality and the department created during the French Revolution.
Today, we can schematically count four: the municipality, the establishment of inter-municipal cooperation, the department and the region.
Figure 12. Local authority expenditure (2019, in bln of euros and share of total)
| Bln euros | Share in percent | |
| Groups of municipalities | 45.41 | 18 |
| Municipalities | 95.46 | 39 |
| Departments | 66.32 | 27 |
| Regions | 32.62 | 13 |
| Total | 246.1 | 100 |
Source: Department of Legal and Administrative Information of the Republic of France.
Figure 12 above highlights the significant weight of each level in financial terms.
The distribution of roles and responsibilities between all actors, including the central state, is extremely complex. It is, moreover, one of the most difficult subjects for students who have to deal with it in the context of their exams and competitions. Moreover, far from simplifying the situation, Act III of decentralization has added a complementary degree of complexity.
When we look at what is happening in Europe, we generally observe three levels of territorial administration (or sometimes two in small countries): the municipality, the region and what we call the department and what others call the province or other Kreis. On the other hand, we do not see that there are four levels. In addition, the roles and responsibilities of each level are clearly established. There is no redundancy.
It is therefore clear that the excessive number of levels of territorial administration as well as the entanglement of roles and responsibilities between these four levels and the central state are for the most part at the origin of the overstaffing of the public service in France. The administrative millefeuille gradually implemented since 1982 via the three acts of decentralization is the main cause. It probably explains most of the 365,000 civil servants that France has more than our European neighbours.
Among the other possible causes of the excessively high staffing level in the public service, as in a private company, we can also think of other types of phenomena:
- An excessively high ratio of administrative staff to field staff;
- A lack of automation of certain administrative tasks;
- Overly complex administrative processes;
- Duplication or overlap between departments and directorates;
- Too complex organizations;
- A high level of absenteeism or a lack of productivity of some agents;
- Areas in which the intervention of the public authorities is not absolutely necessary.
In conclusion, it is appropriate to estimate the impact on public expenditure of the estimated overstaffing of 365,000 public officials compared to the other countries of the euro zone.
In 2016, the average cost of the remuneration of a civil servant in the state civil service in France was approximately 50,000 euros per year and 41,000 euros for a territorial official.
Taking into account the increase in the public wage bill between 2016 and 2018 and assuming that most of the excess staff (85 percent) would be located in the local civil service, the additional cost in terms of the wage bill would be 16 billion euros for 365,000 officials. To this must of course be added the costs associated with these workstations, the subcontracting effect.
On the basis of an intermediate consumption level of 28 percent (see above) of operating expenditure, the cost of excess staff in the public service in France (excluding national defence and overseas territories) can be estimated at 22.5 billion euros, i.e. around 0.956 percent of France’s 2018 GDP, which we will round off to 1 percent.
Other explanatory factors
We have seen above that the gap in public spending, excluding social protection, between France and the average of the countries of the euro zone was equal to 3 percent of GDP in 2018, excluding CICE.
We have also seen that this difference is explained by:
- French specificity in terms of national defense: 0.6 percent
- French overseas specificity: 0.4 percent
- France’s contribution to the EU budget: 0.3 percent
- Excess staff in the public service (excluding the hospital sector): 1 percent
It therefore remains to explain a gap of 0.7 percent of GDP, or 16.5 billion euros. To do this, it is useful to return to Figure 5.
In Figure 5, the three lines that show the largest percentage deviation from the average of the euro area countries are in order:
- Social housing: plus 83 percent;
- Defense: plus 50 percent;
- Economic affairs: plus 35 percent.
We have seen the explanation above with regard to national defence. Regarding economic affairs, the cost of the CICE (0.8 percent of GDP) largely explains the difference. In fact, excluding the CICE, the expenditure gap with the average for euro-zone countries is reduced to 16 percent. It is therefore necessary to analyse more closely and as a priority, according to this analysis grid, the area of social housing.
Social housing
In Figure 5, it is first of all important to say that transport is not part of this heading. They are placed in economic affairs. In addition, personal housing assistance is not included either because it is classified under social protection expenditure.
It is difficult to know exactly what this section covers. However, we can legitimately think that it essentially covers social housing, a subject in which the public authorities are very active in France.
Indeed, INSEE tells us that in 2017, there were 4.7 million social housing units in France (5 million in 2020) which represented 16 percent of the occupied housing stock. These dwellings are occupied by 10.7 million people. However, at the level of the European Union, a study carried out in 2017 shows us that the rate of social housing across the entire stock was 11 percent. The difference between France and the average for European countries is therefore 45 percent.
According to a study carried out by the Institut Montaigne in 2008, the large countries of the euro zone had a number of social housing units per thousand inhabitants much lower than that of France: France (69) versus Germany (27), Italy (18) or Spain (3). In addition, the share of the private sector in social housing is still very small in France even if it tends to grow.
It is difficult to estimate the gap in public spending in favour of social housing between France and the average for euro-zone countries because this data is not available. However, on the basis of the Institut Montaigne study and taking into account seven countries representing 290 million inhabitants (85 percent of the population of the euro area), we obtain a weighted average number of 40 social housing units for 1000 inhabitants against 69 in France, a difference of 70 percent.
This confirms that the major part of the gap between France and the average of the countries of the euro zone probably comes from a number of social housing units much higher than that of our European neighbours. By applying this ratio of plus 70 percent to the average expenditure of euro-zone countries in terms of social housing aid (0.6 percent of GDP), we end up with an additional expenditure equivalent to 0.42 percent of GDP.
Thus the surplus social housing stock compared to the average for euro-zone countries (i.e. around 1.8 million housing units), undoubtedly explains additional public expenditure to the tune of 0.4 percent of GDP or 9.4 billion euros.
Residual explanatory factors
To understand the residual public expenditure gap (0.3 percent), we have to go back to Fig. 5. again.
We have already addressed in the study social housing and defence. We also see that on three items (general services, internal security and justice, interest on the public debt) France is more or less in the middle of the countries of the euro zone.
There are therefore four areas where the French government spends more than the other countries of the euro zone: economic affairs, leisure, culture and worship, environmental protection and education.
Regarding economic affairs, we must neutralize the CICE effect (0.8 percent of GDP). The gap is thus reduced to 0.7 percent of GDP, i.e., 16 percent more than the European average. Within this item, transport shows a difference of 0.2 percent (2.1 percent for France versus 1.9 percent for the euro zone average, i.e., a difference of 10.5 percent). Excluding transport, the difference is therefore 0.5 percent (2.9 percent – 2.4 percent), or 20.8 percent.
In this context, having eliminated all the other explanatory factors (CICE, defence, overseas territories, net transfers to the European Union budget, civil service staff and social housing), the increase in public expenditure compared to the average for the countries of the euro zone breaks down as follows:
Figure 13. Public expenditure (excluding social protection) (2018, as percent of GDP)
| In percent of GDP | Percent of total variance | Reduced to 0.3 percent of GDP | In billions of euros | |
| Education | 0.6 | 33 percent | 0.10 | 2.4 |
| Economic affairs excluding transport | 0.5 | 28 percent | 0.08 | 1.9 |
| Leisure, culture and worship | 0.3 | 17 percent | 0.05 | 1.2 |
| Transportation | 0.2 | 11 percent | 0.03 | 0.8 |
| Environmental Protection | 0.2 | 11 percent | 0.03 | 0.8 |
| Total | 1.8 | 100 percent | 0.30 | 7.1 |
Source: CAP ISSEP.
In other words, the residual gap in public spending between France and the countries of the euro zone, which stands at 0.30 percent of GDP, breaks down as follows:
- Education: 0.10 percent of GDP;
- Economic affairs excluding transport: 0.08 percent of GDP;
- Leisure, culture and worship: 0.05 percent of GDP;
- Transport: 0.03 percent of GDP;
- Environmental protection: 0.03 percent of GDP-
This difference, as indicated above, is understood to exclude expenditure linked to the workforce of the public service.
To explain these additional costs, we can formulate hypotheses, but the format of the study does not allow going into more detail in the analysis.
Conclusion
Excluding the now abolished CICE system, it appears that the gap in public spending between France and the average of the euro zone countries in 2018 stood at 3 percent of GDP, or 70.6 billion euros. This difference can be explained as follows:
Figure 14. Excessive public spending in France compared to the euro area average (2018)
| In percent of GDP | In percent of the whole | In billions of euros | |
| Public service staff | 1 | 33 percent | 23.5 |
| National Defense | 0.6 | 20 percent | 14.1 |
| Overseas territories | 0.4 | 13 percent | 9.4 |
| Social housing | 0.4 | 13 percent | 9.4 |
| Contribution to the EU budget | 0.3 | 10 percent | 7.4 |
| Education | 0.1 | 3 percent | 2.4 |
| Economic affairs excluding transport | 0.08 | 3 percent | 1.9 |
| Culture, Leisure and Worship | 0.05 | 2 percent | 1.2 |
| Transportation | 0.03 | 1 percent | 0.8 |
| Environmental Protection | 0.03 | 1 percent | 0.7 |
| Total | 3 | 100 percent | 70.6 |
Source: CAP ISSEP.
We can therefore conclude that France’s excessive public spending compared to other euro area countries can be explained by six main factors:
First factor (33 percent): overstaffing of the public service or anarchic decentralization
The overstaffing of the public service (excluding the hospital sector) comes from an anarchic decentralization which has generated a veritable administrative layer of government with four levels of local public authorities against two or three generally in the other countries of the euro zone. This has led to an explosion in the territorial civil service over the past twenty years (plus 48 percent between 2000 and 2017). The overstaffing of the French public service outside the hospital sector is estimated at 365,000 civil servants.
Second factor (20 percent): Strong national defence due to France’s international status
National defence spending can be explained by France’s international role and by its place in the world: seat on the Security Council, nuclear weapons, interventions in Africa and the Middle East.
Third factor (13 percent): A strong presence of France overseas
“Overseas” expenses come from the presence of France on almost all continents, which structurally leads to additional costs due to their remoteness and their dispersion around the world. In addition, the over-administration of these territories and certain peculiarities (advantages reserved for civil servants, tax exemption measures and tax loopholes, etc.) increase spending.
Fourth factor (13 percent): Excessive social housing
Social housing expenditure is explained by a stock of social housing (around 5 million) much higher than that of other countries in the euro zone. All other things being equal, France has 1.8 million more social housing units than its European neighbours.
Fifth factor (10 percent): A net contribution of France to the EU budget
Regarding the European Union, France is a net contributor to the EU budget to the tune of 7.4 billion euros. This naturally weighs on public spending in France.
Sixth factor (10 percent): excessive spending (excluding overstaffed public service) in education, economic affairs, transport, environmental protection and culture
Finally, excluding personnel costs, France spends more than the other countries of the euro zone in the field of economic affairs, transport, education, culture and environmental protection to the tune of 7 billion euros in total.
Among these six factors, we must undoubtedly distinguish those on which France’s room for manoeuvre is low from those for which France has complete latitude to act.
The three areas where France’s room for manoeuvre is low: national defence, overseas territories and its net contribution from the European Union budget (43 percent of the total)
In these areas, public spending is linked to France’s identity (its international role, its overseas presence) or to negotiations with European partners (contribution to the European Union budget).
There is undoubtedly room for progress: renegotiation of France’s contribution to the EU budget, in particular because of the role played by France in terms of defence which serves the interests of all European countries (intervention in Mali for example), optimization margins on overseas spending (administration rate, certain benefits granted, etc.). But they will probably not be decisive.
The three areas where France has greater room for manoeuvre: public sector overstaffing, social housing stock and various positions (education, economic affairs, transport, culture, and environmental protection) (57 percent of the total).
In these areas, France has full latitude to implement the actions and reforms necessary to reduce this excess public spending. For this, we naturally need a very strong political will because the reforms to be undertaken are structural.
They are nevertheless possible to be implemented in one or two five-year periods in order to return to a reasonable level of public expenditure, excluding social protection.
To conclude, it should be added that this analysis of the causes does not completely exhaust the subject of ways and means to reduce public spending excluding social protection in France. Another CAP study will be useful, based on this diagnosis, to fully address this subject.
Indeed, there are other sources of costs on which France can usefully act to reduce its public spending such as legal and illegal immigration, or multiple institutions, the usefulness of which has not really been demonstrated, created by and for politicians and the senior civil service (Economic, Social and Environmental Council, various agencies and high authorities) in order to provide them with appreciable sources of income which weigh heavily on public accounts. Finally, the weight of public spending in GDP also depends on the denominator, that is to say on economic growth.
In any case, it appears that a candidate for the presidential election cannot reasonably hide this major subject of the reduction in public expenditure excluding social protection. Indeed, the French anomaly in this matter will have to be corrected for the current and future prosperity of France.
Notes
[1] Crouzel C. (2009). L’outre-mer coûte près de sept milliards à l’État. Le Figaro. URL: https://www.lefigaro.fr/economie/2009/02/11/04001-20090211ARTFIG00602-l-outre-mer-coute-pres-de-sept-milliards-a-l-etat-.php
[2] Ministre des Outre-Mer (2020). Document de politique transversale projet de loi de finances pour 2020. URL: https://www.performance-publique.budget.gouv.fr/sites/performance_publique/files/farandole/ressources/2020/pap/pdf/DPT/DPT2020_outre-mer.pdf
[3] Flore Deschard F., Le Guilly M-F. (2017). Tableau de bord de l’emploi public Situation de la France et comparaisons internationals. France Stratégie. URL: https://www.strategie.gouv.fr/sites/strategie.gouv.fr/files/atoms/files/tdb-emploi-public-20-12-2017.pdf
[4] FIPECO (2021). L’intercommunalité. URL: https://www.fipeco.fr/pdf/intercommunalit%C3%A9.pdf
Other sources of this policy note: INSEE, Eurostat, OCDE, France Stratégie, Vie publique, Observatory of local finances, Institut Montaigne.
*Translated from the original on CAP ISSEP.