_ Florian Blümm, graduated computer scientist, Tech for Future. Berlin, 30 December 2021.*
The question of cost is always the crucial question. This is especially true when it comes to efficient climate protection. If a measure is twice as effective with the same budget, then it makes no sense to rely on the more ineffective measure. In the case of electricity generation, the cost differences are even significantly greater than doubling. Electricity from biomass and roof solar is around 6 times as expensive as from new hydropower plants and three times as expensive as from new nuclear power plants. It is important to consider not only the electricity generation costs, but also the system costs and the CO2 price. This analysis determines the full costs for various energy producers in Germany and its neighbouring countries.
The full costs for energy sources in Germany in terms of euro cents per kilowatt hour of electricity are:
- 2.7 euro cents / kWh nuclear power plant extension
- 3.0 euro cents / kWh hydropower
- 4.0 euro cents / kWh new nuclear power plant
- 8.2 euro cents / kWh solar park
- 9.1 euro cents / kWh wind
- 10.3 euro cents / kWh offshore wind
- 10.4 euro cents / kWh lignite
- 11.0 euro cents / kWh natural gas & steam
- 11.8 euro cents / kWh hard coal
- 12.3 euro cents / kWh roof solar
- 13.3 euro cents / kWh biogas
- 17.6 euro cents / kWh natural gas, open turbine.
Figure 1. Full costs by electricity generator in Germany (2020/2021, in Euro cents per KWhel, for exclusively German / Central European producers)
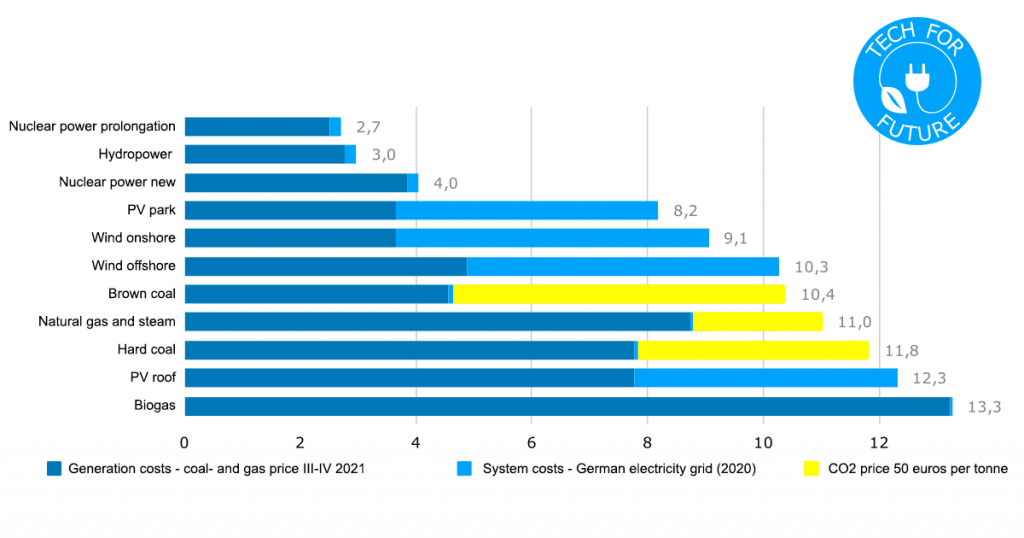
Source: IEA (2020), Ueckerdt F. et al. (2013), OECD, NEA (2012).
Extending the service life of paid nuclear power plants by one to two decades is the cheapest way to generate electricity in Germany. At the beginning of commercial nuclear power, it was assumed that it would only last 40 years. At that time, it was unclear how long a reactor pressure vessel and steel would remain operational in a radioactive environment. However, practice has shown that light water reactors can run for decades longer. The first terms have been extended to 80 years[1] and 100 years[2] are being examined by regulators.
The construction of new nuclear power plants and hydropower plants is also inexpensive thanks to their long lifetimes. It is now assumed that there will be at least 80 years for hydropower and at least 60 years for nuclear power. The problem with such long periods is the high capital expenditure at the beginning and the high risk of an electricity price forecast in 2060, 2080 or even 2100.
The fossil fuels coal and gas are significantly more expensive than nuclear power and hydropower, at a price of 50 euros per tonne of CO2 emissions and current fuel prices. Generating electricity from biogas and natural gas in an open gas turbine has the highest costs.
Wind and solar are also significantly more expensive than hydropower and nuclear power because of their high system costs. If Germany didn’t already have such a high proportion of wind and solar systems, wind turbines and solar parks would be among the cheapest energy sources.
2021: Gas price, coal price & CO2 price double
In 2021 there were huge price increases of the gas price, hard coal price, and EU ETS futures.
If one assumes a doubling of the fuel prices for gas and hard coal, this leads to considerable increases in the full costs of fossil producers: plus 112 percent for lignite,[3] plus 90 percent for natural gas,[4] plus 57 percent for hard coal.[5]
The price of electricity on the spot market and on the futures market has risen sharply as a result of these price increases.
The main reason for the price increases is probably the increased demand due to, among other things, the cold winter 2020/2021, which emptied the gas storage facilities.[6] Demand has also increased internationally, especially in Asia.
Lignite is not traded globally because of the unaffordable transport costs due to enormous extraction volumes. The production costs of lignite should therefore hardly have changed. The increased price of CO2 has increased the costs of the dirtiest producer all the more.
Since mid-2021, all climate-friendly producers in Germany have been cheaper than fossil fuels and biomass for the first time, with the exception of roof solar. But there are still big price differences between the cheap, clean producers of hydropower and nuclear power and the expensive, volatile producers of wind and solar.
What are electricity generation costs?
Electricity generation costs (LCOE) includes capital costs and variable costs over the life of an energy source, including: raw materials, construction, maintenance, labour costs, insurance, lease, fuels, dismantling, disposal.
The entire life cycle is considered, from the green field to the power plant and back to the green field – including disposal.
The electricity production costs differ globally, depending on raw material prices, expertise and climate conditions: In the USA, gas-fired power plants are around a third cheaper thanks to fracking natural gas. Russian nuclear power plants are around a third cheaper because of their high level of expertise. In Australia, photovoltaics is only half as expensive because of the many hours of sunshine.
The value for nuclear power in Germany also relates to a reactor prototype and is therefore higher than it should be. The nuclear power plant in Flamanville is unfortunately the only newly built reactor in Central Europe in recent years. The data in this analytical note is given for Germany and its neighbouring countries.[7]
What are system costs?
In addition to the electricity generation costs, there are also integration costs into the power grid, the system costs.
For most energy sources, the system costs are consistently low in Germany at 0.1 to 0.2 cents per kWh. Quickly controllable open gas turbines are even at 0.05 cents per kWh.[8]
On the other hand, the weather-dependent producers of wind, and especially solar, cause high system costs. With a 1-percent system share, they start with around 2 cents per kWh and increase with growing expansion:[9]
- 5 percent system share: 2.8 euro cents / kWh wind, 2.8 euro cents / kWh solar
- 10 percent system share: 3.7 euro cents / kWh wind, 4.5 cents / kWh solar
- 15 percent system share: 4.4 euro cents / kWh wind, 5.5 cents / kWh solar
- 20 percent system share: 4.8 euro cents / kWh wind, 7.3 cents / kWh solar
- 25 percent system share: 5.1 euro cents / kWh wind, 12.3 cents / kWh solar
The system costs of solar power rise significantly faster than those of wind because the capacity factor is smaller. In addition, the solar power generation fails completely every evening and does nothing to cover the annual peak loads on winter evenings.
With the current system shares in Germany of 10 percent solar and 27 percent wind,[10] the system costs are 4.5 cents per kWh solar and 5.4 cents per kWh wind.
System costs of renewables
The system costs for wind and solar in this analytical note come from a quarter-hourly analysis of production and consumption in Germany over a year. Six components of the system costs are taken into account (1-6): 1. Electricity grid: The grid expansion required by the integration of renewables. 2. Control energy: Costs due to grid interventions, especially due to unexpected electricity supply failures. 3. Backup: Expected electricity supply failures, for example for maintenance or during calm and at night for wind and solar. 4. Oversupply: The excess electricity produced by PV and wind turbines, which cannot be used on sunny or windy days. 5. Full load hours reduction: Solar and wind cannot replace existing power plants. But they reduce their production and thus cause additional costs. 6. Capacity adjustment: A conversion of the power plant park is necessary due to wind and solar, e.g. gaspeakers instead of base load power plants. (And 7). Flexibility: Steep power ramps from wind and solar increase consumption and wear and tear in fossil power plants in the load sequence.
Figure 2. System costs for solar power in Germany (in euro cents according to system share)
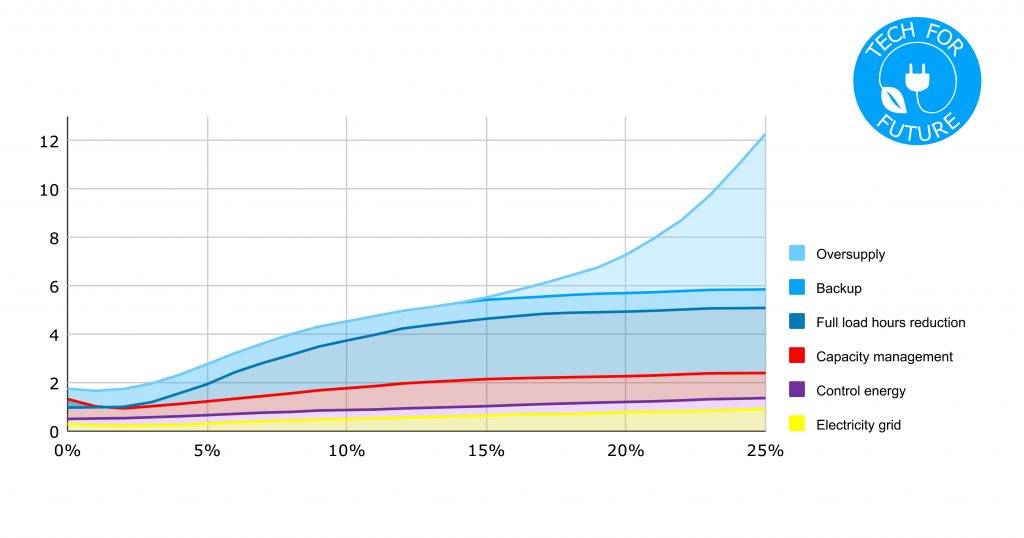
Source: Ueckerdt F. et al. (2013).
Figure 3. System costs for wind power in Germany (in euro cents according to system share)
Source: Ueckerdt F. et al. (2013).
The last four aspects only appear with wind and solar due to the dependence on the weather. The first three aspects play a role in all energy sources. However, they are more expensive with solar and wind, because of the distance to the consumer, the inaccurate production forecast and the very frequent backup situations. The system costs due to flexibility (7) are not taken into account in this analytical note, but they are probably low.
Many of the system costs are expressed on the German electricity exchange in the low value of wind and solar power as well as in the overall declining value of electricity when adding wind and solar power. This is why the literature also speaks of system value, for example VALCOE[11] or LACE.[12] From an economic point of view, it does not matter whether you consider system value or system costs. The system costs are, however, much easier to compare.
In Germany, wind and solar are not traded on the futures market or OTC due to their unpredictability. One has to be content with the low prices on the spot market. Even on the spot market, the exchange price of wind and solar is on average lower than that of other energy sources. During the temporarily high system share during the low-demand Corona lockdown 2020, the value of wind and solar power even fell significantly from 3 cents per kWh to less than 1 cent per kWh due to overproduction.[13]
In Germany, losses of this kind are not borne by the generator, but by the electricity consumer through the EEG levy. Other components of system costs are not internalized in Germany according to the “generator-pays-principle”. This applies in particular to the expansion of the grid, the reduction in full load hours and the control energy.
These costs are borne by third parties, but ultimately passed on to the electricity consumer in the form of high electricity prices. System costs in Germany are therefore external costs that are not paid by the generator.
What are external costs?
System costs are not the only external cost. The safety of energy sources also plays a major role, whether during operation or in the event of an accident. Around 10,000 people die every day from air pollution from fossil fuels and biomass. In contrast, even the biggest energy accidents like Banqiao (200,000 deaths), Machchhu (10,000 deaths) and Chernobyl (4,000 deaths) pale.[14]
A prominent example of external costs is climate change. Some of the climate costs are internalized in the EU through emissions trading, in which electricity producers pay for their CO2 emissions. The price results from the demand on the market and the limited supply of emission certificates per year (cap and trade).
The current price is around 50 euros per tonne of CO2 emitted.[15] These costs are included in this analytical note. In order to make solar parks and wind turbines competitive with lignite without subsidies, the price per tonne of CO2 would have to rise to at least 55 euros.
The certificates are becoming scarcer each year, which increases the price in the long term. However, the fossil producers also know this. In recent years they have stocked up on certificates at much lower prices in the single-digit euro range. The current price is therefore unfortunately not meaningful for power plants that are already running with a supply of certificates.
The fair amount of the CO2 price to reflect the actual costs is highly controversial. The calculations for the so-called social costs of carbon range from a few euros to hundreds of euros per ton of CO2.[16] The amount of damage depends heavily on the climate model, expected climate impacts, tipping points and more.[17]
Other external costs in addition to climate damage are above all air pollution and the use of resources.[18] The external costs that are independent of the climate are highest for coal and oil. Natural gas, biomass, solar, geothermal and nuclear power are in the middle. Wind and water generate the lowest external costs.
Fair competition is only possible if the external costs are fully internalized. As long as there are external costs, the overall system costs and final prices for consumers increase.
Full costs with full consideration of environmental damage
External costs for environmental damage and damage to health differ greatly depending on the generator:[19]
- 3 euro cents / kWh hard coal
- 4 euro cents / kWh natural gas
- 9 euro cents / kWh roof solar
- 3 euro cents / kWh solar park
- 0 euro cents / kWh onshore wind
- 0 euro cents / kWh offshore wind
- 9 euro cents / kWh nuclear power
- 8 euro cents / kWh hydropower
The ratios come from a study by the United Nations on the environmental impacts of energy sources over the life cycle.[20]
In order to equate the costs in euros, a CO2 price of 195 euro per ton of CO2 was assumed. According to the German Federal Environment Agency, these are the social costs of global warming.[21]
Figure 4. Full costs for electricity in Germany by energy source including external costs (2020/2021, in Euro cents per KWhel, for exclusively German / Central European producers)
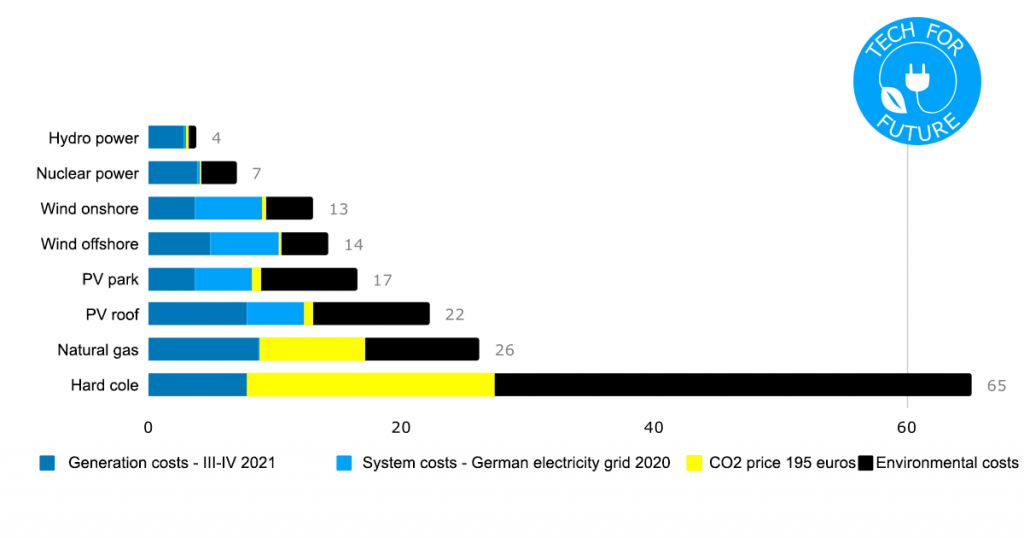
Source: IEA (2020), UNECE (2021), Ueckerdt F. et al. (2013), OECD, NEA (2012).
These external costs need to be considered with caution. They depend on the chosen carbon price and other uncertainties. It’s about orders of magnitude, not tens of decimal places.
If these external costs were added to the price of electricity, burning coal would be far beyond economic viability. The full costs of natural gas, wind power and photovoltaics are also very high. Biomass and lignite were unfortunately not considered in the study but would probably be exorbitantly high.
Granted, it is unfortunately extremely unlikely that all costs will be paid on a “generator-pays” basis in the future. Therefore this scenario will remain purely hypothetical. A CO2 price of 200 euros in the 2030s, on the other hand, would not surprise.
What are fixed & variable costs?
Fixed costs arise regardless of how much electricity is produced. These are capital costs in the construction, dismantling and modernization of a power plant, including financing. The rent, salaries of employees and maintenance costs are also fixed.
Variable costs increase the more electricity is generated. So, these are costs in day-to-day operation, in particular due to fuel and usage-related maintenance.
The costs of climate-damaging fossil power plants and biomass are largely fuel costs, i.e., variable costs. With high variable costs, it is not worthwhile to generate electricity at low market prices.
The costs of climate-friendly energy sources wind, solar, nuclear power, geothermal energy and hydropower are largely capital costs, i.e., fixed costs. These producers can generate a profit even when stock market prices are low.
Because storing electricity is uneconomical, it is always worthwhile to generate electricity when the exchange prices are higher than the variable costs. This even applies if the stock exchange prices are below the total generation costs, i.e., including fixed costs.
The cost-price mechanism of the energy market can be compared to the tourism sector. A hotel room cannot be “saved” until the following day. Before a room is empty overnight, it is even worth selling the room as long as the room price is above the low variable costs (e.g., cleaning, laundry, wear and tear).
Partially covering fixed costs with short-term profits is still better than not covering them at all. Because power plants do not start up and shut down as quickly as one would like, it can even be worthwhile to sell electricity for a short time below variable costs.
In the long term, of course, the fixed costs have to be covered to avoid bankruptcy. Higher prices on another day can raise the average over the generation costs.
The older a power plant, the lower the financial pressure from fixed costs. Completely written-off power plants no longer have to service capital costs. The difference can be seen in the cost comparison between the extension of the term and the 50 percent more expensive new construction of nuclear power plants.
What is the discount rate?
A high proportion of fixed costs is bad for financing because it extends the payback period. The longer investors wait for their money, the greater the risk from imponderables such as raw material prices, electricity prices and, most importantly, energy policy. This risk is reflected in high discount rates.
If the discount factor is doubled or tripled from the 3 percent considered in this analytical note, the prime costs increase. This applies all the more to the capital-intensive producers of hydropower, wind power, nuclear power and photovoltaics:[22] Hydropower: 3 percent -> 6 percent: 155 percent; 3 percent -> 9 percent: 220 percent. Nuclear power: 3 percent -> 6 percent: 141 percent; 3 percent -> 9 percent: 194 percent. Photovoltaics: 3 percent -> 6 percent: 126 percent; 3 percent -> 9 percent: 155 percent. Wind power: 3 percent -> 6 percent: 123 percent; 3 percent -> 9 percent: 149 percent. Coal: 3 percent -> 6 percent: 112 percent; 3 percent -> 9 percent: 127 percent. Natural gas: 3 percent -> 6 percent: 105 percent; 3 percent -> 9 percent: 110 percent.
The higher the discount factor, the more lucrative climate-damaging coal and gas power plants with low capital costs become. It is therefore the task of a climate-friendly policy to keep the discount factor for climate-friendly energy sources low. This happens through grants or guarantees.
In Germany today, no one will build a nuclear power plant without extensive government guarantees, no matter how lucrative it is. The German energy policy has destroyed all confidence in investments through the nuclear phase-out (2002-2011). How much confidence would investors have if the exit from the nuclear phase were to be decided tomorrow?
The loss of confidence in long-term investments affects not only nuclear power plants, but the entire German energy market. Even with the gas-fired power plants necessary for the energy transition, there is a great deal of uncertainty due to German energy policy.[23]
Historical drop in costs for solar and wind
The cost reductions of electricity from wind energy and especially photovoltaics between 2010 and 2020 were enormous: minus 70 percent cost of photovoltaics and minus 35 percent cost of onshore wind.
During the same period, the cost of hard coal and natural gas remained almost the same. The costs of biogas have even risen slightly.
The cost of nuclear power has decreased by 20 percent since 2010. But that was just a return to a cost level that had already been reached in the 1980s and 1990s.
The costs of nuclear power plants in Central Europe have always been in flux, between 4 and 6 euro cents per kWh.
The 2015 edition of the “Projected Costs of Generating Electricity” by the NEA includes historical prices dating back to 1981. However, until 2005 only coal, natural gas and nuclear power were taken into account.[24]
Figure 5. Historical full electricity costs by generator in Germany (2010-2021, sum of system, production and CO2 costs in euro cents per KWh, 5 percent discount factor)
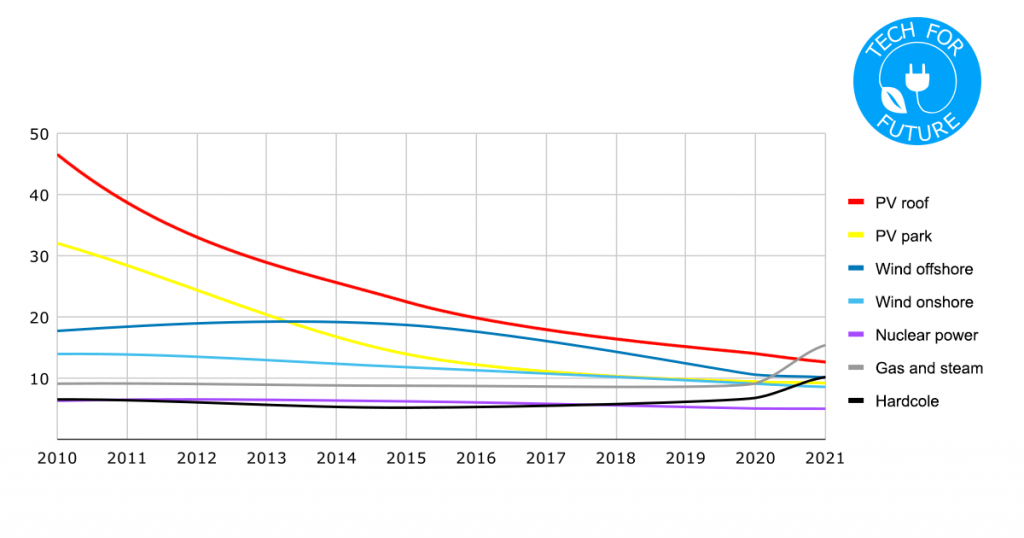
Source: IEA (2010; 2015; 2020), UNECE (2021), Ueckerdt F. et al. (2013), OECD, NEA (2012); 2021 is the author’s extrapolation.
Forecast of the future full costs of solar and wind
However, there is a trend in the opposite direction to the cost reductions for solar and wind. The system costs rise exponentially with an increasing number of additional buildings and an increasing proportion of the energy grid.
If a country expands solar and wind too quickly, the system costs rise faster than the generation costs can fall.
In Germany, it is a political goal to cover 65 percent of the electricity mix in 2030 from renewable sources.[25]
In the first half of 2021 it was only 41 percent.[26] The system share of wind and solar must therefore grow by a good percentage point each year.
This means that the system costs will increase by 2030: plus 80 percent increase in system costs for photovoltaics and plus 20 percent increase in system costs for wind energy.
If the learning curve continues as before with exponential declines in costs for wind and solar, this will be contrasted by 2030: minus 78 percent lower generation costs of photovoltaics and minus 46 percent lower generation costs of wind energy.
In the case of solar energy, the increase in system costs will completely erode the cost advantages. There are still around 26 percent cost reductions left for wind energy.
Figure 6. Forecast trend for full PV electricity costs in Germany (2010-2030, generation and system costs in Euro cents per kWh, 5 percent discount rate)
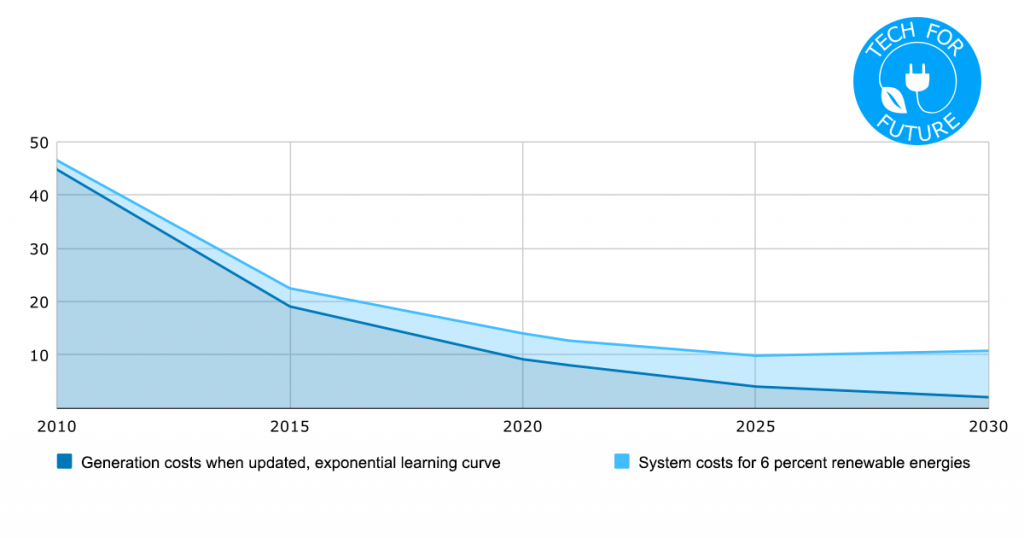
Source: IEA (2010; 2015; 2020), UNECE (2021), Ueckerdt F. et al. (2013), OECD, NEA (2012); 2021 is the author’s extrapolation based on the renewable energy expansion target of the German federal government.
What are heat generation costs?
The heat generation costs for the generation of process heat or district heating in power plants are lower than the electricity generation costs. This is because thermal power plants don’t generate electricity, they generate heat.
The conversion of heat into electricity then takes place with losses. The efficiencies in modern power plants are roughly as follows: ~ 40 percent with nuclear power, coal, gas, biomass; and ~ 60% with gas and steam power plants.
Conversely, this means that thermal power plants are significantly more efficient and therefore cheaper to generate heat. The heat generation costs are a good third of the electricity generation costs.
The low heat generation costs are used in cogeneration (Kraft-Wärme-Kopplung, KWK). KWK power plants with coupled district heating or process heat can therefore significantly reduce their production costs. The problem with KWK and district heating is the extremely seasonal demand. At least process heat is needed all year round.
Which is the cheapest source of energy in Germany?
The cheapest way to generate electricity in Germany is to extend the service life of nuclear power plants at the age of 40 years.
It is all the more tragic that the German federal government wants to shut down climate-friendly nuclear power plants after only 40 years of operation. Yet, it is still not too late to save them.
Notes
[1] Nuclear Engineering International (2019). US Turkey Point licensed to operate for 80 years. URL: https://www.neimagazine.com/news/newsus-turkey-point-licensed-to-operate-for-80-years-7551852
[2] Bandyk M. (2021). How long can a nuclear plant run? Regulators consider 100 years. Utility Dive. URL: https://www.utilitydive.com/news/how-long-can-a-nuclear-plant-run-regulators-consider-100-years/597294/
[3] Trading View (2021). Dutch TTF Natural Gas Futures. URL: https://de.tradingview.com/symbols/NYMEX-TTF1!/
[4] Trading View (2021). Rotterdam Coal Futures. URL: https://de.tradingview.com/symbols/ICEEUR-ATW1 percent21/
[5] Ember (2021). Daily Carbon Prices. EUA (EU ETS) Futures. URL: https://ember-climate.org/data/carbon-price-viewer/
[6] EFI NET (2021). Energiemarkt Zwölfmonatsrückblick vom 1. September 2021. URL: https://efi-net.de/energiemarkt-zwoelfmonatsrueckblick-vom-1-september-2021/
[7] Average cost given by the IEA (2020) for Central European countries Germany, Austria, Switzerland, Denmark, Belgium, France and the Netherlands. The fuel costs of hard coal and natural gas have doubled compared to the study values. Due to a lack of data, the global mean value is used for hard coal and the mean value from Italy for biomass. In the case of domestic lignite, due to a lack of data the value of a dedicated study on German costs is used based on: Booz & co (2012). Understanding Lignite Generation Costs in Europe. URL: https://www.dei.gr/documents2/investors/meleth percent20booz/understanding percent20lignite percent20generation percent20costs percent20in percent20europe.pdf
[8] OECD, NEA (2012). Nuclear Energy and Renewables. System Effects in Low-carbon Electricity Systems. URL: https://read.oecd-ilibrary.org/nuclear-energy/nuclear-energy-and-renewables_9789264188617-en#page1
[9] Ueckerdt F. et al. (2013). System LCOE: What are the costs of variable renewables? Energy. URL: https://www.sciencedirect.com/science/article/abs/pii/S0360544213009390/
[10] Fraunhofer Institut (2021). Öffentliche Nettostromerzeugung in Deutschland in 2021. URL: https://energy-charts.info/charts/energy_pie/chart.htm?l=de&c=DE&interval=year
[11] IEA, NEA. (2020). Projected Costs of Generating Electricity. URL: https://iea.blob.core.windows.net/assets/ae17da3d-e8a5-4163-a3ec-2e6fb0b5677d/Projected-Costs-of-Generating-Electricity-2020.pdf
[12] Sukunta M. (2018). EIA uses two simplified metrics to show future power plants’ relative economics. US Energy Information Administration. URL: https://www.eia.gov/todayinenergy/detail.php?id=35552
[13] Enkhardt S. (2020). EEG-Konto nur noch knapp 1,1 Milliarden Euro im Plus. pv magazine. URL: https://www.pv-magazine.de/2020/05/12/eeg-konto-nur-noch-knapp-11-milliarden-euro-im-plus/
[14] Blümm F. (2021). Tote pro TWh: Welche ist die sicherste Energiequelle? Tech for Future. URL: https://www.tech-for-future.de/sicherste-energiequelle/
[15] finanzen.net (2021). CO2 European Emission Allowances. URL:
[16] Carbon Brief (2021). Q&A. The social cost of carbon. URL: https://www.carbonbrief.org/qa-social-cost-carbon
[17] Pezzey J.CV. (2018). Why the social cost of carbon will always be disputed. WIREs Climate Change. URL: https://wires.onlinelibrary.wiley.com/doi/full/10.1002/wcc.558
[18] Alberici S. et al (2014). Subsidies and costs of EU energy. European Commission. URL: https://ec.europa.eu/energy/sites/ener/files/documents/ECOFYS percent202014 percent20Subsidies percent20and percent20costs percent20of percent20EU percent20energy_11_Nov.pdf
[19] Blümm F. (2021). Energie & Umwelt: Welche Energiegewinnung ist am umweltfreundlichsten? Tech for Future. URL: https://www.tech-for-future.de/umwelt-energie/
[20] UNECE (2021). Life Cycle Assessment of Electricity Generation Options. URL: https://unece.org/sites/default/files/2021-10/LCA-2.pdf
[21] Bünger B., Matthey A. (2020). Methodenkonvention 3.1 zur Ermittlung von Umweltkosten. Umweltbundesamt. URL: https://www.umweltbundesamt.de/sites/default/files/medien/1410/publikationen/2020-12-21_methodenkonvention_3_1_kostensaetze.pdf
[22] IEA (2020). Levelised Cost of Electricity Calculator. URL: https://www.iea.org/articles/levelised-cost-of-electricity-calculator
[23] NTV (2021). RWE reduziert Kraftwerkskapazität um ein Drittel. URL: https://www.n-tv.de/wirtschaft/der_boersen_tag/RWE-reduziert-Kraftwerkskapazitaet-um-ein-Drittel-article22248736.html
[24] NEA (2015). Projected Costs of Generating Electricity – 2015 Edition. URL: https://www.oecd-nea.org/jcms/pl_14756/projected-costs-of-generating-electricity-2015-edition?details=true
[25] Bundesregierung (2021). Erneuerbare Energien. Ein neues Zeitalter. URL: https://www.bundesregierung.de/breg-de/themen/energiewende/energie-erzeugen/erneuerbare-energien-317608
[26] Destatis (2021). Stromerzeugung im 1. Halbjahr 2021: Kohle wichtigster Energieträger. URL: https://www.destatis.de/DE/Presse/Pressemitteilungen/2021/09/PD21_429_43312.html
*Translated from the original with kind permission from the author: Blümm F. (2021). Vollkosten pro kWh: Welche ist die günstigste Energiequelle? Tech for Future. URL: https://www.tech-for-future.de/kosten-kwh/
One comment