_ Eric Kaufmann, professor of politics, Birkbeck College, University of London; Research Fellow, Center for the Study of Partisanship and Ideology (CSPI). 30 May 2022. *
Summary
- The last decade has seen a precipitous rise in the share of Americans identifying as LGBT, particularly among the youngest adults. Today, among those under 30, a wide range of surveys converge on a number of around 20 percent.
- Government data from Canada and the UK indicate that surveys might be overestimating the extent of the rise in LGBT identity. This caveat must be kept in mind in understanding this report. Nonetheless, these government sources indicate that the trend is real, even if less reliable surveys might exaggerate it. The UK’s Office for National Statistics finds that 7.6 percent of those 16-24 identify as LGBT, which can be taken as a low-end estimate for that country.
- The most popular LGBT identity is bisexual, which is significantly more common among women than men.
- When we look at homosexual behavior, we find that it has grown much less rapidly than LGBT identification. Men and women under 30 who reported a sexual partner in the last five years dropped from around 96 percent exclusively heterosexual in the 1990s to 92 percent exclusively heterosexual in 2021. Whereas in 2008 attitudes and behavior were similar, by 2021 LGBT identification was running at twice the rate of LGBT sexual behavior.
- The author provides a high-point estimate of an 11-point increase in LGBT identity between 2008 and 2021 among Americans under 30. Of that, around 4 points can be explained by an increase in same-sex behavior. The majority of the increase in LGBT identity can be traced to how those who only engage in heterosexual behavior describe themselves.
- Very liberal ideology is associated with identifying as LGBT among those with heterosexual behavior, especially women. It seems that an underlying psychological disposition is inclining people with heterosexual behavior to identify both as LGBT and very liberal. The most liberal respondents have moved from 10-15 percent non-heterosexual identification in 2016 to 33 percent in 2021. Other ideological groups are more stable.
- Very liberal ideology and LGBT identification are associated with anxiety and depression in young people. Very liberal young Americans are twice as likely as others to experience these problems. 27 percent of young Americans with anxiety or depression were LGBT in 2021. This relationship appears to have strengthened since 2010.
- Among young people, mental health problems, liberal ideology, and LGBT identity are strongly correlated. Using factor analysis in two different studies shows that assuming one common variable between all three traits explains 40-50 percent of the variation.
- Because the rise in LGBT identity is so heavily concentrated on the political left, its influence on the balance of power between the two parties is likely to be limited.
- College students majoring in the social sciences and humanities are about 10 points more LGBT than those in STEM. Meanwhile, 52 percent of students taking highly political majors such as race or gender studies identify as LGBT, compared to 25 percent among students overall.
- Various data sources indicate that gender nonconformity – trans and non-binary identity – reached its peak in the last few years and has started to decline.
- What kind of high school or college a young person attends poorly predicts their likelihood of identifying as LGBT. The one exception is Liberal Arts colleges, where 38 percent of students describe themselves in this way. This indicates that schooling might not have a large effect on changes in LGBT identity.
- Overall, the data suggest that while there has been an increase in same-sex behavior in recent years, sociopolitical factors likely explain most of the rise in LGBT identity.
Introduction
In April, Ross Douthat observed that the share of young Americans identifying as lesbian, gay, bisexual, or transgender had risen precipitously over the last decade. This, he argued, was the context behind what he termed the new “LGBTQ Culture War” in politics and the media. Douthat set out three possible explanations for the phenomenon:
- LGBT, like left-handedness, is a true expression of the range of human physiological diversity, which until now had been repressed by conservative social mores.
- The rise in LGBT represents a form of youthful exploration, and many will revert back to heterosexual and cisgender identification in later life.
- Alternative sexual identities are a form of social contagion, incubated online and by educational and medical institutions.1
The battle over Florida’s Parental Rights in Education Bill, dubbed the ‘Don’t Say Gay’ bill by progressives, is emblematic of this new culture war.2 Likewise, a claimed 1,000 percent rise in transgender identity since 2010 has been hotly debated.3 Is this a result of socialization and imitation, or does it spring from the lifting of social barriers? This report finds evidence for both the first and third propositions above. However, it posits a vital distinction between LGBT identity and behavior. The youthful surge is mainly about LGBT identity, with considerably less change in sexual behavior. The rise is greatest for bisexuality, especially among females, with less change for gays and lesbians. The growth in LGBT identification shows no signs of slowing down among the young, but there is compelling evidence that gender nonconformity peaked around 2020 and declined in 2021. It appears less prevalent among teenagers than those in their early twenties.
In addition, there is an important political dimension to the rise. This report finds that much of the LGBT rise has occurred among very liberal or far left-wing young people. Is this because such people are more liberated, or because LGBT is now a kind of political identity? The evidence reviewed here indicates that an explicitly political motivation may be at work among whites and the university educated, but this is less likely to account for the rise in LGBT identity among young minorities and those without a college education.4 The data suggest that while progressives form the core of the movement, there has also been a liberal shift in the broader culture that has affected a wider range of people. This in turn raises the question of the political implications of the LGBT surge. If, as the data show, sexual orientation is highly correlated with political beliefs, then might we expect to see Democrats benefit from this shift in the future? This report suggests perhaps not, as the LGBT rise is taking place largely within the liberal voting bloc, limiting its potential to shift the partisan balance.
Sexual Orientation: Nature or Nurture?
There is an established literature on sexual orientation and the degree to which it is heritable, shaped by early life experience, or by broader cultural trends. Twin studies show that identical twins can have different sexual orientations, suggesting that both genes and environment play a role.5 In terms of psychometrics, an early measure of sexual behavior was the Heterosexual-Homosexual Rating Scale, known as the Kinsey Scale after the pioneering sexuality researcher Alfred Kinsey who first introduced it in Sexual Behavior in the Human Male (1948). The scale ranges from 0, completely heterosexual, to 6, completely homosexual, with 3 representing equal sexual attraction to men and women.
In the 1950s, Kinsey claimed that 37 percent of men and 11 percent of women had a same-sex experience, though his sample has been criticized for having a selection bias. Subsequent research based on physiological measures of arousal finds that many more people experience “incidental homosexual feelings and contacts” than “persistent and strong feelings and frequent same-sex experiences.” Research also finds that male arousal is more bimodal and female arousal more spectral. This links to accumulated survey findings in recent decades showing that women (87 percent) are less likely than men (93 percent) to identify as ‘completely heterosexual’ on the Kinsey Scale.6
These findings indicate that there is physiological variation in patterns of sexual attraction. Society creates rules that govern when we express emotions, such as when it is appropriate to laugh or cry.7 Likewise, we might expect that culture and incentives can play a role in repressing or encouraging people to identify with their feelings, however fleeting. The evidence here appears to show that people with strong attractions, especially liberals, no longer feel repressed when it comes to identifying as non-heterosexual. However, it also indicates that very liberal young people with incidental homosexual feelings are increasingly identifying as LGBT. I posit that a common psychological orientation underlies both strong political liberalism and non-heterosexual identification. This has interacted with a more modernist, transgressive youth culture. Subgroups that are equipped with the right psychological predispositions are pushed towards identifying as both LGBT and very liberal.
The Rise of the LGBT Population?
There has been a dramatic rise in the LGBT share of the US population since 2012, and especially since 2017. Gallup’s 2021 annual survey of more than 12,000 American adults found a pronounced rise, from 5.6 percent in 2020 to 7.1 percent in 2021. In fact, this was twice as high as the share in 2012, driven largely by rapid LGBT growth among Gen Z and Millennials. The General Social Survey (GSS) fields a smaller sample than Gallup of around 2,000 people, but is known as a very high-quality, nationally representative survey. The 2021 GSS, like the Gallup data, saw LGBT share tick up to 7.6 percent from 6 percent in 2018 and 4 percent in 2012.
It is important to recognize that young people who are high in psychological openness or other characteristics associated with non-heterosexual identity may be more likely to complete surveys, and this may be biasing the data. In Britain, YouGov finds that a quarter of the 5,407 18-20-year-olds in its Profiles panel in 2022 identified as LGBTQ, with no clear difference by age.8 However, the 2019 official Office of National Statistics (ONS) figures, using a similar question on a 320,000 national sample, finds that only 7.6 percent of 16-24 year-olds identified as LGBTQ in its most recent release.9 This suggests the share of sexual minorities could be overstated in surveys by a factor of 2 or 3. And if we compare the 0.8 percent transgender and non-binary share of Gen-Z in the 2021 Canadian census with Gallup’s 2.1 percent transgender Gen-Z estimate for the United States in the same year, it seems plausible that the gender nonconforming share is less than half of what surveys suggest. While Canadian census and UK government data suggest that surveys are overestimating the share of LGBT-identifying individuals, they also indicate that the rise in LGBT identity over time is real. Nonetheless, in reviewing the data in this paper, it is important to keep in mind that the top-line results on LGBT identity and behavior might be exaggerated.
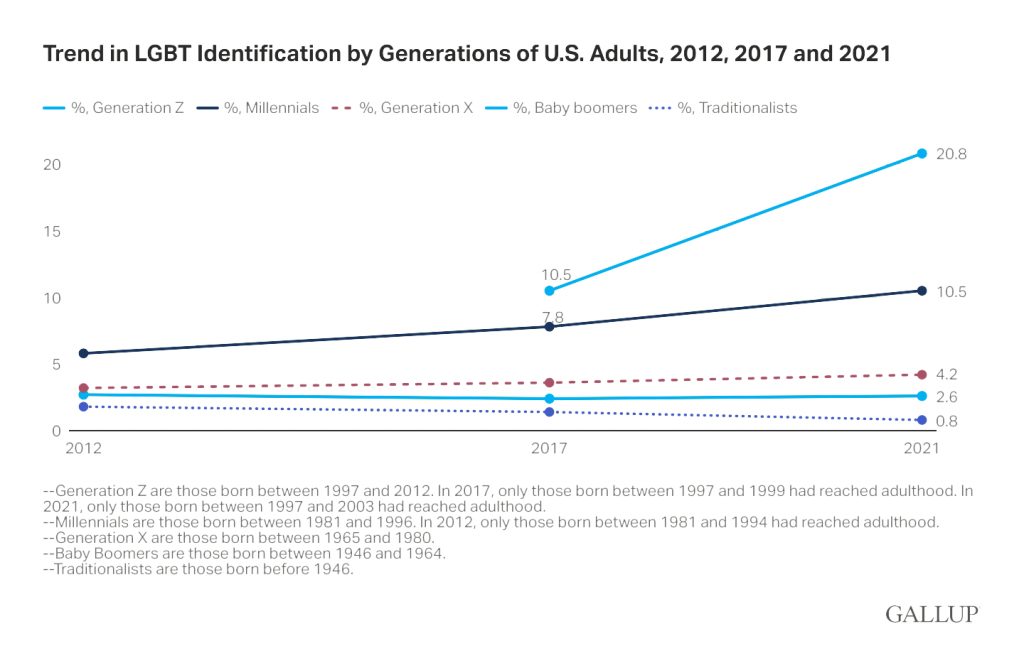
As Figure 1 reveals, the sharpest increase in LGBT share according to Gallup was among Gen Z, born between 1997 and 2012 (i.e., now under 25), with the LGBT proportion doubling from 10.5 percent in 2017 to 20.8 percent in 2021. The share also rose impressively among Millennials (born 1981-1996, now aged 26-41), from 7.8 to 10.5 percent of the total. The trends in other generations, by contrast, were relatively stable, with a mere 4.2 percent of Gen X (now 42-57) and 2.6 percent of Boomers (now 58-76) identifying as anything other than heterosexual.
Figure 1.
Source: Jones 2022.(10)
The GSS tells a similar generational story. Gen Z’s LGBT share rose from 9.4 percent in 2016 to 12.1 percent in 2018 to 19.8 percent in 2021. Millennials increased less, from 6.9 percent in 2012 to 10.8 percent in 2018 to 13 percent in 2021. Among Gen X the numbers were more modest: 5.1 percent in 2012, 4.4 percent in 2018, and 8.8 percent in 2021. For Boomers the figures showed the lowest rise, from 2.1 percent in 2012 to 2.7 percent in 2018 and 4 percent in 2021. It is important to note that GSS used an online rather than face-to-face survey in 2021, which may have boosted the LGBT share if a stigma is still attached to identifying as LGBT. Even so, we see a pattern similar to Gallup: a substantial rise between 2017-18 and 2021. In absolute terms, this is most pronounced among Gen Z, but in the GSS it encompasses virtually all generations.
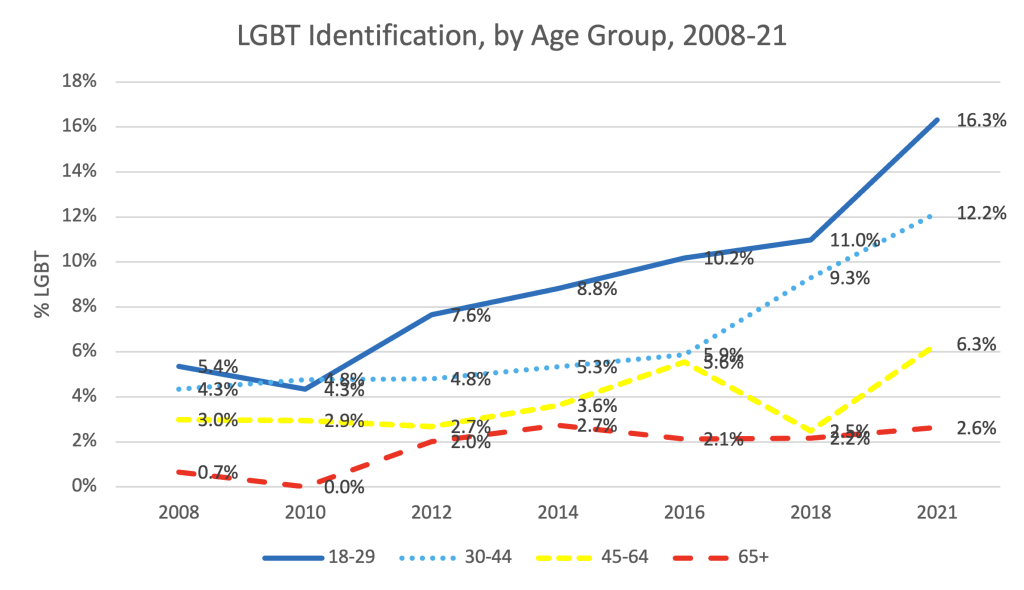
Since generational analysis is confounded somewhat by age, a clearer picture appears when examining trends over time by discrete age groups. Figure 2 shows the results by fixed age group for each year of the GSS. The age groups contain a similar number of people each year, and this permits us to notice a marked change within each age band over time. The share of LGBT individuals among Americans under 30 jumped from 4.8 percent in 2010 to 16.3 percent in 2021 but also rose substantially among those aged 30 to 44 and, with some noise, within the 45 to 64 group. While the raw point increase is greatest for those under 30, almost all age groups experienced a similar percentage increase, between 100 and 200 percent.
Figure 2.
Source: General Social Survey (GSS), 2008-2021. Low sample size, so single years should be interpreted with caution.
Youth LGBT Identification in Other Large Datasets
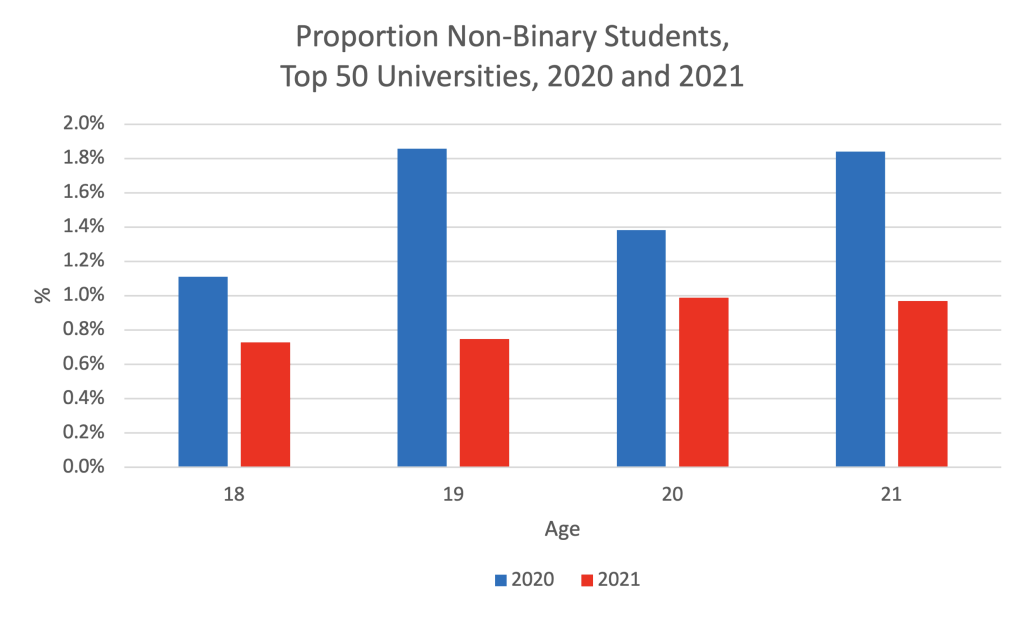
For further comparison, the Foundation for Individual Rights in Education (FIRE)’s 2020 and 2021 surveys of a combined sample of 57,000 undergraduate students at top US universities showed a statistically significant increase in non-heterosexual identification from 18.6 percent in 2020 to 25.7 percent in 2021. Age made no statistically significant difference, but students in 2021 were considerably more likely to identify as LGBT than those in 2020. Though FIRE expanded its coverage from the leading 50 colleges to 150 (mainly elite) schools between the two years, this does not account for the difference. When I examine the change within the original 50 colleges surveyed in 2020, there is a rise in LGBT share from 18.6 percent in 2020 to 24.5 percent in 2021.
The Cooperative Congressional Election Study (CCES), which polls over 60,000 individuals each year, finds that the LGBT share in the (weighted) data among those aged 18 to 25 rose from 21.3 percent in 2016 to 27.9 percent in 2020. While the figures in the FIRE and CCES are somewhat higher than in the Gallup or GSS, we see the same broad trend: a substantial increase in non-heterosexual identity from the mid-2010s to the present, with over 20 percent of young people identifying as LGBT.
The Distinctive, but Not Exclusive, Rise of Bisexuality
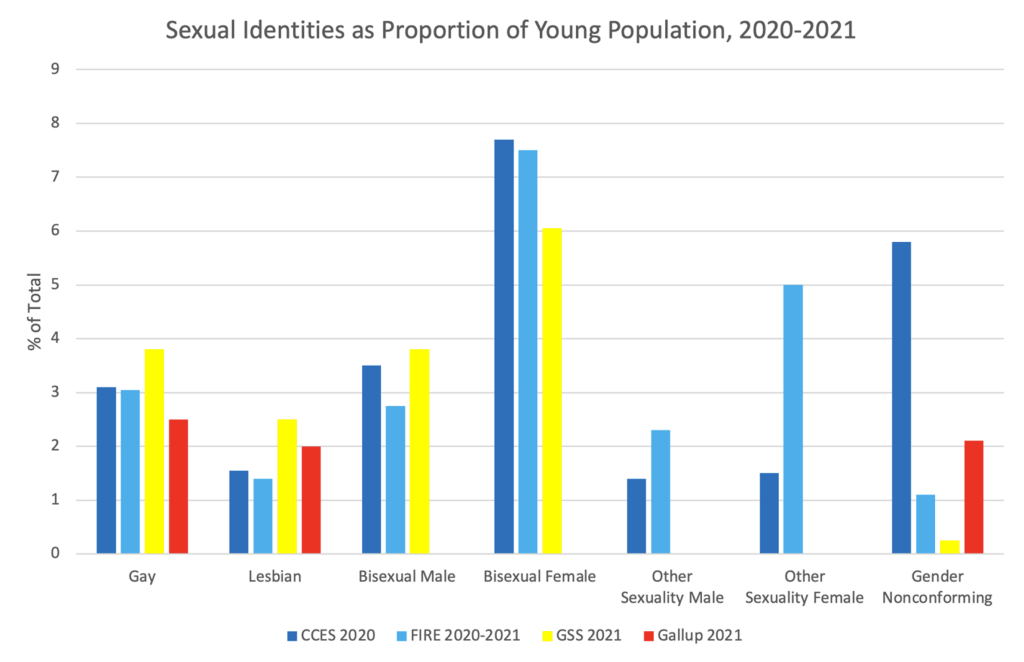
Figure 3 breaks out the main components of LGBT identification across four surveys.11 The numbers broadly show that bisexuality is between 50 and 300 percent more prevalent among women than men. By contrast, homosexuality is 50 to 200 percent more common among men than women. The ‘other’ category varies a great deal and is affected by question wording, as FIRE has the richest set of options among the survey institutions, including pansexual, queer, questioning, and other. Whether students are more likely to select one of these, or question wording plays a key role, is difficult to ascertain.
Finally, the gender nonconforming figures show a great deal of variability, with just a lone individual under 30 identifying as such in the entire GSS in 2021 to nearly 800 individuals (2.4 percent) among young people surveyed by the CCES in 2020. The CCES is the least representative in terms of sampling frame, even as data are weighted on major demographic variables. Thus we should take the 6 percent figure for trans identification with caution. The overall figure for non-heterosexuals among those under 30 is 16 percent in the GSS, 21 percent in Gallup, 23 percent in FIRE, and 25 percent in the CCES. Factoring in government and census data indicating that surveys may exaggerate the relevant numbers, I am confident that somewhere between 10-20 percent of young Americans today identify as LGBT.
Figure 3.
Source: FIRE 2020, 2021 (N=57,029), CCES 2020 (N=13,699), GSS 2021 (N=233 to 401), Gallup 2021 (N=approximately 2,500). FIRE and CCES figures use data weights. Note that FIRE is a survey of students who are overwhelmingly aged 18 to 24, so is not exactly comparable to the other datasets. Gallup figures are based on Gen Z, aged 18 to 25. CCES and GSS are based on respondents aged 18-29.
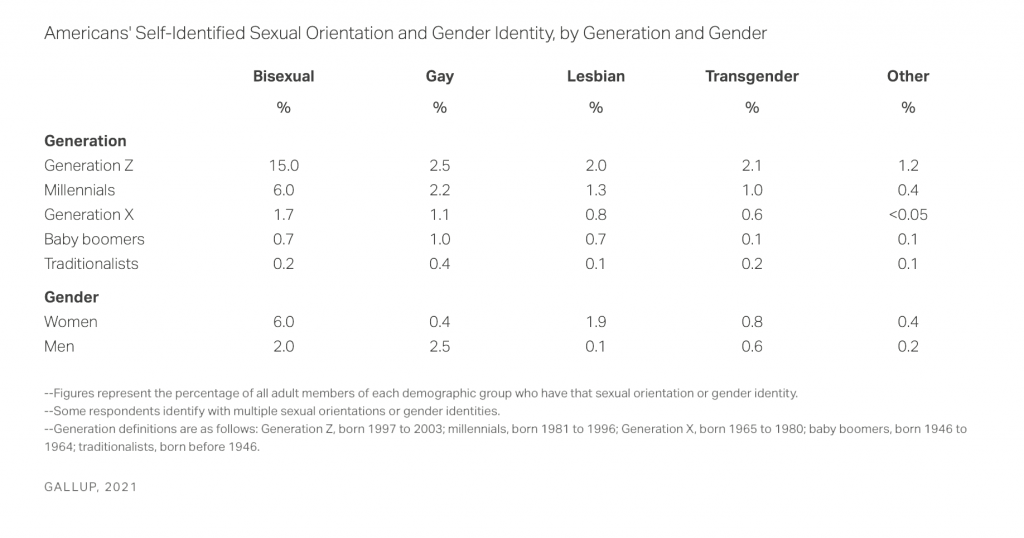
Which identities have grown the most? Decomposing the change by subcategory in the Gallup data in Figure 4 shows that the most popular LGBT category is bisexuality, which stands at 15 percent among Gen Z, 6 percent for Millennials, and just 1.7 percent for the middle-aged Gen X. By contrast, gay and lesbian numbers are much lower. Among Gen Z, the gay share is only 2.5 percent and the lesbian share 2 percent, less even than transgender at 2.1 percent.
The share of bisexuals is 13 points higher among Gen Z compared to Gen X, but the combined share of gays and lesbians among Zoomers is only 2.6 points higher. In proportional terms, there is a generational difference across all LGBT categories, but the absolute point difference between newer and older generations is substantially higher for bisexuality than others. Once again, Gen Z stands out, with Millennials also appearing to embrace new sexualities, albeit to a lesser degree. Gen X and older generations continue to manifest low LGBT shares.
Figure 4.
Source: Jones 2022.
Breaking down the over-time trends among people under 30 by gender in the GSS in Figure 5, we see that the largest category in 2021 is bisexual female at 12.1 percent, followed by bisexual male at 10.3 percent, gay males at 7.6 percent, and lesbians at 5 percent. Trend lines have risen for all four categories since 2008, with bisexuality showing the highest raw point growth. The GSS, however, suffers from low sample sizes for under-30 sexual minorities when they are subdivided by year and age. Thus it is vital to smooth the volatility in the lines over time. Of the trends, the rise in female bisexuality is the most statistically significant, peaking in 2018.
Figure 5.
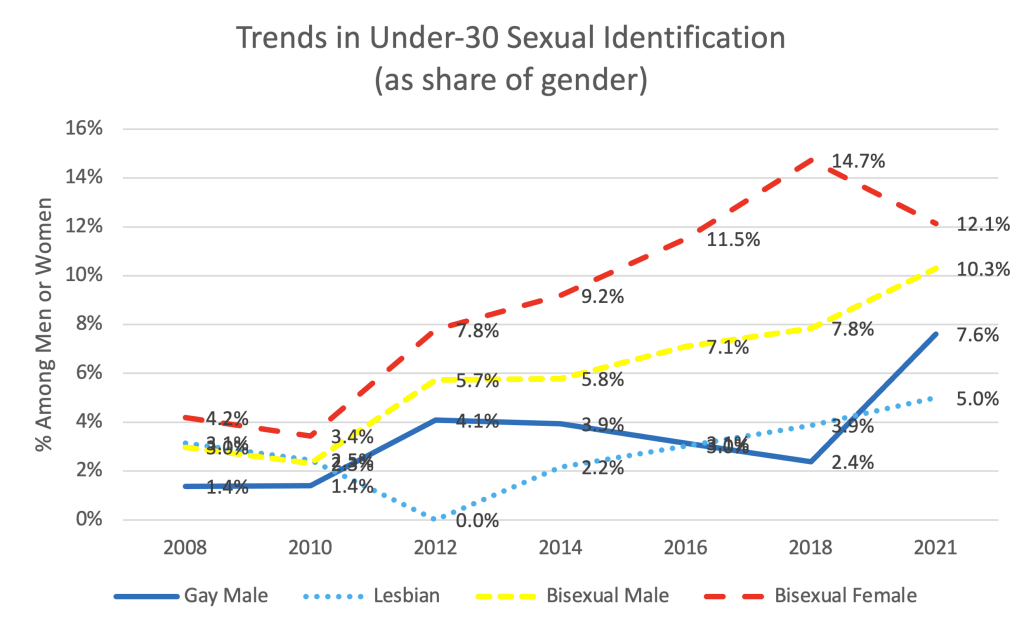
Source: GSS 2008-2021. N ranges from 78 to 204 per age group per year, with cell counts as low as 1 for some male data points, so interpret single years with caution.
The CCES is less nationally representative but has a much higher sample of young people than the GSS. It shows a bigger gap between male and female bisexuality among the under-30s: 15.5 percent of women under 30, but just 7.2 percent of men in 2020. This represents an increase over 2016 for women, who were then 10.8 percent bisexual. Men are unchanged between the two periods. Gays and lesbians combined form approximately 5 percent of the under-30 sample in both 2016 and 2020. Thus CCES seems to indicate growth taking place mainly in the female bisexual group within the young population. This comports with statistical analysis of the GSS, where female bisexual growth also stands out. In the FIRE student samples, focusing only on the schools sampled in both years, 15.5 percent of women in 2021 are bisexual, up from 12.6 percent in 2020. The lesbian share rose to 2.9 percent from 2.1 percent, and the gay share to 6.7 percent from 5.8 percent. The male bisexual share increased as well, to 6 percent from 4 percent in 2020.
What of trans or non-binary identification? In the GSS, such individuals make up only a tiny fraction of the sample, at just 0.25 percent compared to 1.1 percent in the 2021 FIRE student data and 2.1 percent in the 2021 Gallup data among Gen Z. In the FIRE data, the non-binary share of students declined in these years, from 1.5 percent in 2020 to 0.9 percent in 2021. This is a statistically significant drop that will be discussed in a later section on trends in gender nonconformity, where I examine evidence that the phenomenon has peaked and is in decline. The takeaway from the FIRE data is that bisexuals account for slightly under half the LGBT share and have registered increases among both women and men. The gay and lesbian component also increased during 2020-2021 but appears to have risen more slowly than bisexuality in percentage point terms. Overall, the various surveys show that for young people there has been significant growth across all LGBT categories since 2018. That said, the growth since 2010 is greatest for female bisexuality and slower – in percentage point terms – for gays, lesbians, and nonbinary individuals. Yet the rate of growth over 2012 is probably highest for the non-binary group, despite their small share, even as this rise appears to have peaked around 2020.
Sexual Behavior
As noted, prior studies show a degree of flexibility around sexual attraction, especially among women, who have a less sexually bimodal arousal pattern than men. There has been a large rise in non-heterosexual identification since 2017, especially among younger Americans. The question this raises is whether this dramatic change is primarily about psychological affiliation or whether it involves a concrete change in sexual behavior. Fortunately, the GSS contains a number of longstanding questions about sexual behavior that have run since the late 1980s. These can be compared to the LGBT identity questions in the GSS from 2008 onward to examine whether the change is primarily psychological or behavioral and how the two trends have interacted.
The GSS asks respondents, “Have your sex partners in the last 12 months been: a) exclusively male, b) both male and female, or c) exclusively female.” The question was also asked for partners in the previous five years, with the answers very highly correlated with the 12-month responses. In all analyses in this paper, I exclude those who report not having any partner in the relevant time frame, which does not change the results much.12 Due to the small number of same-sex attracted people, there is considerable noise in the sample of young people over time, so I also compare with the total sample, which includes all ages.
In 2021, 12.7 percent of men under 30 reported same-sex (11.4 percent) or mixed-sex (1.3 percent) partners, while in 2018, just 4 percent of men under 30 reported same-sex or mixed-sex partners. This appears to be a large increase, but the sample size of young men reporting same-sex partnering is just 99 in 2018 and 79 in 2021, so the findings are based on a small count. For women, the proportion reporting same-sex or mixed-sex partners dropped in the same period from 10 percent in 2018 to 7.1 percent in 2021. However, this is again based on a small sample. To screen out statistical noise, I present data for the entire range of age groups to minimize error, followed by the smaller sample of under-30s only, across four time periods.
The trend, summarized in Figure 6, shows a significant decline in heterosexual behavior between 1972-92 and 1993-2003 among both men and women. The probability of a woman being heterosexual in behavior dropped from 99 percent to 97 percent, while men fell from 97.5 to 96 percent. After a period of stability, there is a further shift between the 2004-16 and the 2017-21 periods of around 1 point, with women and men converging at around 95 percent heterosexual behavior.
Figure 6.
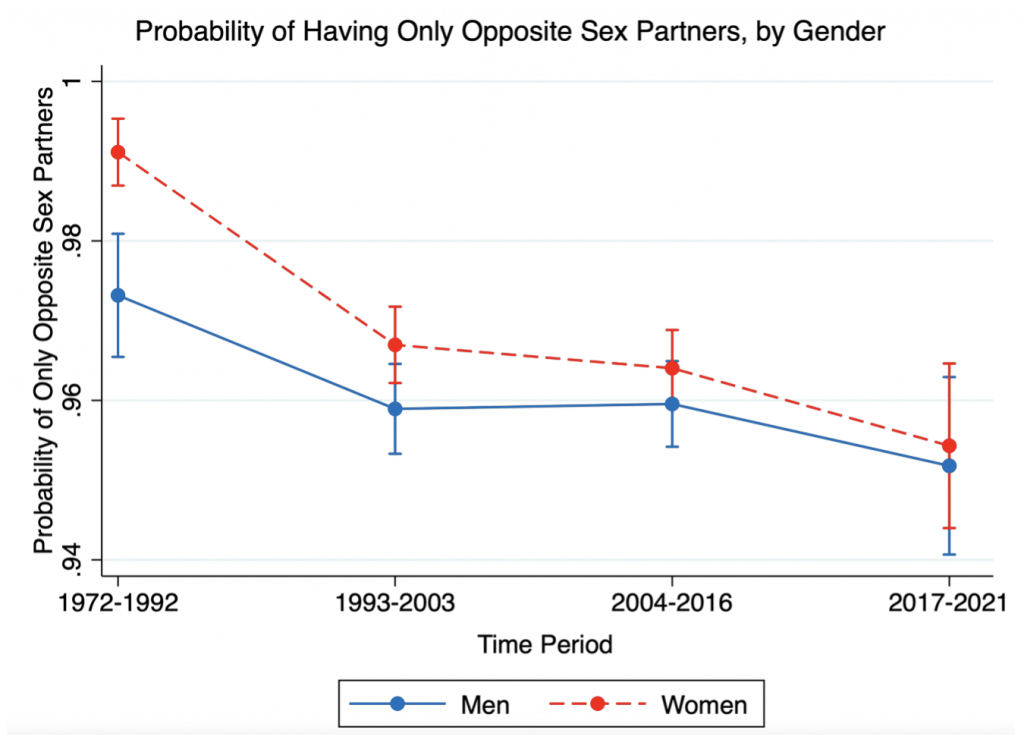
Source: GSS 2008-21. N=27,633. Based on a model predicting opposite-sex behavior. Pseudo-R2=.025. All gender-year interaction effects significant at p<.01 level. Data is only for those who reported having had at least one sexual partner.
Moving to look at the under-30s, and bearing in mind the noisier data due to small samples for young people, Figure 7 reproduces Figure 6 for under-30s only. It shows a similar pattern of change between 1972-92 and 1993-2003. In this period, female heterosexual behavior fell from 98.5 to 96 percent while male sexual activity with women only fell from 97.5 to about 95.5 percent of total sexual behavior. Between 2004-16 and 2017-21 women dropped from 94.5 to 91.5 percent opposite-sex -only partnering while men declined from 96 to 92 percent. Overall, among young people, female heterosexual-only partnering declined 7 points between 1972-92 and 2017-21 while male heterosexual-only behavior declined 5.5 points in the same period. The change in sexual behavior is real, though I cannot discount the possibility that it either became more socially acceptable to report such behavior in a survey over this period or, because the 2021 GSS was conducted online rather than in person due to covid, increased anonymity between 2018 and 2021 may have increased the incidence of reporting same-sex encounters.13
Across all ages, when it comes to sexual behavior women shift 4 points away from heterosexuality and men 2.5 points during 2008-21. These figures show that there has been an increase in homosexuality, but that the biggest change took place at the turn of the century. Even so, there was a genuine increase in reported same-sex behavior between the mid-2010s and early 2020s, albeit of smaller magnitude. Among those under 30 there is more change than among older people, but the share of young people reporting that all their partners were of the opposite sex remains around 92 percent in the 2017-21 period. For men in 2017-21, only 1 point of the 8-point homosexual share consists of men with unconventional sexual behavior – that is, those not exclusively heterosexual – having partners of both sexes. For women with unconventional sexual behavior, those reporting sexual activity with both sexes is 2.7 percent compared to 5.8 percent with women only. The female ratio thus contains more evidence of bisexual behavior than is true for non-heterosexual men, who are mainly same-sex attracted.
Figure 7.
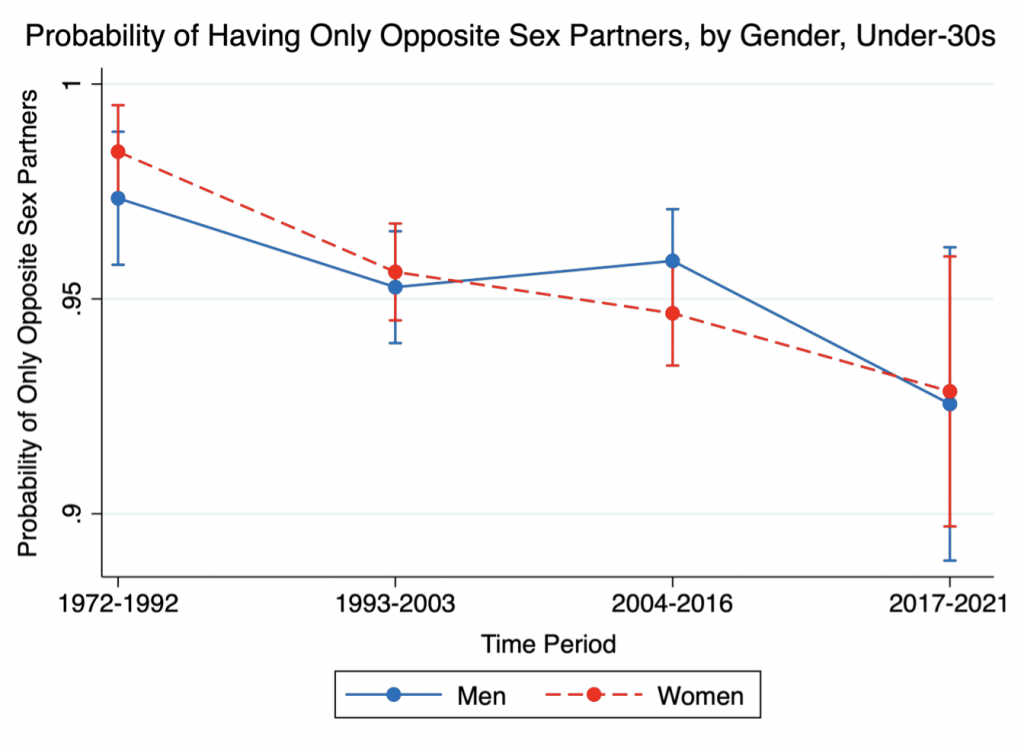
Source: GSS 2008-21. N=6,025. Based on a model predicting opposite-sex behavior. Pseudo-R2=.031. No gender-year interaction effects significant. Data is only among those who reported having had at least one sexual partner.
LGBT identification is higher among women than men, regardless of sexual behavior. 98 percent of men under 30 who reported having only female sex partners in the past year identified as heterosexual. Among women who only had male partners, just 94 percent did so. Meanwhile, 85 percent of men and 80 percent of women reporting same-sex or mixed-sex partners identified as non-heterosexual.
The upshot of all this, as Figure 8 shows, is a growing divergence between sexual behavior and identity among Americans under 30. Whereas in 2008 attitudes and behavior were similar, by 2021 LGBT identification was running at twice the rate of LGBT sexual behavior.
Figure 8.
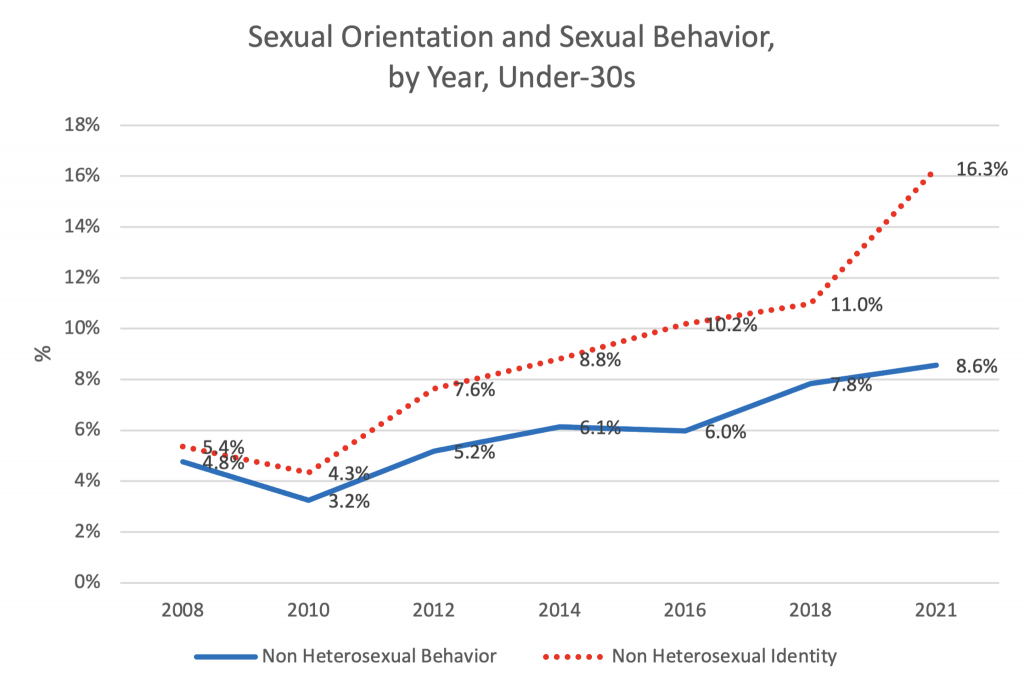
Source: GSS 2008-21. Data on behavior is only among those who reported having had at least one sexual partner. Low sample size so interpret single years with caution.
These trends are especially noticeable among women. In 2008, 3.1 percent of women under 30 identified as lesbian and a further 4.2 percent as bisexual. This total of 7.3 percent roughly matched the 7.4 percent (4.6 percent same-sex, 2.8 percent both-sex) who reported having a female sexual partner in the past year. By 2021, a very different picture had emerged. Twelve percent of young women identified as bisexual and 5 percent as lesbian, but in terms of behavior, just 7 percent had a same-sex experience. Nearly 6 in 10 women who identified as lesbian or bisexual reported having only male sex partners in the past year.
Among men identifying as gay or bisexual, the share reporting only opposite-sex partners was considerably lower than for LGBT women, at 38 percent. Even among men, however, there appears to be a divergence between identification and behavior, with the share of young gay- or bisexual-identifying men reporting female-only sex partners rising from 20 percent in the 2008-14 period to 32 percent in 2016-21. Though the sample only consists of 7-17 individuals per year, and thus error bars are wide, Figure 9 illustrates the statistically significant finding that the share of bisexual women who report having only had male sexual partners over the past five years has risen since 2012. A rising share of women with heterosexual behavior is choosing to identify as bisexual. The data for men are inconclusive.
Figure 9.
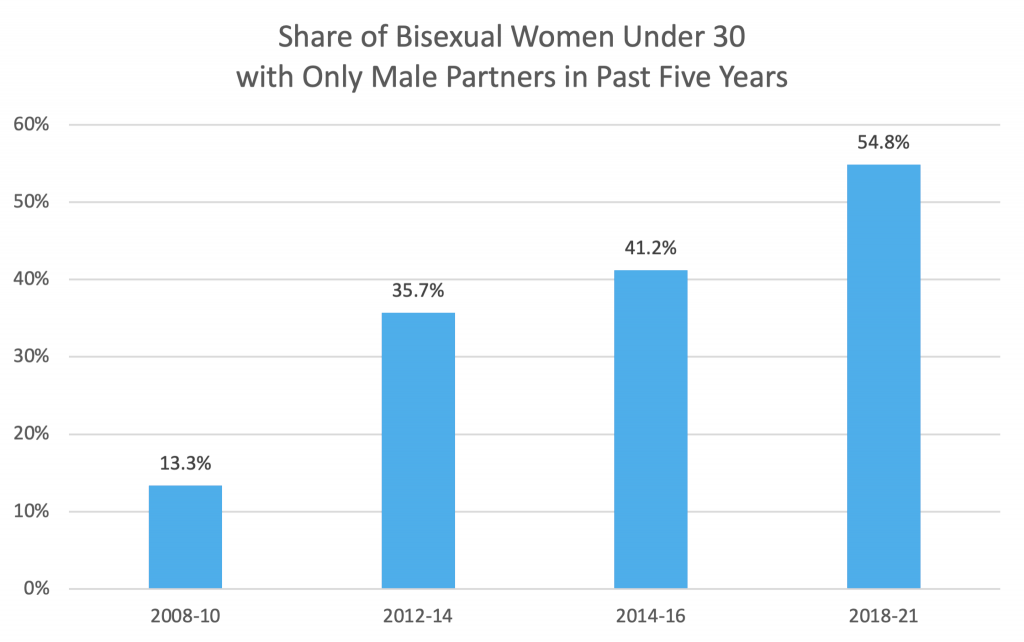
Source: GSS 2008-21. N per year varies from 15 in 2008-10 to between 28 and 34 in other year bands. Year is a statistically significant predictor of a female bisexual having male-only sex partners.
My analysis of GSS data tells us that the trend toward LGBT identity, as distinct from behavior, is stronger in women even as it encompasses both sexes. While the big change has been in LGBT identification, it is important to note that there has also been a modest rise in same-sex behavior. While I cannot rule out the possibility that the rise in same-sex behavior is due to less stigma in reporting, at least some of it seems to represent a genuine change in behavior. In both cases, the trend appears more pronounced among women than men.
The Role of Ideology and Partisanship
Left-wing Americans are significantly more likely to be LGBT than those on the right. Among Americans under 30 in the GSS, 25 percent of people who identify as liberal are LGBT compared to 9 percent of conservatives. In the CCES, the corresponding figures are 36 percent LGBT among liberals and 21 percent for conservatives. Among undergraduate students at top universities in the FIRE data, 33 percent of liberals identify as LGBT compared to 6 percent of conservatives.
Yet what is apparent is that very liberal respondents stand out from moderate liberals in having high LGBT identification. Figure 10 illustrates how the sexual orientation of respondents in three surveys varies along a 5-point self-identified ideology scale. In the FIRE data, 49 percent of ‘very liberal’ students on a 5-point scale call themselves LGBT compared to 5 percent of ‘very conservative’ students. The corresponding LGBT numbers for ideological extremes among under-30s in the CCES 2020 are 43 percent and 13 percent, and in the 2021 GSS they stand at 34 percent and 14 percent. This indicates that young people with conservative views are only around a third as likely to be LGBT as strong liberals, with the gap especially pronounced among elite college students.
Another important pattern emerges from the data. Generally speaking, moving left to right, there is a sharp difference in LGBT identification between strong liberals and weak liberals. In the GSS and FIRE data, the gap between the far left and center left is several times larger than the difference between the center left and moderates. Moderates under age 30 are more like conservatives than liberals, while there is no consistent difference between slight and strong conservatives.
Strong liberals are the most distinctive ideological group. Looking at those under 30, in the CCES, 42 percent of strong liberals identify as LGBT compared to 19 percent of moderates and 13 percent of conservatives. In the FIRE data, 18 percent of moderate students are LGBT compared to the numbers mentioned above of 5 percent for the most conservative and 49 percent of very liberal students. In the 2021 GSS, 34 percent of strong liberals are LGBT compared to 10 percent of moderates and 9 percent of conservatives. Far-left views correspond strongly to higher LGBT identification while far-right views differ much less from the center.
Figure 10.
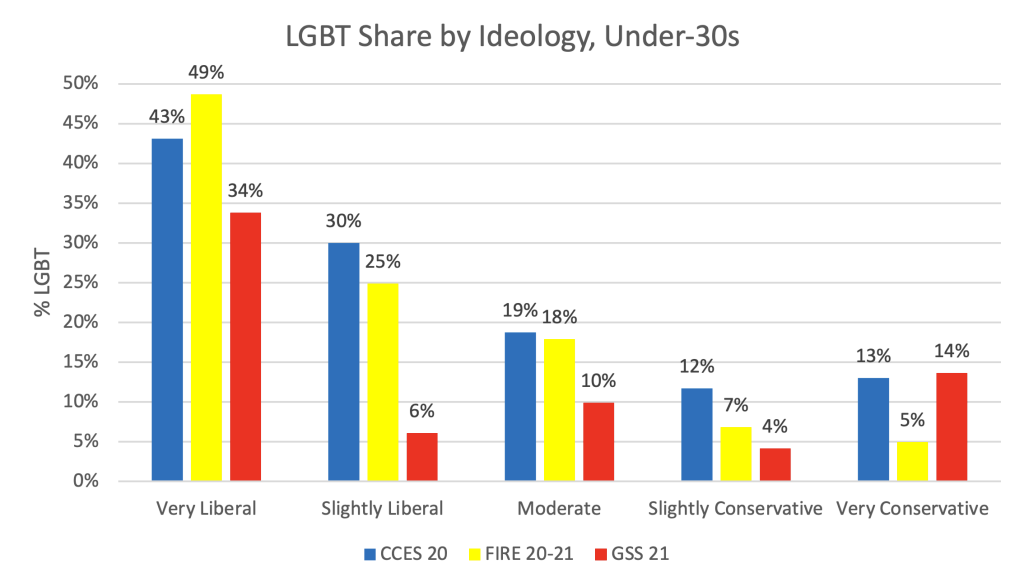
CCES N=13,771; FIRE N=56,860; GSS N=231. Because the GSS numbers are based on a low sample size, use caution in interpreting them.
The pattern over time among the under-30s shows that the largest change in sexual identification has taken place among those identifying as very liberal. While other ideological segments have also experienced some increase in LGBT identification, Figure 11 shows that the most liberal respondents have moved from 85-90 percent heterosexual identification in 2016 to just 66 percent heterosexual identity in 2021. Very liberal people experience a much larger ‘multiplier effect’ from the new transgressive modernist culture than other segments of the population.
Figure 11.
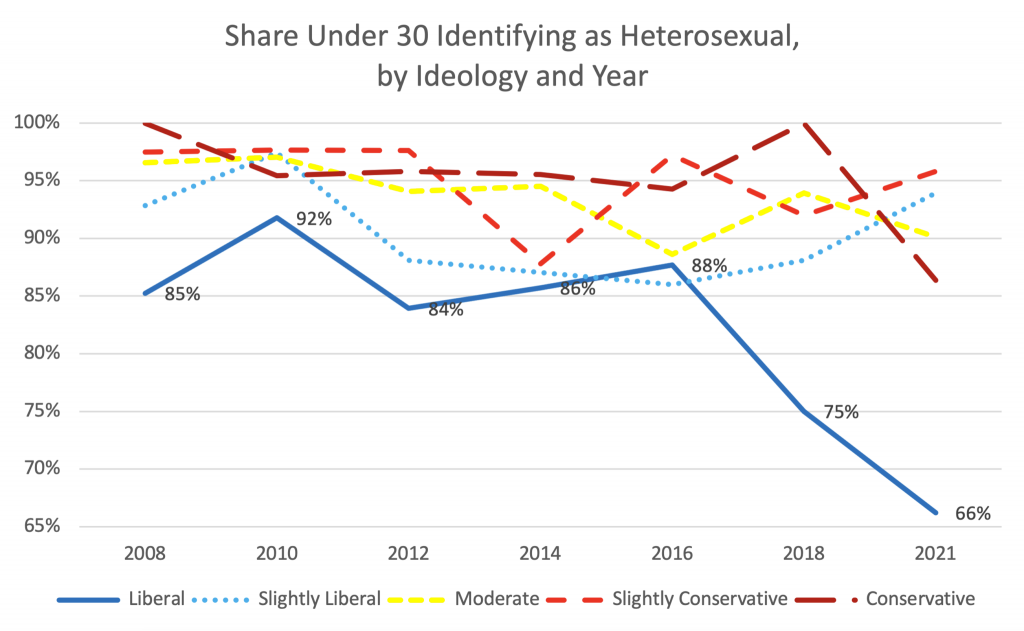
Source: GSS 2008-21. Low sample size, so interpret single years with caution.
What explains the pattern? It could be that LGBT identifiers gravitate to strong liberal self-identification. Or perhaps those with strong liberal views or self-conceptions are more inclined to identify as non-heterosexual. While it is not possible to definitively discern from the data sources whether sexual identity shapes political beliefs or vice-versa – or both are related to some other variable – there is evidence that something beyond political issues or partisanship, such as psychological orientations that underlie ideology, is shaping sexual identity.14
First, it is not readily apparent why being non-heterosexual would have such a powerful impact in moving someone from the center left to the far left, but so little effect in shifting them from the right to the center or center to the moderate left. Comparing answers to the sexual identity question with views on homosexuality and gay marriage shows an important difference. For LGBT issues like attitudes towards gay marriage, strong liberals and conservatives are equally distant from the center. However, when it comes to predicting sexual identity, strong liberals stand out from the rest. When controlling for views on gay marriage and the acceptability of homosexuality, the same pattern – of strong liberals but not conservatives standing apart from the center – obtains. Tolerance of homosexuality is thus unlikely to explain the ideology-LGBT connection. Controlling for the basic liberal-conservative divide, a very liberal self-description is significantly associated with LGBT identity but not with views on LGBT identity.
Second, controlling for LGBT identification, LGBT sexual behavior over the past five years is not significantly associated with a person’s ideology. If same-sex sexual activity was the principal driver of LGBT identification, which in turn causes an increase in liberalism, we would expect LGBT identifiers engaging in same-sex behavior to be more liberal than LGBT identifiers who have only had heterosexual partners. Instead, we find no significant differences in ideology between LGBT identifiers engaging in LGBT sexual behavior and those who have only had conventional sex partners. When compared to all heterosexuals, those engaging in same-sex behavior, especially men, are of course more likely to identify as LGBT. Yet same-sex behavior itself has only an indirect link to being more liberal, via its effect on increasing the likelihood of identifying as LGBT. Something in the psychology of identifying with, rather than behaving as, LGBT is linked to the psychology of identifying as very liberal.
This said, the precise mechanism whereby ideology and sexual identity influence each other needs to be specified. Figure 12 is based on a statistical model that tries to predict whether someone identifies as heterosexual or not. Here liberal respondents under age 30 who have had a same-sex experience in the past 12 months almost all identify as LGBT. Moderates and conservatives who report same-sex experiences are significantly less likely to do so, with moderates who had a same-sex experience having a 30 percent chance of identifying as heterosexual and conservatives a 40 to 50 percent chance of doing so. For men and women across all age groups we find a similar pattern, with moderates and conservatives differing by just 10 percentage points. Either conservatism tends to lead many same-sex attracted people to identify as heterosexual, or an underlying psychological orientation among some same-sex attracted people inclines them to identify as both conservative and heterosexual. This suggests that the rise in LGBT identification is in part because of a lower reticence among same-sex attracted people to identify as LGBT. This is the first of Douthat’s hypotheses, endorsed by progressives.
But a decline in reticence among those with same-sex experience does not account for the majority of the LGBT shift. The leftmost part of the top line in Figure 12 shows that among the most liberal respondents who say they have had no same-sex experiences in the past five years, there is a significantly lower level of heterosexual identification than among heterosexual-behaving slight liberals and moderates. Thus in 2021, 13 percent of very liberal (on a 5-point scale) young women reporting only heterosexual behavior in the past five years identified as LGBT. This drops to 5 percent among moderate and conservative women under 30 with the same sexual history. Among men, the equivalent figures for those who only had conventional sex partners are 9 percent for strong liberals and 5 percent for those in the middle or on the right. What this suggests is that very liberal ideology is associated with identifying as LGBT among individuals engaging in exclusively heterosexual behavior – especially women. It seems that an underlying psychological disposition is inclining people with heterosexual behavior to identify both as LGBT and as very liberal. This likely reflects those that Bailey and Moore termed incidentally-attracted rather than people with strong and sustained same-sex attraction.15
Figure 12.
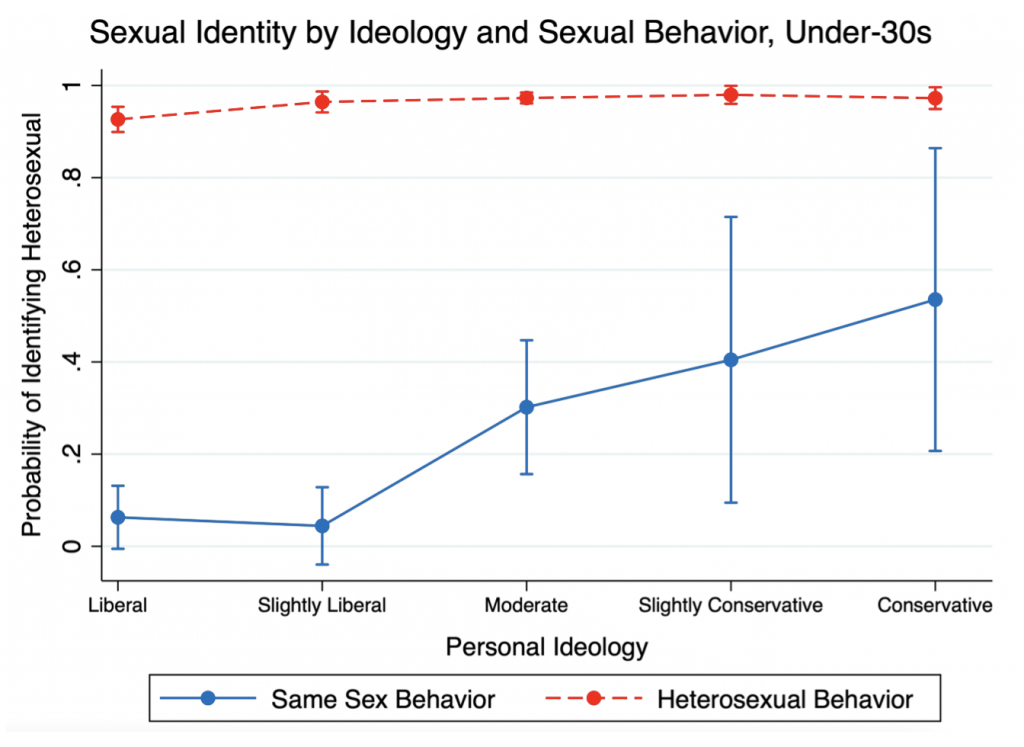
Source: GSS 2008-21. N=1,787. Based on a statistical model that tries to predict whether someone identifies as heterosexual or not on the basis of same-sex behavior and ideology. Pseudo-R2=.463. Controls for gender and age as both affect heterosexual identification. Liberal and years from 2012 to 2021 are all significant at p<.05. No interactions significant.
A third reason pointing to psychological aspects of ideology affecting sexual identity is that issue positions themselves are not clearly connected to LGBT identification. For instance, blacks have a different interpretation of ideology from whites.16 Figure 13, based on a statistical model which tries to predict whether someone identifies as LGBT, shows that views on whether the police make a person feel safe are only correlated with sexual identity among whites, but not among blacks. A similar, if less dramatic, racial difference in correlation holds for abortion and a series of other issues. Hispanics and Asians are somewhat intermediate in that while their issue positions are correlated with the chance of being LGBT, the relationship is weaker than for whites. That is, political issues appear more correlated with sexual identity among whites than blacks, suggesting that LGBT identity is more political among very liberal whites than among very liberal minorities, especially blacks.
Figure 13.
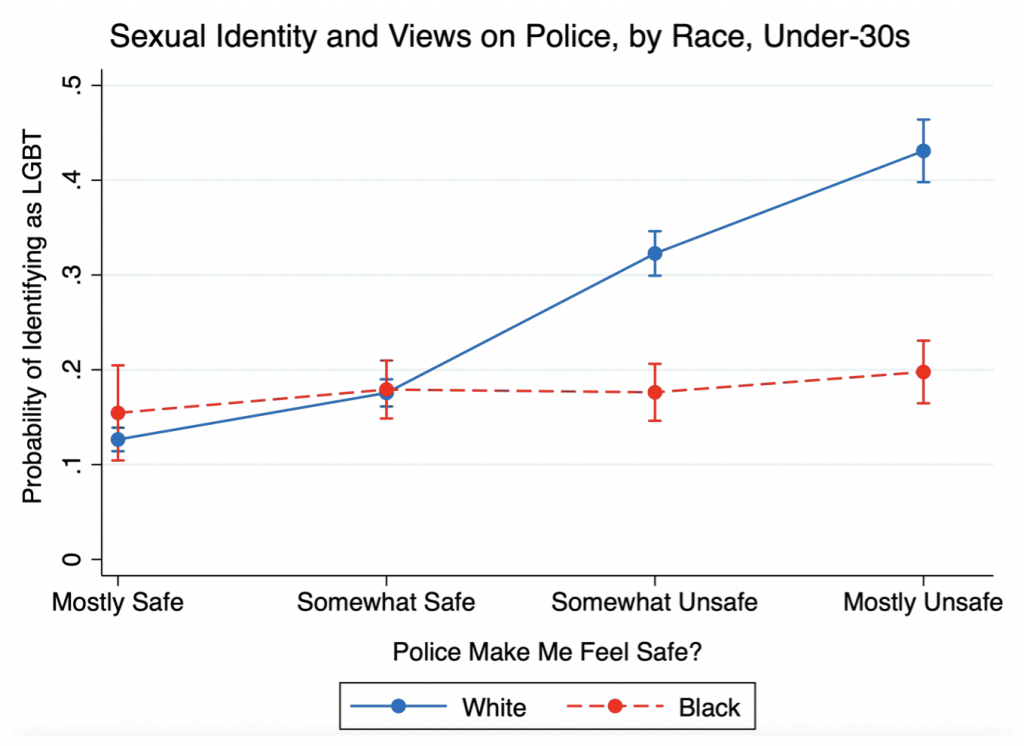
Source: CCES 2020. N=9,501. Based on a statistical model which tries to predict whether someone identifies as LGBT. Pseudo-R2=.063. Controls for gender and age as both affect LGBT identification. Interactions for ‘somewhat unsafe’ and ‘mostly unsafe’ significant at p<.001.
Given the less constrained pattern of issue attitudes underlying their ideology, it is perhaps surprising that among blacks under 30, those identifying as ‘very liberal’ are substantially more likely to call themselves LGBT than black weak liberals or centrists. Something underlying the choice to identify as ‘very liberal,’ beyond issue positions, seems to be associated with a higher likelihood of identifying as LGBT. This speaks to the possibility that the relationship between liberalism and LGBT identity can be explained by psychological openness to experience, conscientiousness, or another underlying disposition like proneness towards conforming to media messaging, rather than issue positions and interests.17
A fourth piece of evidence is that party identity, which is arguably more visible and closer to current events than ideology, is more weakly correlated with sexual orientation than the more abstract notion of ideology. Though ideology and party identification are correlated, Figure 14 shows a different sexuality profile for party identification than for ideology. Focusing on the larger-sample CCES and FIRE surveys, we find little substantial difference in the frequency of LGBT identification between strong Democrats, weak Democrats, and moderates. Many LGBT people are Independents rather than Strong Democrats. Unlike with ideology, the far left does not stand out.
Figure 14.
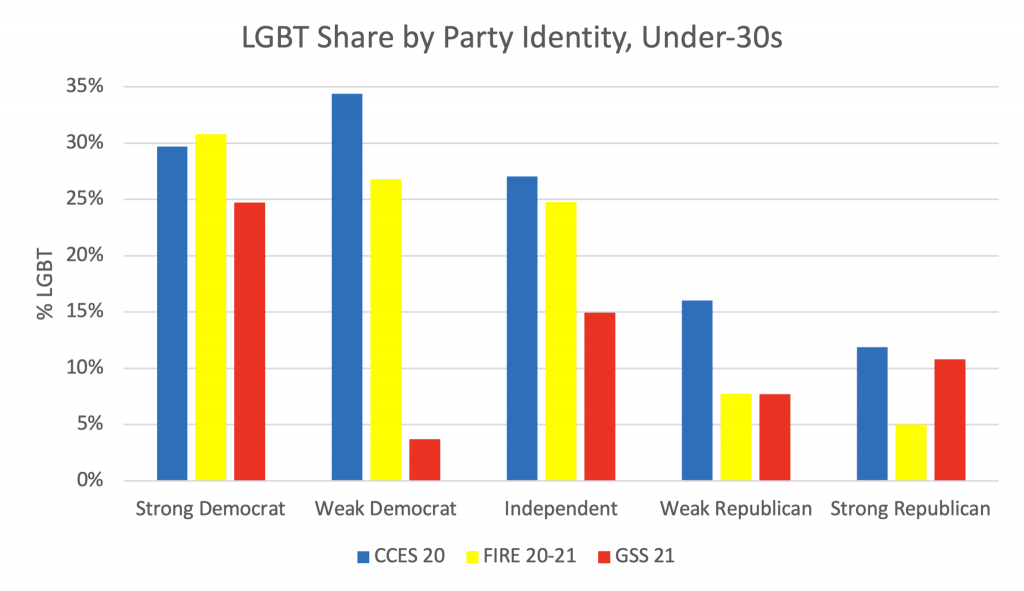
Note: low sample sizes for GSS (231 across all categories), so use caution in interpreting these.
These factors all suggest that the association between very liberal ideology and being LGBT is not simply about homosexual people gravitating to ideologies and parties that will defend their interests. Rather, the psychological factors behind very liberal ideology likely predispose an individual with some same-sex feelings to identify as LGBT.
Left-Wing Politics Matters for Educated Whites
While there is a broader modernist cultural atmosphere favoring the expression of difference, there is also evidence that egalitarian politics matters – at least for white college students. To wit, left-wing attitudes toward the protection of minorities predict higher LGBT identification. Consider Figure 15. White female students in leading US universities who identify as very liberal and support shouting down speakers to prevent them from uttering harmful speech have a nearly 7 in 10 chance of identifying as LGBT. For very liberal minority female students with the same speech attitudes, the probability of identifying as LGBT drops to around .55. At the most pro-free speech end of the scale, very liberal white female students who say shoutdowns are never acceptable are only around half as likely to identify as LGBT as their counterparts who strongly oppose free speech.
Figure 15.
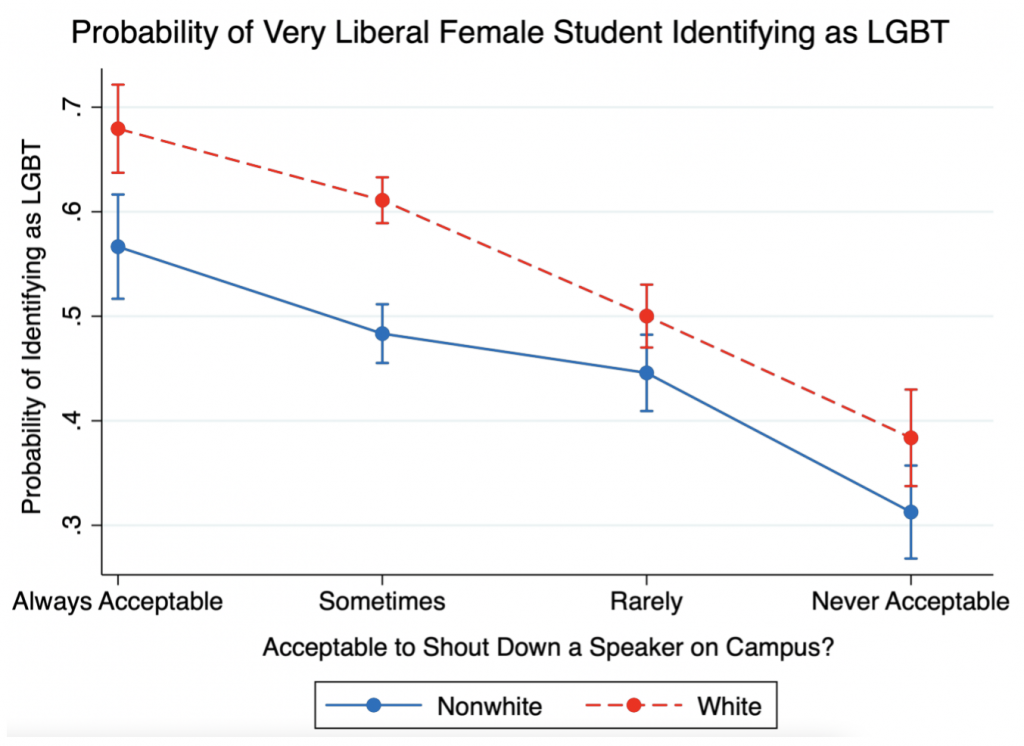
Source: FIRE 2020-2021. N=7,527. Based on a statistical model which tries to predict whether a student identifies as LGBT based on their race and attitude to shoutdowns. Pseudo-R2=.053. Also controls for religion, region, and Ivy League status.
It is worth noting that a person’s views on shoutdowns are nearly as important as their ideology in predicting LGBT identification. While it is likely that non-heterosexual identifiers are more sensitive to speech they consider harmful to their own interests, it is noteworthy that minority and female students, who might be similarly sensitive to discrimination, are much less supportive of shoutdowns than LGBT students. The relatively large and invisible bisexual group opposes shoutdowns as much as gay men, who would be expected to be more likely to experience discrimination. In addition, adding a control for speech attitudes reduces the size of the ideological effect on LGBT identification by a modest amount, suggesting that to some extent, speech attitudes inform ideology or spring from the same underlying inclination.
Two other indicators of the impact of left-wing politics concern the subject matter in which students are enrolled. Students in social sciences and humanities (SSH) fields are about 10 points more LGBT than those in the less politicized science, technology, engineering, and math (STEM) fields. This holds for males and females, whites, and minorities. Meanwhile, 52 percent of students taking highly political majors such as race or gender studies identify as LGBT, including 64 percent of the 109 students in the FIRE survey majoring in gender studies and 47 percent of 285 students majoring in ethnic and racial studies. This compares to 25 percent LGBT identification among students overall. Choice of major significantly predicts LGBT identification even when controlling for ideology, gender, race, and religion.
More generally, Figure 16 illustrates how LGBT identification rises as I adjust the profile of students based on key predictors of LGBT identity in the 57,000-strong FIRE dataset of undergraduates at 150 leading US universities.
Figure 16.
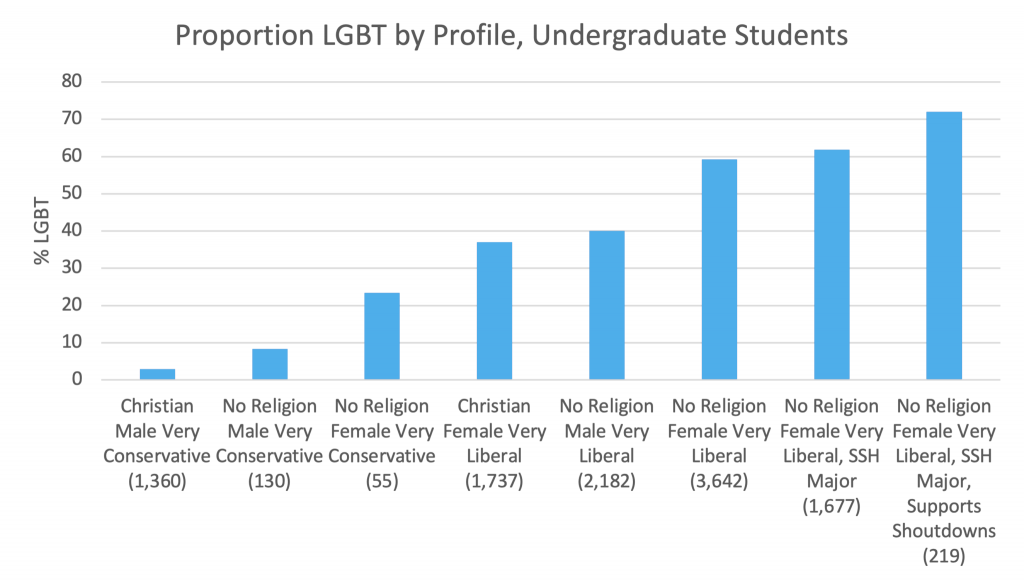
Source: FIRE 2020 and 2021 surveys. Note: Number of cases in parentheses, SSH refers to social sciences and humanities.
Sexual Liberalism and the Wider Culture
Ideology is clearly important in LGBT identification, and very liberal respondents have increasingly identified as LGBT. But the share of very liberal respondents in the GSS has not significantly risen since 2008 among Americans under 30. The fact that age and year matter for LGBT identification while race and university education do not suggests that ideas once considered the preserve of the cultural left have influenced the wider culture within which less politicized individuals live. Acceptance of homosexuality and gay marriage has risen especially quickly since 2004, when similar numbers of people thought homosexuality should be accepted and discouraged. By 2017, the numbers stood at 70 percent for acceptance and 24 percent for discouragement.18 This, I would argue, has permitted those in same-sex partnerships to identify as LGBT more openly. Yet those engaging in LGBT sexual behavior are a small group.
Arguably more important is the way the new liberal culture has encouraged individuals with conventional heterosexual behavior to identify as LGBT. This has made the biggest impact on young, female, and very liberal people. This could be because their sexual feelings are more fluid and open than those of others due to underlying psychological factors, or because they are more influenced by the education system and media. Nonetheless, the rise of LGBT is not a phenomenon limited by race or class. It encompasses both politicized groups like college-educated whites and less politicized groups such as black males and Hispanic immigrants without a degree. Post-Trump polarization and the Great Awokening among educated white liberals seem to have had an impact on sexual identity among elite whites, but likely cannot explain why minorities and those without degrees have experienced a similar trajectory.19
Polarization along issue and party lines tends to be more intense among white and university-educated Americans, who are more likely to sort issues into (often inconsistent) ideological packages and then into party platforms. Minorities vote at lower rates (as with Hispanics or Asians) or tend not to attach ideology to party as much (as with blacks).20 Yet the LGBT component, while more polarized by ideology, is not higher among white or college-educated Americans than among minorities or those with low education. LGBT identity is relatively high among all young people, whether white or nonwhite, college-educated or non-college educated.
In the CCES, there is no significant difference in LGBT share between white and minority Americans under 30, with around 25 percent of both groups identifying this way. In FIRE, the difference between whites and minorities is just 1 percentage point, and in the GSS only 1.5 points. Minority faiths in the CCES and FIRE – especially Jews, Hindus, and Buddhists – register higher LGBT shares than Christians. Moreover, in the CCES, just 81 percent of black men and 67 percent of black women under 30 without a college degree identify as heterosexual.21 The gender difference in LGBT between black men and women under 30 is noteworthy: young black women are similar to young women of other races, but young black men have a lower LGBT share than other men.
For university education, which is commonly associated with aligning issues of ideology to partisanship, the CCES shows that 19 percent of college graduates under 30 are LGBT compared to 26 percent of those without a college degree.22 In the GSS there is no significant difference between the two groups. The more politicized campus experience and exposure to political ideas at university does not lead to a wider difference in LGBT identification between very liberal and very conservative individuals. Young people with and without college degrees are identical in this respect. The LGBT rise may be influenced by identity politics, but is much broader than a woke phenomenon.
What Led to Change?
As noted, we should not overstate the impact of increased toleration of homosexual behavior in accounting for the substantial rise in LGBT identification among the young in recent years. Even if everyone under 30 who had a same-sex experience identified as LGBT in 2021, this would account for no more than 4 points of the 11-point rise in LGBT identity in the GSS among under-30s between 2008 and 2021. Recall that in 2021, 6 in 10 young female LGBT identifiers and nearly 4 in 10 male LGBT young people only had partners of the opposite sex in the previous 12 months. With over 92 percent of survey respondents reporting only heterosexual behavior, such individuals are driving the bulk of the trend.
Overall, three phenomena have influenced the rising LGBT trend:
- Rising same-sex behavior.
- An erosion of the inhibition to identify as LGBT among same-sex attracted people.
- The rise of ‘ideological’ LGBT identification among those with conventional sexual behavior.
In terms of a), the share reporting same-sex behavior increased 4 points among young people over 2008-21. For b), the proportion of young people engaging in same-sex behavior who self-identify as LGBT has approximately doubled, translating into a 2-point increase in LGBT identification. Given that the same-sex partnered share has increased by 4 points, we can assume that, at most, half of this effect on LGBT identification might have been suppressed in 2008. This would render a) and b) similarly important.
Regardless of the mix of a) and b), the two forces together only account for 4 points of the 11-point rise in LGBT identity between 2008 and 2021. These 4 points should be viewed as a maximum, because it excludes young people who reported no sexual partners in the past year and assumes that greater tolerance of homosexuality between 2008 and 2021, and the switch to an online survey in 2021, played no part in people reporting more same-sex behavior. Thus c), higher LGBT identification among those exhibiting heterosexual behavior impacts on a much larger group of people (the 92 percent engaging in heterosexual partnering) and therefore accounts for no less than two-thirds – 7 of the 11 points – of the post-2008 rise.
What might have caused the rise in the share of heterosexual-behaving people opting for LGBT identification? The decline of religion among Millennials and Zoomers is a well-documented trend. Close to 40 percent in these generations are religious ‘nones.’23 In the GSS, the share of under-30s reporting no religion rose from 11 percent in 1990 to 28 percent in 2008 to 46 percent in 2021. Religiosity is connected to sexual identity, as Figure 17 shows. In statistical models, individuals with no religion or who never attend church are over twice as likely to identify as LGBT as those who are Christian or attend regularly.
Figure 17.
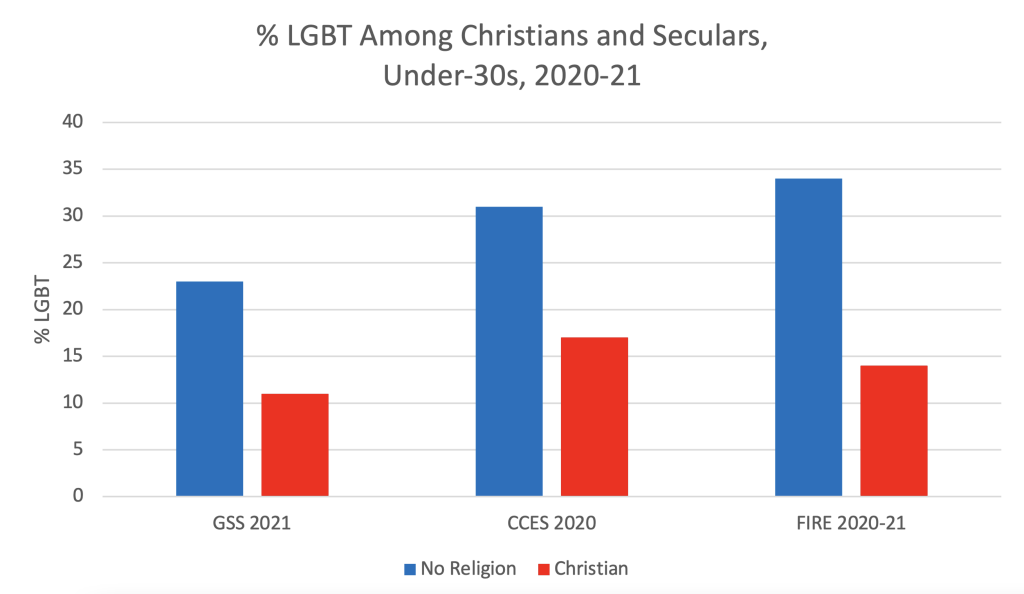
Source: CSPI (2022).
This relationship appears to hold over time as well, as in Figure 18. In years with a higher proportion of young non-religious respondents (typically more recent years), there is a higher share of young LGBT people. However, this is based on just seven aggregated annual data points. While the fit is better than with other variables such as proportion very liberal, I can’t be sure that religious decline is the key factor. It is also the case that religiosity has been declining among young people since the 1980s and fairly steadily since 2004. LGBT identification has also increased in longstanding low-religion societies such as Britain.24 While there is a spurt of non-religiosity in the 2021 data that corresponds to the surge in LGBT identification, there is also a rise in the proportion of very liberal and anxious/depressed people between the 2018 and 2021 surveys and a change in survey methodology. It is therefore unclear how much of the time trend of LGBT growth is associated with religious decline as compared to, for example, a more general increase of transgressive modernism in the culture.
Figure 18.
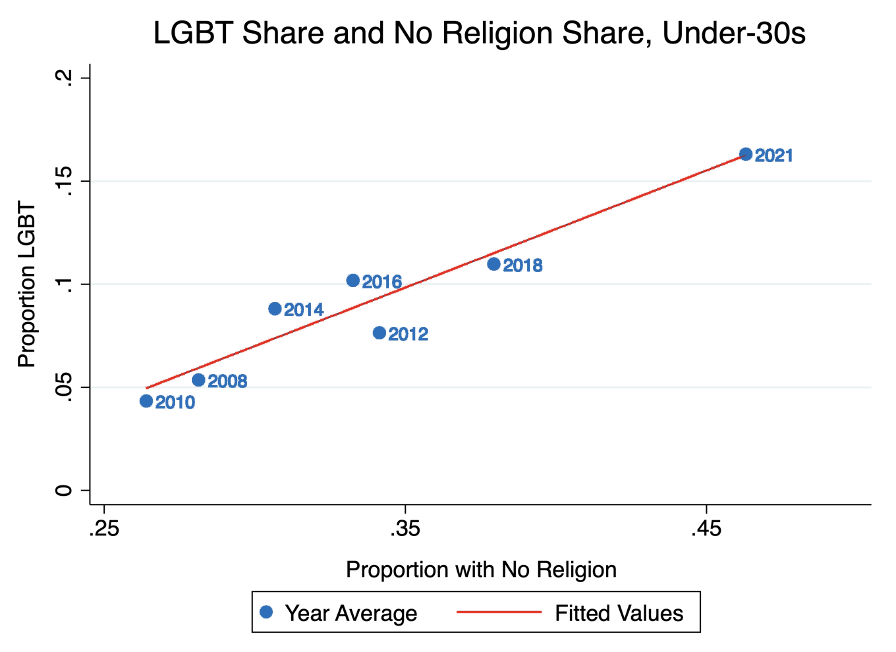
Source: GSS 2008-21. Shows aggregated figures for each year.
The Mental Health-Sexuality-Liberalism Nexus
In a recent essay in The Atlantic, Derek Thompson remarked on the recent surge in mental health problems among American teens.25 The centerpiece of the article was Figure 19 below, which uses Center for Disease Control (CDC) data to show a marked rise in emotional problems among youth since 2015. The highest levels are among LGBT respondents, with 76 percent of them reporting feeling persistently sad or hopeless in 2021. Women also experienced a larger jump in emotional distress than men during the pandemic.
The staggering rate of mental health problems among LGBT identifiers in the chart was not addressed by Thompson, who focused on trends affecting all groups over time. But there is evidence that non-heterosexuals have been hit hardest by the post-2010 crisis of youth mental health. While the CDC only breaks out the figures from 2015, a major study of nearly 40,000 teens in Wisconsin shows that LGBT mental health deteriorated significantly faster than heterosexual mental health between 2012 and 2018. Between these years, the share of heterosexual young people reporting anxiety the previous month rose from 32 percent in 2012 to 35 percent in 2015 to 41 percent in 2018. However, among young gay and bisexual teens it soared from about 55 percent in 2012 to 65 percent in 2015 to 72 percent in 2018.26 All this during a time of rising toleration of LGBT lifestyles.
Figure 19.
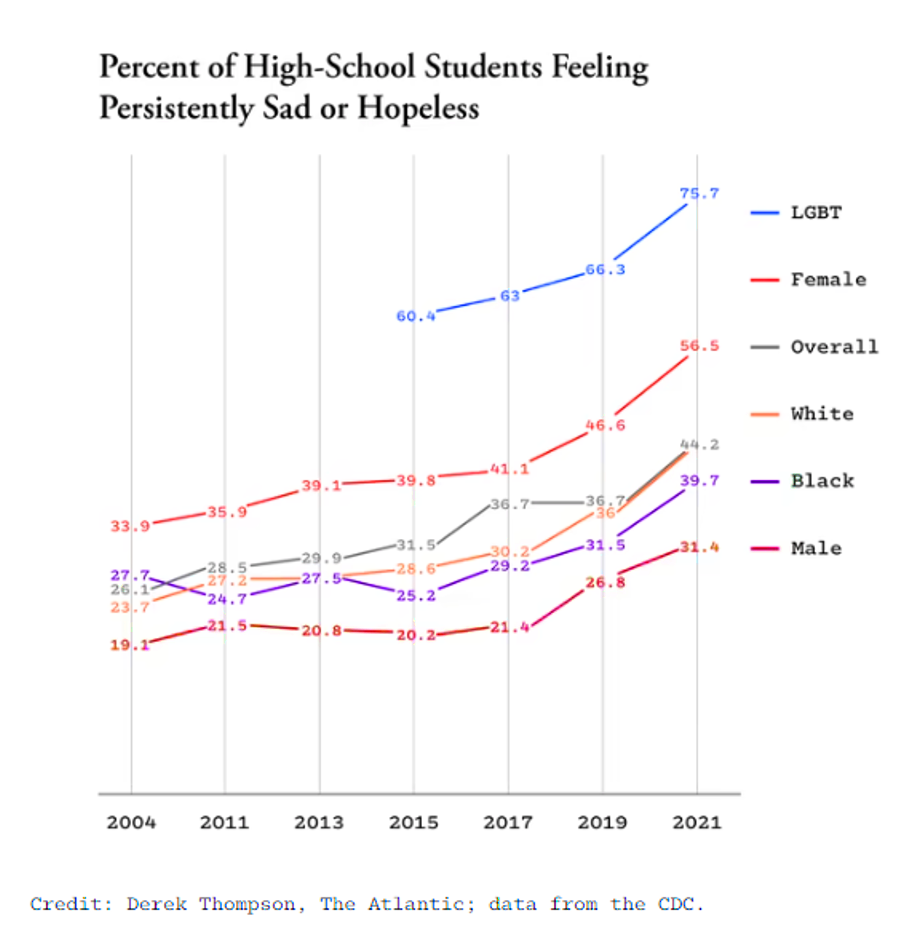
Source: Thompson 2022.
The GSS has asked whether people in its survey are happy since 2010. Respondents can answer ‘very happy,’ ‘pretty happy,’ or ‘not too happy.’ Figure 20 plots the trends in the GSS since 2010. These broadly confirm those from Thompson for the post-2015 period. Though the sample size is small, there is some indication that the sexuality gap in youth happiness widened from 2010 to 2018, even while the pandemic hit both groups hard in 2021. This is also visible in data aggregating across all age groups. LGBT identity seems to be acting as a multiplier for the forces boosting mental illness.
Figure 20.
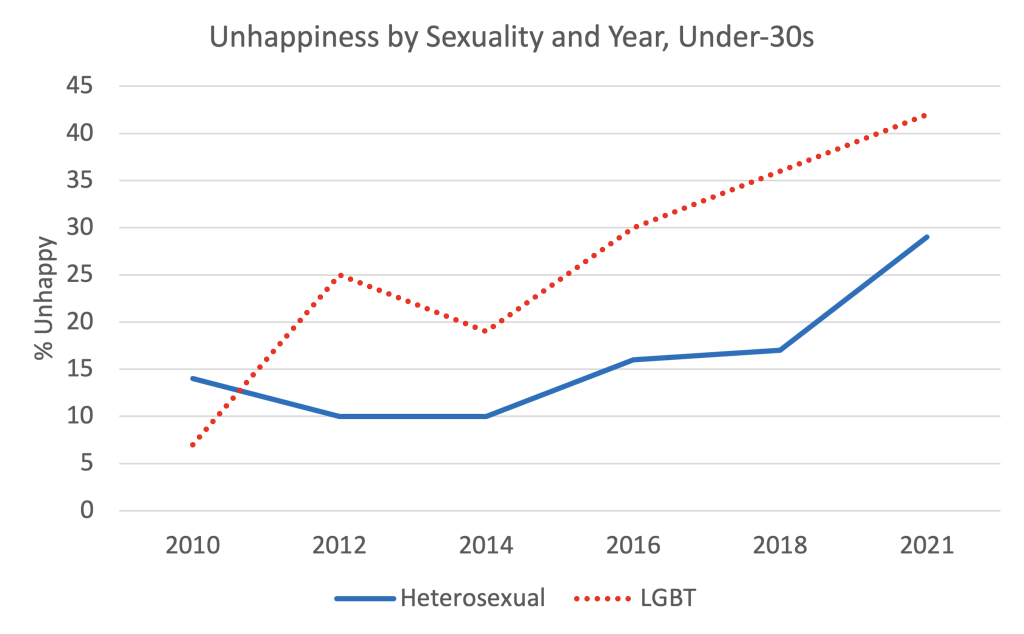
Source: GSS 2010-21. LGBT N is 15 in 2010, rising to 38 in 2021. Heterosexual N is 194-331 so interpret single years with caution.
Very liberal and LGBT people are more anxious and depressed than others across multiple surveys. The GSS introduced a question in 2018 asking how often a person had felt anxious, depressed, or irritable in the previous seven days. I have also previously conducted two Qualtrics surveys during 2020, evenly balanced between white and black for a combined sample of 1,770 individuals. Here I asked, “How often would you say you are sad or anxious?” Those who answered ‘Most of the time’ or ‘Always’ were classified as anxious or depressed. The Qualtrics data only contains data for those aged 25-29, with no figures for the under 25s.
Figure 21 compares depression and anxiety levels across the two different datasets, with their alternative question wording and differing samples. Despite the differences, the broad pattern is similar. Very liberal and non-heterosexual respondents are considerably more likely to be anxious or depressed. In both the GSS and Qualtrics, very liberal young people are 12 points more likely than somewhat liberal young people to have mental health problems. LGBT respondents are 32 points more likely than heterosexuals to have emotional problems in the GSS and 20 points more likely in Qualtrics.
Figure 21.
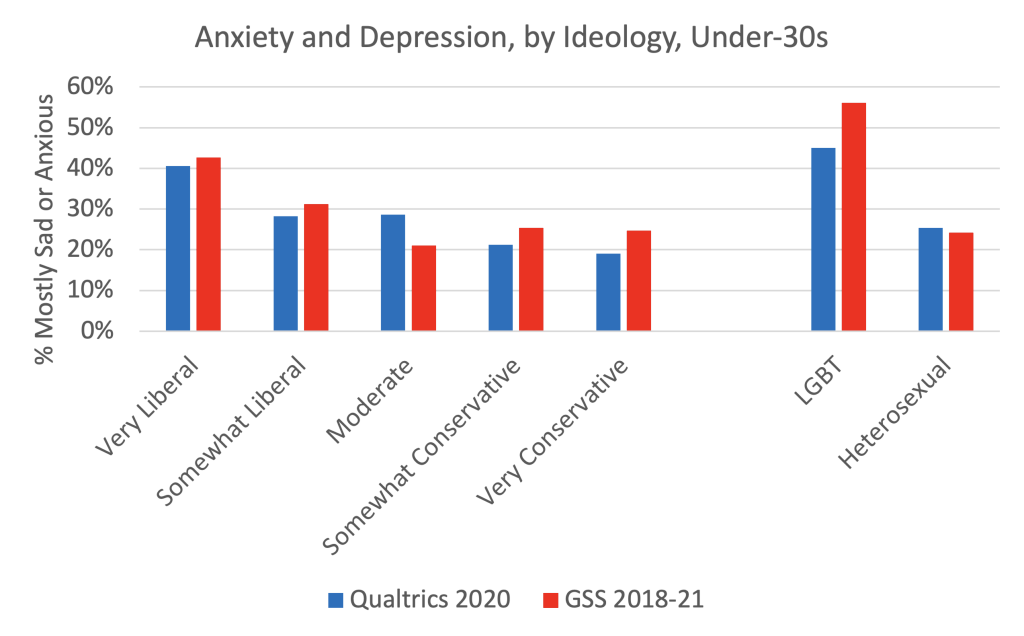
Source: Qualtrics 2020, GSS 2018, 2021. Under 30 respondents only. Qualtrics: LGBT N is 40, heterosexual is 221. GSS: LGBT N is 66, heterosexual is 422.
Is there a connection between ideology and sexuality here, in line with other findings in this report? CSPI Fellow Zach Goldberg, using 2020 Pew data, showed that very liberal whites were far more likely than others to say they had been diagnosed with a mental health condition. Very liberal whites had a 46 percent chance of answering that question in the affirmative compared to 33 percent of somewhat liberal whites, 29 percent of moderates, and around 20 percent of conservative whites.27 We also know that very liberal Americans are substantially more likely to identify as LGBT than slight liberals, moderates, or conservatives. And in the datasets here, ideology predicts mental health problems even when controlling for sexual orientation, race, gender, and other demographic characteristics.
Examining relationships between questions on sexual orientation, ideology, and anxiety/depression shows a powerful set of correlations. In the GSS, factor analysis reveals that one underlying factor accounts for almost half (49 percent) the variation in answers to these three questions among young people. In Qualtrics, this common factor explains 43 percent of the variation in the three variables. The ‘very liberal’ portion of the ideological spectrum stands out as being both considerably more LGBT and unusually prone to mental health problems. However, just as liberalism has not risen among youth at anywhere near the rate of LGBT increase, so too I find that the aggregate level of anxiety and depression rose more slowly than LGBT share prior to the pandemic. Between 2010 and 2014, 11-13 percent of all young people had mental health problems. In 2016 and 2018 this stood at 16 percent. Only during the pandemic in 2021 was there a surge to 30 percent of all youth.
It therefore appears that the rise in LGBT young people did not cause a rise in mental health issues but, as with liberalism, the LGBT share disproportionately expanded within a subset of the young population – in this case those with anxiety and depression. Here we see another example of the multiplier effect mentioned earlier, in which wider forces disproportionately affect subgroups with particular psychological predispositions. Thus in 2010 and 2012, only 7 percent of unhappy young people were LGBT while 4 percent of very happy people were LGBT. However, by 2018-21, 21 percent of all unhappy young people and 27 percent of those with anxiety or depression identified as LGBT. By contrast, just 9 percent of very happy young people and 7 percent of those who rarely feel anxious or depressed were LGBT during 2018-21. In the context of limited increases in total youth unhappiness prior to the pandemic, this indicates that the LGBT rise has been disproportionately concentrated within the overlapping ‘very liberal’ and anxious/depressed part of the young population.
It is possible that the groups which report worse mental health – such as young LGBT and very liberal people – have disproportionately shaped, and been shaped by, a new left-modernist culture. This zeitgeist values transgressing social boundaries while valorizing vulnerability and victimhood. Figure 22 shows that in the years 2010 and 2012 (combined for reasons of sample size), when it comes to the number of days in the past month a person said their “mental health was not good…which includes stress, depression, and problems with emotions,” there were few differences between very liberal young people and those who were slightly liberal, moderate, or conservative. LGBT and heterosexuals also reported similar levels of poor mental health. For the pre-pandemic years 2014, 2016, and 2018 (combined), the picture changes dramatically, with very liberal and LGBT young people now reporting worse mental health while others reported similar levels as in 2010-12. Given that prejudice against LGBT individuals was decreasing during that time period, something else was going on through the 2010s to increase the association between despair and identifying as something other than heterosexual.
Figure 22.
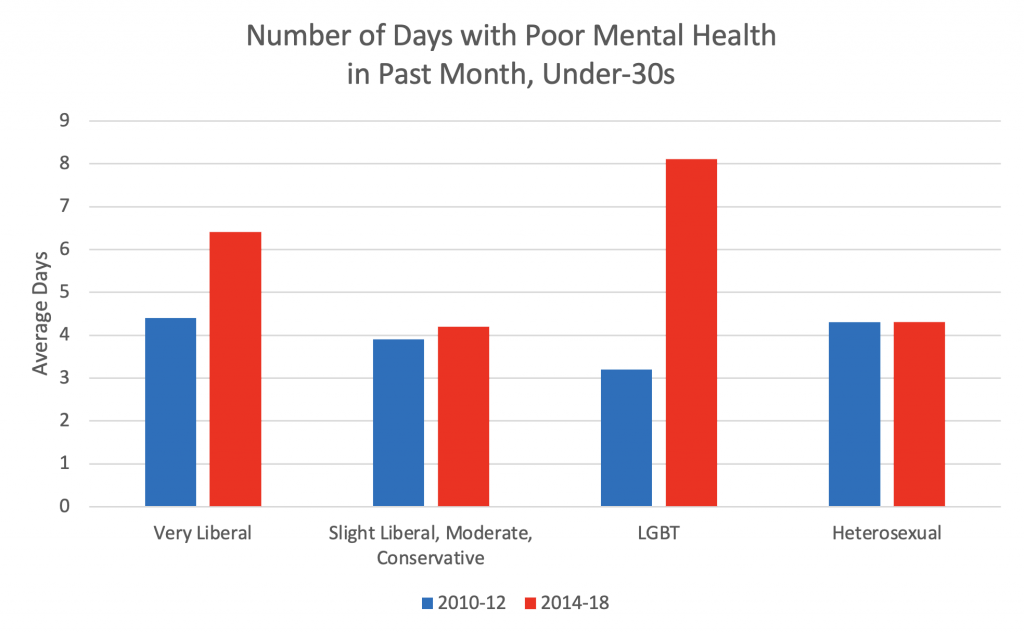
Source: GSS 2010-2018. N=16 LGBT for 2010-12, 50 for 2014-18. N=91 very liberal for 2010-12, 121 for 2014-18. Very liberal is significant at p<.05. No significant effect for LGBT by year.
The data for a somewhat different question on whether someone is ‘not too happy,’ as opposed to ‘pretty’ or ‘very’ happy, show a somewhat similar pattern in which very liberal and LGBT young people have experienced a faster decline in happiness than others since 2014. This is a period in which a social media-fueled culture of fragility arguably expanded, a phenomenon which parallels the Great Awokening among liberal white Americans – evident in media and campus activism – yet extends beyond it.
Figure 23.
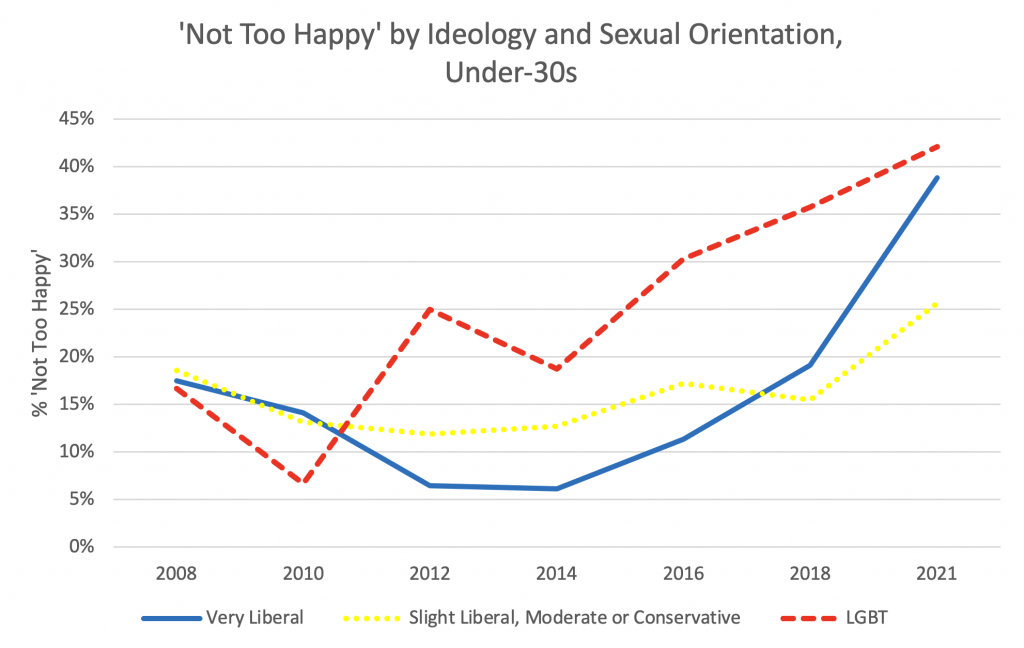
Source: GSS 2008-2021.
In the GSS data, social media use significantly predicts strong liberalism and LGBT identification, as well as unhappiness, anxiety, and depression. Yet social media consumption only explains a modest portion of the ideology-sexuality-mental health nexus.28 The underlying common driver likely involves psychological traits such as high openness to experience, which increases receptivity to a new culture of boundary-transgressing modernism.
Does School Play a Role?
The politics of schools has become more prominent of late, with parents increasingly concerned that far-left ideas about race, gender, and sexuality are being taught to their children. Some schools openly challenge conventional understandings of these topics, such as the Nova School in Seattle, which has 80 percent LGBT students and describes its pedagogical approach as “decentering whiteness, patriarchy, [and] hetero- and cis-normativity.”29 On March 28, Florida Governor Ron DeSantis signed the Parental Rights in Education Bill, which prohibits discussion of gender identity and sexuality in K-3 classrooms.30 The discussion surrounding this bill and similar controversies raises the question: do schools play a role in the rise of LGBT identification and behavior? If they do, does the type of high school or university someone attends affect their propensity to identify as LGBT?
The answer to the second question, as Figure 24 illustrates, is that whether a college student attended a public, private, or parochial school, or is homeschooled, appears to make little difference to their propensity to identify as LGBT. It may be that top colleges disproportionately attract LGBT students from parochial or homeschooled students, but this would assume that non-LGBT students select away from top colleges in large numbers. It is also worth remarking that the LGBT share is no higher among college students than non-students in the CCES. Of equal note is that the LGBT share is similar among various categories of college, from the more elite Ivy League to the less prestigious R2 colleges. The major exception is Liberal Arts Colleges, where 38 percent of students identify as LGBT, a significantly higher share than among the rest, a finding that holds even with controls for gender, race, and ideology.
Figure 24.
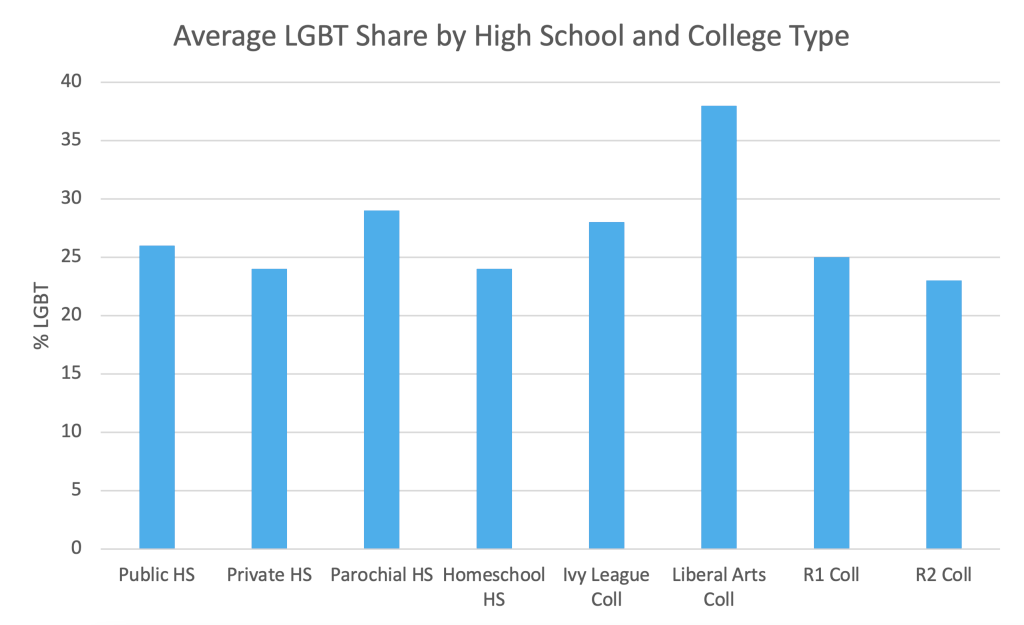
Source: FIRE 2020, 2021. High School Ns (asked only on subsample): Public=7,933, Private=1,932, Parochial=106, Homeschool=131. For College: Ivy=4,515, Liberal Arts=4,078, R1=27,652, R2=4,140.
Attending a college with a high LGBT share, controlling for other predictors, does mean it is more likely a student will be LGBT. The effect is as strong as gender, suggesting that LGBT-rich contexts may be playing a small role in increasing the likelihood of identifying as non-heterosexual. However, this could also be the result of personal characteristics not captured in the FIRE surveys that induce LGBT people to cluster toward certain colleges, rather than because of the impact of social context on identity choice. It is also worth mentioning that the FIRE data show only limited clustering of LGBT students in particular colleges, with considerably lower segregation than for race or religion. More broadly, GSS and CCES data show no difference between rural areas and cities in the chance of a young person identifying as LGBT once demographics and ideology are held constant. This suggests that local social context may have only a limited effect on a person’s sexual identity.
It would be incorrect to interpret the data as suggesting that the education system has played no role in the rise of LGBT. Though there is little difference between various kinds of schools in the extent to which their student bodies identify as LGBT, it could still be the case that there is a common pro-LGBT influence across all educational institutions, with the homeschooled sample skewed by LGBT-identifying homeschooled respondents who disproportionately select into top universities. The same could be happening with parochial schools. If this is the case, it would not appear in this data. Moreover, as can be seen in Figure 24, the samples for individuals who as high schoolers who were homeschooled or in parochial schools are quite small. The results for those categories should therefore be interpreted with caution.
Has Gender Nonconformity Peaked?
Most of this discussion has focused on the rise in bisexuality and, to a lesser extent, homosexuality. But what about gender nonconformity? Coverage of trans issues has surged since 2014, focusing particularly on young girls’ use of puberty blockers and surgery to transition to become boys, and on older men who identify as female, raising questions such as who should have access to women’s spaces and sports competitions. Between 2010 and 2020, the US recorded a 1,000 percent jump in the share of teenagers identifying as trans.31 In 2020, the CCES asked, “Have you ever undergone any part of a process (including any thought or action) to change your gender / perceived gender from the one you were assigned at birth? This may include steps such as changing the type of clothes you wear, name you are known by, or undergoing surgery.” 2.4 percent of over 60,000 respondents said they were transgender, with a further 2.8 percent replying ‘prefer not to say.’ Among the under-30s, 5.8 percent identified as transgender.
CCES is not a nationally representative sample, even with data weights applied. The figure of 5.8 percent is far higher than the 2.1 percent transgender recorded by Gallup for those aged 18 to 25.32 It is also considerably larger than the 0.85 percent trans and nonbinary share recorded for the 20-24 population (0.3 percent overall) by the 2021 Canadian census, which provides perhaps the best approximation to the actual US number.33 In terms of sex, 61 percent of trans identifiers under age 30 in the CCES responded that they were male and 39 percent female. For the 18-24s, the ratio is 64-36. This changes to 54-46 for the 25-29 group. This dovetails with the Canadian census data showing a preponderance of trans men over trans women in the 15 to 24 age group, reaching parity in the 25-29 group.
The FIRE figures are interesting because they cover two years, with a sample of nearly 20,000 students in 2020 and over 13,000 students from the same schools in 2021, as well as a further 24,000 students from other schools in that year. When asking respondents their gender, FIRE has the choices of male, female, and non-binary. It has no transgender option. Given the overlap between trans and non-binary identity, we may take the non-binary number in the FIRE data as indicative of gender nonconformity. The FIRE survey reports that 1.5 percent of American undergraduates from the leading 50 universities identified as non-binary in 2020. This declined to 0.85 percent in 2021. The wider sample of 150 schools in 2021 shows a slightly higher non-binary share of 0.95 percent, but this is still well below the 1.5 percent recorded in 2020. Figure 25 below charts this decline. Moreover, in 2021, freshman and sophomore students were less likely to report being non-binary than older students. Younger age and the more recent survey year of 2021 are both significantly associated with lower gender nonconformity. This suggests that non-binary identity, and perhaps transgenderism, have peaked and are declining.
This conclusion triangulates with two international datasets. First, there is the Canadian census, which shows that the share of trans and non-binary people is lowest among the elderly, rises to a peak of 0.85 percent among the 20 to 24 population, but then declines to 0.73 percent for those aged 15 to 19. Another data source is referrals for transgender surgery at Britain’s leading Tavistock Clinic. These show that referrals rose from 136 in 2010-11 to a peak of around 2,745 in both 2018-19 and 2019-20, subsequently dropping to 2,383 in 2020-21.34 The FIRE results are consistent with this pattern of a 2020 peak followed by a substantial decline, with younger people less likely to identify as gender nonconforming.
Figure 25.
Source: FIRE 2020-2021. N=19,969 for 2020; 13,186 for 2021.
The decline of non-binary identification among students is all the more interesting because it took place at the same time as a substantial rise in gay, lesbian, bisexual, and other non-traditional sexual identifications, which increased from 18.6 percent in 2020 to 24.5 percent in 2021 in the same dataset. Same-sex attraction and gender identity are ostensibly distinct, yet there is an important relationship. The data suggest that a considerable number of people who indicate that they are non-binary also identify as gay, lesbian, bisexual, pansexual, or queer (LGBQ). What seems to have occurred is a shift of many from non-binary-plus-LGBQ identification to LGBQ-only identification between 2020 and 2021. FIRE data in Figure 26 shows that nearly 4 in 10 non-binary students identified as either gay, lesbian, or bisexual. Only 11 percent ticked the ‘other’ sexuality box and just 14 percent identified as heterosexual.35 Between 2020 and 2021, the number of non-binary individuals declined within both the heterosexual and LGBQ groups, with two-thirds of the loss occurring within the latter.
Figure 26.
Source: FIRE 2020 and 2021. N=634 non-binary individuals out of 56,774.
Gender nonconformity is associated with identifying as non-heterosexual, being younger, and not being religious. The three parameters are of approximately equal predictive power. In the CCES, being liberal – especially very liberal – predicts trans identification even after controlling for sexual orientation. In the FIRE data, very liberal ideology strongly predicts non-binary identification, but this effect disappears when accounting for sexual orientation. The FIRE sample shows that 18-19-year-olds are significantly less likely to be non-binary than 21-22-year-olds. Despite some differences, the correlates of gender nonconformity – ideology, religion, age – are broadly similar to those that predict bisexuality and homosexuality.
Political Implications
What are the political implications of the rise in LGBT identification? Figure 27 displays Higher Education Research Institute (HERI) Freshman surveys of a representative sample of some 100,000 students per year across all types of colleges. It shows a substantial rise in the proportion of female students identifying as liberal or far-left (dark blue bars), from 27 percent in 2003 to 42 percent by 2016 (I don’t have access to gender breakdowns for more recent data). Men (light blue bars), by contrast, have remained relatively similar in their degree of liberalism.
Figure 27.
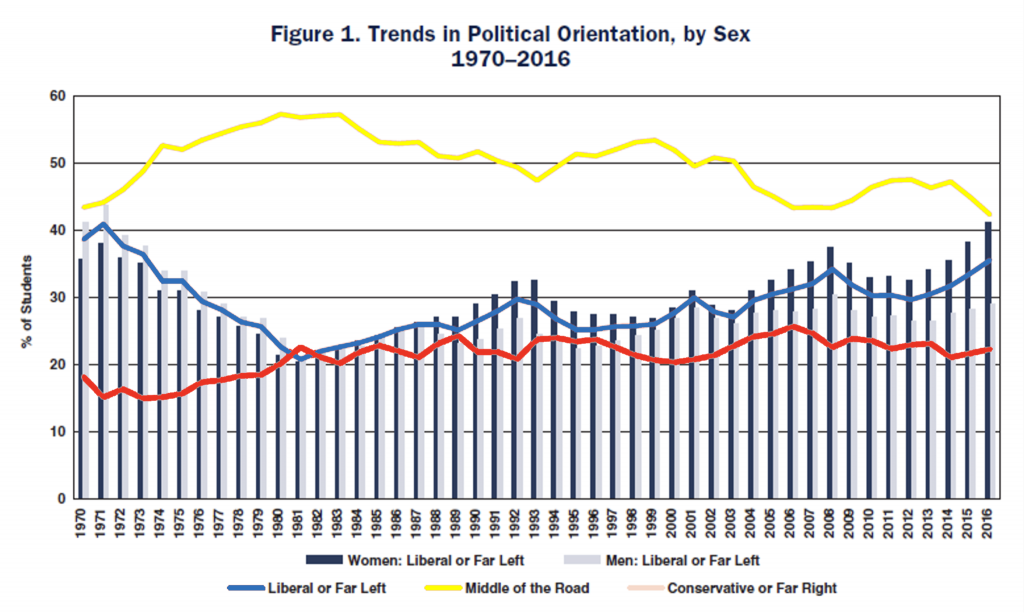
Source: HERI Research Brief, May 2017. For 2016, N=137,456 first-time, full-time freshmen attending 184 colleges, weighted to be representative. Across the entire 1970-2016 series, sample size is over 15 million individuals surveyed.
What accounts for rising liberalism among young women since 2012? GSS data would indicate that religious decline is more closely associated with liberalism than sexual identity is. At an individual level, having no religion, along with a person’s level of religious attendance, explain about 2 to 3 times more of the variation in ideology than sexual orientation does, and this holds for both men and women. However, at the individual level, LGBT identity remains a significant predictor of being liberal, even when controlling for religiosity.
If the rise in LGBT share were only taking place among liberals, there would be no impact on aggregate liberalism among young people. Figure 28 summarizes the data for females for the period where we have comparable indicators. The religiosity-liberalism relationship at the aggregate level is tighter than that between LGBT share and liberal share. This indicates that the rise in LGBT identification over time is relatively independent of liberalism and has largely taken place within the liberal population, rather than the rise in bisexuality and homosexuality producing more liberals.
Figure 28.
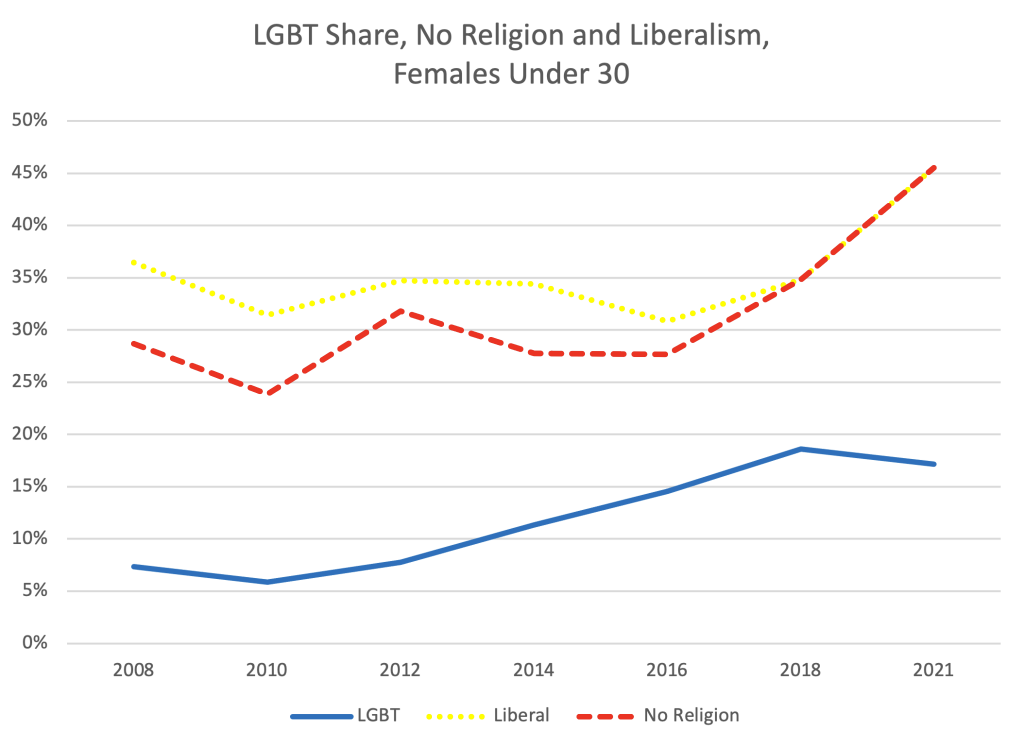
Source: GSS 2008-21. Low sample size so interpret single years with caution.
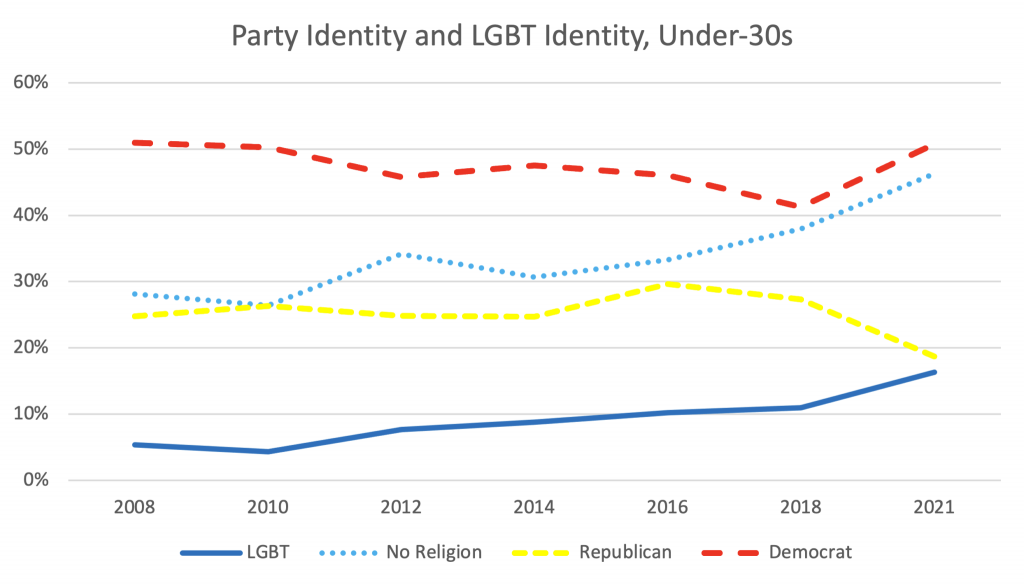
Party identification is heavily associated with ideology. Thus, the rise in liberalism among young people should have translated into an increase in support for the Democrats and a decline in support for the Republicans. However, an alternative possibility is that more left-leaning moderates are now calling themselves liberal and more right-leaning moderates are identifying as conservative due to polarization. Indeed, Figure 29 shows that partisanship among young Americans in the GSS has been relatively stable, with young voters gravitating to the Democrats during the Obama years, then somewhat away from them in the Clinton period, then back toward the Democrats after 2018. The American National Election Study shows a similar trend in the period up to 2019. All this during an era in which both homosexual identification and secularism were on the rise.
The surge towards the Democrats in the GSS data between 2018 and 2021 may look significant but should be taken with caution as it is one data point based on a small sample and straddles a change in methodology from in-person to online between 2018 and 2021. Other surveys, such as the Harvard Youth Poll, show a more modest Democrat to Republican advantage among under-30s: 38-23 in 2021, narrowing to 38-25 in 2022.36 In short, there is little evidence that the rise in LGBT identification among young people since 2010 has had much effect on the partisan balance. This suggests that while LGBT identifiers are much more liberal and more Democratic than average, most of the growth in LGBT identity has occurred among young people who were already liberal and has not translated into significant switching toward the Democrats.
In addition, this provides further evidence for the proposition that a common psychological substrate influences ideology and sexual identity, rather than LGBT identity serving as an independent force that inclines people toward liberalism.
Figure 29.
Source: GSS 2008-21. Low sample size so interpret single years with caution.
Conclusion
This report considers the remarkable phenomenon of the tripling of LGBT identification among young Americans between 2012 and 2021. I hypothesize that a more sexually liberal and modernist culture, one which values difference, best accounts for the new trend. This culture has its greatest impact on the most sexually fluid and perhaps easily influenced groups: the young, the very liberal, and women. Bisexuality, especially among women, accounts for nearly half the LGBT total among young people. While government data from the UK and Canada indicate that the rise in LGBT identity might be significantly exaggerated in other surveys, the underlying trend is certainly real.
Much of the rise in LGBT identification has occurred among those in the most liberal fifth of the political spectrum. While there appears to be some rise in LGBT sexual behavior, at least two-thirds of the increase in LGBT identity is among those whose sexual behavior is heterosexual. The one category that displays a different dynamic is gender nonconformity. Like gays, lesbians, and bisexuals, trans and non-binary individuals are more likely to be young and very liberal. However, while other LGBT categories continue their rise among younger age groups and have arguably yet to reach their zenith, gender nonconformity shows a peak in 2020 followed by a decline in 2021. It is highest among those aged 20 to 24 and less popular among those 19 and under.
Strong political beliefs, such as hostility to the police and offensive speakers, are an important predictor of LGBT identity among white college-educated Americans but are less likely to explain the relatively high LGBT share among minorities and those with only a high school education. The Great Awokening probably cannot account for the modest rise in LGBT identification among older age groups and conservatives. It is a broader phenomenon. While LGBT identifiers lean heavily liberal and relatively Democratic, the sharp increase in their share among those under 30 has not translated into higher Democratic party identification. When considered alongside other evidence in this report, this indicates that the rise in non-heterosexual identity largely unfolded within the liberal Democratic bloc, blunting its impact on the wider partisan balance.
References
1 Douthat, Ross. 2022. “How to Make Sense of the New L.G.B.T.Q. Culture War.” The New York Times. Available at https://www.nytimes.com/2022/04/13/opinion/transgender-culture-war.html.
2 “Governor Ron DeSantis Signs Historic Bill to Protect Parental Rights in Education.” 2022. flgov.com. Available at https://www.flgov.com/2022/03/28/governor-ron-desantis-signs-historic-bill-to-protect-parental-rights-in- education/.
3 “Governor Ron DeSantis Signs Historic Bill to Protect Parental Rights in Education.” 2022. flgov.com. Available at https://www.flgov.com/2022/03/28/governor-ron-desantis-signs-historic-bill-to-protect-parental-rights-in- education/.
4 Bridges, Tristan and Mignon R. Moore. 2019. “23 percent of Young Black Women Now Identify as Bisexual.” The Conversation. Available at https://theconversation.com/23-of-young-black-women-now-identify-as-bisexual- 116116.
5 Zietsch, Brendan. 2019. “‘Gay Gene’ Search Reveals Not One but Many – and No Way to Predict Sexuality.” The Conversation. Available at https://theconversation.com/gay-gene-search-reveals-not-one-but-many-and-no-way-to- predict-sexuality-122459.
6 Bailey, J. Michael., Paul L. Vasey, Lisa M. Diamond, S. Marc Breedlove, Eric Vilain and Marc Epprecht. 2016. “Sexual Orientation, Controversy, and Science.” Psychological Science in the Public Interest 17(2): 45-101.
7 Turner, Jonathan H. and Jan E. Stets. 2005. “The Sociology of Emotions.” Cambridge University Press.
8 Source: “YouGov Profiles May 15, 2022.” 2022. YouGov. Available for purchase at https://yougov.co.uk.
9 “Sexual Orientation, UK: 2019.” 2021. Office for National Statistics. Available at https://www.ons.gov.uk/peoplepopulationandcommunity/culturalidentity/sexuality/bulletins/sexualidentityuk/2019.
10 Jones, Jeffrey M. 2022. “LGBT Identification in U.S. Ticks Up to 7.1 percent.” Gallup. Available at https://news.gallup.com/poll/389792/lgbt-identification-ticks-up.aspx.
11 I don’t have access to Gallup raw data, so I cannot subdivide the bisexual numbers by male and female.
12 By 2021, around 20 percent of young people had no sexual partners in the previous 12 months. This group is a few points less LGBT than other young people.
13 2018 was also the first year in which the GSS distinguished between sex assigned at birth and self-identified gender. This gesture towards “inclusiveness” could potentially have made LGBT respondents feel more comfortable disclosing non-heterosexual behavior, although this is speculative.
14 Jost, John T. 2006. “The End of the End of Ideology.” American Psychologist 61(7): 651; Haidt, Jonathan. 2012. “The Righteous Mind: Why Good People are Divided by Politics and Religion.” Vintage; Federico, Christopher and Ariel Malka. 2021. “Ideology: The Psychological and Social Foundations of Belief Systems.” Psyarxiv preprint. Available at https://psyarxiv.com/xhvyj.
15 Bridges and Moore 2019.
16 Philpot, Tasha. S. 2017. “Conservative but Not Republican.” Cambridge University Press.
17 See McGreal, Scott A. 2021. “Personality Traits, Mental Illness, and Ideology.” Psychology Today. Available at https://www.psychologytoday.com/gb/blog/unique-everybody-else/202103/personality-traits-mental-illness-and- ideology.
18 “5. Homosexuality, Gender and Religion.” 2017. Pew Research Center. Available at https://www.pewresearch.org/politics/2017/10/05/5-homosexuality-gender-and-religion/.
19 Yglesias, Matthew. 2019. “Great Awokening.” Vox. Available at https://www.vox.com/2019/3/22/18259865/great-awokening-white-liberals-race-polling-trump-2020.
20 Philpot 2017.
21 9 percent of black women and 7 percent of black men replied ‘prefer not to say’ to the sexuality question. Based on weighted data.
22 Box-Steffensmeier, Janet M. and Suzanna De Boef. 2001. “Macropartisanship and Macroideology in the Sophisticated Electorate.” The Journal of Politics 63(1): 232-248.
23 Shimron, Yonat. 2020. “Is the Rise of the Nones Slowing? Scholars Say Maybe.” Religion News Service. Available at https://religionnews.com/2020/02/11/is-the-decline-in-religious-affiliation-slowing-some-scholars-say- maybe/.
24 See “Sexual Orientation, UK: 2019.” 2021.
25 Thompson, Derek. 2022. “Why American Teens Are So Sad.” The Atlantic. Available at https://www.theatlantic.com/newsletters/archive/2022/04/american-teens-sadness-depression-anxiety/629524/.
26 Parodi, Katharine B., Melissa K. Holt, Jennifer Greif Green, Michelle V. Porche, Brian Koenig and Ziming Xuan. 2022. “Time Trends and Disparities in Anxiety Among Adolescents, 2012–2018.” Social Psychiatry and Psychiatric Epidemiology 57(1): 127-137.
27 Styles, Andrew. 2021. “SCIENCE: White Libs More Likely to Have Mental Health Problems.” Washington Free Beacon. Available at https://freebeacon.com/politics/white-libs-mental-health/.
28 Social media use predicts 7 percent of the variation in a factor comprised of these three GSS variables. While the most important predictor, this is still a small part of the variation.
29 Rufo, Christopher [@realchrisrufo]. 2022. Nova High School in Seattle describes [Tweet]. Twitter. Available at https://twitter.com/realchrisrufo/status/1526321366521237504. For the original source of the 80 percent LGBT figure, see “Planning and Visioning School-Based Health at Nova High School.” 2019. Cardea. Available at https://cardeaservices.org/resource/planning-school-based-health-at-nova-high-school/.
30 “Governor Ron DeSantis Signs Historic Bill to Protect Parental Rights in Education.” 2022.
31 Shrier 2020; Stock, Kathleen. 2021. “Material Girls: Why Reality Matters for Feminism.” Hachette UK.
32 Jones 2022.
33 Hayton, Debbie. 2022. “Canada Census Reveals How Many People are Trans.” UnHerd. Available at https://unherd.com/thepost/canada-census-reveals-how-many-people-are-trans/.
34 “Referrals to GIDS, Financial Years 2010-11 to 2020-21.” 2021. Gender Identity Development Service. Available at https://gids.nhs.uk/professionals/number-of-referrals/.
35 It is worth noting that in the CCES, the gay, lesbian, and bisexual share among trans identifiers is similar, but nearly half of those who said they were trans identified as heterosexual.
36 “Harvard Youth Poll: 42nd Edition | Fall 2021. Top Trends and Takeaways.” 2021. Harvard Kennedy School of Politics. Available at https://iop.harvard.edu/youth-poll/fall-2021-harvard-youth-poll; “Harvard Youth Poll: 43rd Edition | Spring 2022. Top Trends and Takeaways.” 2021. Harvard Kennedy School of Politics. Available at https://iop.harvard.edu/youth-poll/spring-2022-harvard-youth-poll.
…
*Rebublished with kind permission by the author from: Kaufmann E. (2022). Born This Way? The Rise of LGBT as a Social and Political Identity. CSPI Report No. 6. CSPI. URL: https://cspicenter.org/reports/born-this-way-the-rise-of-lgbt-as-a-social-and-political-identity/