_ Marcel de Graaff, MEP, European Parliament (Party for Freedom, ID). Brussels, 10 June 2022.*
“It is one thing to have free immigration into the labour market. It’s another thing to have free immigration to the welfare state. And you can’t have both. If you have a welfare state, if you have a state where every resident is promised a certain minimum income or subsistence level, whether they work or not, whether they produce anything or not. Then it really is an impossibility.”
_ Milton Friedmann. Chicago, 1977. [1]
The European Union is an active promoter of immigration, not only from people within the EU but also from outside the EU. According to Swedish Social Democrat politician Ylva Johansson, the current EU Home Affairs Commissioner in charge of migration policy, immigration is not only a positive phenomenon but also a necessity to keep social security affordable in an aging Europe.[2]
However, this claim is not supported by any facts. Academic research in the Netherlands clearly shows that immigration has a negative impact on the host country and, moreover, does not help to tackle the problems of an aging population.
Calculating the costs and benefits of immigration is as much a political taboo in the Netherlands as it is in surrounding countries. Few researchers want to burn their fingers.[3]
Nevertheless, three academic studies on the impact of immigration on public finances and social security in the Netherlands have been published in the last two decades. The scientists were able to rely on the extremely detailed data from the Dutch statistical office (Nederlandse Centraal Bureau voor de Statistiek – CBS).
The CBS is one of the world’s best and most comprehensive collectors of statistical data. The European Union also concedes this: The CBS “is recognized as one of the leading National Statistical Institutes (NSI) not only in the European Union but worldwide” (The CBS is not only in the European Union, but worldwide as one of the leading recognized by national statistical institutes).[4]
The CBS microdata is very detailed and anonymized data from all 17.5 million Dutch residents. The government collects the data for its own use only, but reputable research institutes can be granted permission to use the microdata collected by the CBS for scientific research purposes. This permission is very rarely granted by the authorities to keep “undesirable” and “controversial knowledge” from the public.[5]
In the three studies carried out by the Dutch Government’s Central Planning Office (CPB) in 2003, by the independent research institute Nyenrode Forum for Economic Research (NYFER) in 2010 and by the Amsterdam School of Economics, part of the University of Amsterdam (UvA), im Published in 2021, the costs and benefits of immigrants throughout their lives, from birth or immigration to the time of emigration or death, were calculated based on the CBS data.
The results of the three studies show that the financial cost of immigration is enormous and will threaten the established social security system in the near future. As the demographic and socio-economic situation in the Netherlands does not differ significantly from that in neighbouring countries, the results of the three Dutch academic studies on the impact of immigration undoubtedly also apply to these neighbouring countries.
CPB study [6]
The Central Planning Office (Centraal Planbureau – CPB) calculated in 2003 the net contribution of migration. The CPB concluded that 1. immigration is a negative factor for the Netherlands, 2. the average non-western immigrant does not contribute to the prosperity of the Netherlands, and 3. immigration increases as the Dutch population ages costs not compensated.
The CPB calculated the net lifetime cost of an average non-Western immigrant entering the Netherlands at the age of 25 to be 43,000 euros (in 2001 prices). An immigrant who comes to the country at the age of zero costs more than twice as much: just under 100,000 euros.
In 2003, the CPB estimated the annual influx of non-Western immigrants at 0.05 percent of the population (about 8,000 people). According to the CPB, this cost the Dutch tax authorities 0.34 Percent of GDP.
Although the CPB is part of the Dutch Ministry of Economic Affairs, which advises the government on economic issues, the CPB report did not lead to a change in Dutch immigration policy. On the contrary, the situation has deteriorated. In addition, the authorities were not satisfied with the release of the CPB report. When researchers at the University of Amsterdam asked in 2017 to use CBS data to update the CPB study, the request initially met with strong rejection. The researchers at the University of Amsterdam were told that the CPB study should not be viewed as a good example that deserves to be repeated.[7]
NYFER study [8]
In 2009, the Partij voor de Vrijheid (Party for Freedom) (PVV) commissioned the independent research bureau NYFER to also calculate the cost of immigrating non-Western immigrants to the Netherlands.[9]
The NYFER study confirmed the CPB’s basic conclusion that immigration of largely unskilled non-Western immigrants imposes a significant cost on public finances in the Netherlands.
NYFER concluded that a non-Western immigrant entering the Netherlands at the age of 25 costs Dutch society on average 54,800 euros net (in 2008 prices). The difference to the CPB conclusion is small when currency depreciation is taken into account. However, NYFER calculated the net cost of an immigrant entering the Netherlands at the age of zero to be more than 200,000 euros.
The difference to the calculation of the CPB can be explained by the fact that the costs for childcare, extracurricular care and child-related household funds have increased enormously since 2001.
In the meantime, the influx of immigrants had also increased enormously, so that the NYFER had to assume a net inflow three times as high as that of the CPB. Additionally, NYFER was more pessimistic than the CPB about the pace at which the second generation is catching up in the labor market.
NYFER therefore calculated the annual cost of non-Western immigration to the Dutch treasury to be around 1 percent of GDP or 7.2 billion euros (in 2008 prices).
University of Amsterdam study [10]
Commissioned by the Forum voor Democratie (FvD), a team from the University of Amsterdam (UvA) published in March 2021 an updated and more detailed study on the impact of immigration in general (i.e. not just non-Western immigrants) on the Dutch welfare state.[11] One of the UvA -Researcher had previously worked at the CPB and was also involved in the 2003 CPB study in this capacity. The study lasted four years and the authors concluded that the annual cost of immigration increased to 17 billion euros or 2.44 percent of Dutch GDP in the reference year 2016. The total cost of immigration for the period 1995-2019 for the Netherlands was 400 billion euros. [12]
It is particularly interesting that the study by the University of Amsterdam also examined the differences by migration motive and country of origin. The study shows that almost all forms of immigration have a cost for Dutch society, with the exception of migrant workers from neighboring countries such as Belgium, Germany, France, Austria, Switzerland and Scandinavia, the Anglo-Saxon countries and Asian countries such as Israel, Singapore, Taiwan, South Korea and Japan. Only this relatively small group of immigrants makes a positive contribution to the receiving country.
The effects of all other immigrant groups are negative. The same applies to Eastern European labor migrants, which cost an average of 50,000 euros net (in 2016 prices) per immigrant, because they tend to work in low-paying jobs and therefore pay less tax and social security contributions than the average Dutch citizen, while their costs for education, Social security and tax payments are higher.
However, immigration from non-Western countries causes the highest costs. According to the University of Amsterdam study, the net lifetime cost of a non-Western migrant is 300,000 euros per person. In the case of asylum migrants, the number is even more than twice as high. The average asylum seeker from the Middle East or North Africa costs the Netherlands 625,000 euros per immigrant (Chart 1).
Chart 1. Net fiscal contribution of first-generation immigrants (2010 – 2019, by age of entry)
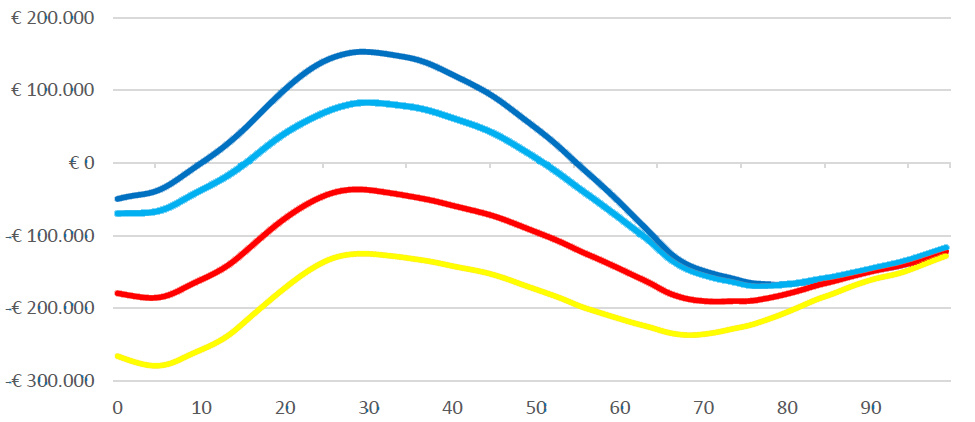
Source: van de Beek J. et al. (2021). | Net fiscal contribution in euros (left axis), age of entry (right axis). Autochthonous Dutch (dark blue), Western immigrants (light blue), Non-Western immigrants (yellow), immigrants total (red).
Labor migration from the traditional immigration countries of the Netherlands is also expensive. The greater the cultural difference to the Netherlands, the more expensive immigration becomes. On average, a migrant from Morocco costs 542,000 euros, a migrant from Turkey 340,000 euros, and a migrant from the former Dutch colony of Suriname 185,000 euros.
The cost of the second generation is, on average, slightly lower than the cost of the first generation, but the contribution remains negative and differs only slightly from that of the first generation. Children from mixed marriages with a Dutch or Western partner perform better.
The study refutes the claim that immigration is necessary to deal with the demographic consequences of an aging population. To keep the percentage of people over 65 in the Netherlands at the 2020 level, the Dutch population would have to increase from 17.5 million today to 75 million people in 2100. In order for this to remain affordable, however, the immigrants would have to come from the western countries mentioned above, which however all have the same aging problems as the Netherlands.
View in the future
The researchers at the University of Amsterdam also looked to the future. They estimated that the cost of immigration will be around 600 billion euros over the period 2020-2040, assuming no policy changes. More than 150,000 immigrants come to the Netherlands every year, 87,000 of whom are of non-Western origin.
In 2003, the CPB estimated the annual influx of non-Western immigrants at around 8,000. As early as 2009, NYFER found that this number had tripled to around 25,000. The UvA researchers were forced to more than triple the value again. Almost a quarter of the Dutch population now has an immigrant background, of which more than half (around 2.5 million people) are non-Western.[13]
The cost of immigration will only increase in the coming years because immigrants have, on average, more children than natives and because the Netherlands’ borders remain wide open to mass immigration. Without migration, the current Dutch population will decrease from 17.5 million to 13 million by 2100. With an immigration rate like in the period 2015-2019, it will be 23-24 million.
It is clear that the Dutch welfare state cannot sustain this growing burden indefinitely. A fundamental shift in policy is needed as the population of Africa and the Middle East grows from 1.6 billion today to 4.7 billion by the end of this century. The authors of the study from the University of Amsterdam rightly refer to the American economist and Nobel Prize winner Milton Friedman, who explained that the choice at stake is between continuing to accept migrants and maintaining the welfare state.
However, the politically correct politicians and the media look the other way. They refuse to draw conclusions from the unequivocal results of objective scientific research on the negative effects of immigration. The native taxpayer who bears the cost of immigration is paying a heavy price – literally and figuratively – a price that is rising every day.
Notes
[1] Friedman M. (1977). What is America? URL: https://www.youtube.com/watch?v=C52TlPCVDio
[2] Steinvorth D. (2021). Man sollte Migration nicht als etwas latent Gefährliches und Toxisches darstellen. NZZ. URL: https://www.nzz.ch/international/ylva-johansson-ueber-die-angst-vor-migration-und-identitaetsverlust-ld.1603359?reduced=true
[3] van de Beek H. (2021). De immigratie kost NL veel geld. Maar de autoriteiten kijken liever weg. Wynia’s Week. URL: https://www.wyniasweek.nl/de-immigratie-kost-nl-veel-geld-maar-de-autoriteitenkijken-liever-weg/
[4] O’Hanlon G. et al. (2015). Peer Review Report on Compliance with the Code of Practice and the Coordination Role of the National Statistical Institute. Eurostat. URL: https://ec.europa.eu/eurostat/documents/64157/4372828/2015-DE-Report/05d4a3fd-8013-4fa5-bd0e-b38c3f54702b
[5] van de Beek H. (2021).
[6] Roodenburg H., Euwals R., ter Rele H. (2003). Immigration and the Dutch Economy. CPB. URL: https://www.cpb.nl/sites/default/files/publicaties/download/immigration-and-dutcheconomy.pdf
[7] van de Beek H. (2021).
[8] van der Geest L. , Dietvorst A.J.F. (2010). Budgettaire effecten van immigratie van nietwesterse allochtonen. NYFER. URL: https://cmr.jur.ru.nl/cmr/docs/nyfer.rapport.2010.pd
[9] The fact that the study was commissioned by the PVV means only that the PVV paid for the study but otherwise had no influence on its content.
[10] van de Beek J. et al. (2021). Grenzeloze Verzorgingsstaat; De Gevolgen van Immigratie voor de Overheidsfinanciën. University of Amsterdam. URL: http://www.demo-demo.nl/files/Grenzeloze_Verzorgingsstaat.pdf
[11] The fact that the study was commissioned by the PVV means only that the PVV paid for the study but otherwise had no influence on its content.
[12] This was higher than the budget deficit of 2.1 percent of GDP in 2015. (In 2016, the Netherlands recorded a budget surplus of 0.4 percent). | Rijkoverheid (2017). Financieel Jaarverslag van het Rijk 2016. URL: https://www.rijksoverheid.nl/binaries/rijksoverheid/documenten/jaarverslagen/2017/05/17/financieel-jaarverslag-rijk-2016/0.-financieel-jaarverslag-van-het-rijk-2016.pdf
[13] On September 1, 2021, 24.9 percent of the Dutch population had an immigrant background: 10.7 percent western and 14.2 percent non-western. 7.9 percent of the Dutch population (1.4 million people) are first-generation non-Western immigrants; 6.3 percent of the population (1.1 million people) are second-generation non-Western immigrants. | cbs (2021). Dossier Asiel, migratie en integratie. URL: https://www.cbs.nl/nl-nl/dossier/dossier-asiel-migratie-en-integratie/
* Republished from the original publication: de Graaff M. (2021). Auswirkung der Einwanderung auf die öffentlichen Finanzen und die soziale Sicherheit in den Niederlanden. In: Der negative Einfluss der außereuropäischen Migration auf die EU-Mitgliedstaaten. ID-Fraktion. URL: https://de.idgroup.eu/der_negative_einfluss_der_migration_auf_die_eu
2 comments