_ Dmitry Erokhin, junior economist, MIWI – Institute for Market Integration and Economic Policy. Vienna, 26 June 2020.
In 2018, China invested USD 19.64 million in Armenia, USD 67.73 million in Belarus, USD 118.35 million in Kazakhstan, USD 100.16 million U.S. in Kyrgyzstan, and USD 725.24 millionin Russia (MOFCOM, 2019).
Chinese foreign direct investment stocks amounted to USD 49.61 million in Armenia, USD 503.78 million in Belarus, USD 7341.08 million in Kazakhstan, USD 1393.08 million in Kyrgyzstan, and USD 14208.22 million in Russia (Ibid).
However, the investment potential is far from being exhausted. The EAEU countries could attract about USD 700 million more FDI from China by improving their institutional quality.
The result is based on the estimation of Chinese FDI gaps in 63 BRI corridor economies in the period 2003-2017.
Methodology
Following Demekas et al. (2007), an FDI gap is defined as the difference between the predicted and potential FDI level.
The predicted FDI level comes from a gravity-type model , where the matrix consists of Chinese OFDI (outward foreign direct investment) determinants varying over time and over countries, is the host country effect, is the time effect, is the error term. First, coefficients of the explanatory variables are determined for the above-mentioned countries and time span. Second, the model is used to predict FDI levels for the last year of observations (to guarantee the same data-generating process for all the countries).
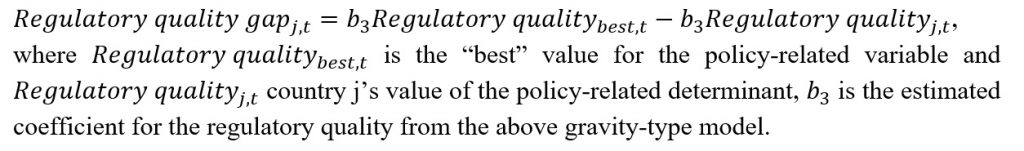
The potential FDI level is determined by the “best” values of the significant policy-related variables. Mean values of the policy-related variables for the region Europe and Central Asia* are used as “best” values for the EAEU countries.
As policy-related variables which can be changed in the short run and thus can be used as a policy recommendation to close the FDI gaps, the World Governance Indicators (WGI) by the World Bank are used. Regulatory quality and control of corruption are found to be significant WGI determinants to influence Chinese OFDI.
The positive impact of regulatory quality on OFDI means that China prefers countries with policies and regulations that support private sector development, which is in line with various empirical papers (e.g. Daude & Stein 2007; Rammal & Zurbruegg 2006). Corruption creates additional costs and makes investment projects less attractive (Al-Sadig 2009), so better control over corruption should contribute to the country’s investment attractiveness. There is an empirical support that Chinese investors prefer countries with low corruption levels (Bhaumik & Co 2011). Other general findings are also in favor of a negative impact of corruption on FDI (e.g. Canare 2017; Habib & Zurawicki 2002).
Further variables that are used for the estimation of the above gravity-type model are GDP, GDP per capita, GDP growth, inflation, import, export, presence of an investment agreement with China, distance, common border with China, whether a country is landlocked, natural resource endowment, port, rail and air infrastructure, ICT infrastructure, BRI dummy, regional dummies. However, these variables are not considered as FDI gap determinants because they are either constant or not changeable via a policy decision in the short run. Moreover, some of them might enter a complicated interaction with the FDI variables in the long run and cause the problem of reverse causality.
In this description, econometric specifications, and robustness checks of the model for accessibility of the article to the general public are omitted.
Forgone Chinese FDI into the EAEU member states
Following the model, a country has a gap if its institutional development is worse than the regional average. Thus, it could improve by catching up with the “best”.
The following table summarizes the gaps in USD million U.S. and as % of the Chinese FDI stocks in the respective countries (as of 2017).
| Country\Gap | Regulatory quality gap | Control of corruption gap | ||
| % | USD million | % | USD million | |
| Armenia | 0 | 0 | 211.72 | 63.43 |
| Belarus | 17.36 | 95.18 | 1.87 | 10.27 |
| Kazakhstan | 0.04 | 3.24 | 1.44 | 109.17 |
| Kyrgyzstan | 4.31 | 56.04 | 11.55 | 150.07 |
| Russia | 0.50 | 68.73 | 0.88 | 121.70 |
Armenia could attract USD 63.43 million or more than double Chinese investments by improving the control of corruption level to the regional mean.
Belarus would receive USD 105.45 million FDI from China or about 20% of its stock by raising regulatory quality and fighting corruption.
Kazakhstan would attract USD 112.41 million or about 1.5% more.
Kyrgyzstan would gain USD 206.11 million or about 16% more foreign direct investments from China.
Russia could increase Chinese investments by USD 190.43 million or about 1.5%.
In total, the EAEU would attract USD 677.83 million more FDI from China by improving its regulatory quality and control of corruption to the mean European and Central Asian level*.
Recap
In the short term, improving institutions (such as fighting corruption and improving regulation) are attractive policies to increase Chinese investment. These policies do not only have a positive impact on investment but also many positive spillover effects on the economy and society.
The estimated gaps are short-term cumulative effects. In the long run, the determinants can enter a complex interaction and raise a question of reverse causality. It may also happen that the targets set by China in a given country are met and Chinese investment are saturated, and therefore decline. However, the improvement of institutions will have a positive long-term impact in other areas, which can compensate for a potential oversaturation.
References
Al-Sadig, A. (2009). The effects of corruption on FDI inflows. Cato J., 29, 267.
Bhaumik, S. K., & Co, C. Y. (2011). Chinese economic cooperation related investment: An investigation of its direction and some implications for outward investment. China Economic Review, 22(1), 75-87.
Canare, T. (2017). The effect of corruption on foreign direct investment inflows: evidence from A panel of Asia-Pacific countries. In The Changing Face of Corruption in the Asia Pacific (pp. 35-55). Elsevier.
Daude, C., & Stein, E. (2007). The quality of institutions and foreign direct investment. Economics & Politics, 19(3), 317-344.
Demekas, D. G., Horváth, B., Ribakova, E., & Wu, Y. (2007). Foreign direct investment in European transition economies—The role of policies. Journal of comparative economics, 35(2), 369-386.
Habib, M., & Zurawicki, L. (2002). Corruption and foreign direct investment. Journal of international business studies, 33(2), 291-307.
Ministry of Commerce (MOFCOM) of the People’s Republic of China, the National Bureau of Statistics and the State Administration of Foreign Exchange. (2019). Statistical Bulletin of China’s Outward Foreign Direct Investment 2018.
Rammal, H. G., & Zurbruegg, R. (2006). The impact of regulatory quality on intra-foreign direct investment flows in the ASEAN markets. International Business Review, 15(4), 401-414.
* European and Central Asian BRI corridor economies (World Bank list): Albania, Armenia, Azerbaijan, Belarus, Bosnia and Herzegovina, Bulgaria, Croatia, Czech Republic, Estonia, Georgia, Greece, Hungary, Kazakhstan, Kyrgyzstan, Latvia, Lithuania, Montenegro, Macedonia, Poland, Romania, Russia, Serbia, Slovakia, Slovenia, Tajikistan, Turkey, Turkmenistan, Ukraine, Uzbekistan. Moldova excluded for data reasons (lack of data on Chinese OFDI).
*Dmitry Erokhin is also a research assistant with the International Institute for Applied Systems Analysis (IIASA) and a master with the Vienna University of Economics and Business.