_ Sebsastian Jensen, Center for the Study of Partisanship and Ideology (CSPI). 30 January 204.
Summary
- All across the world, there is a negative correlation between IQ and fertility.
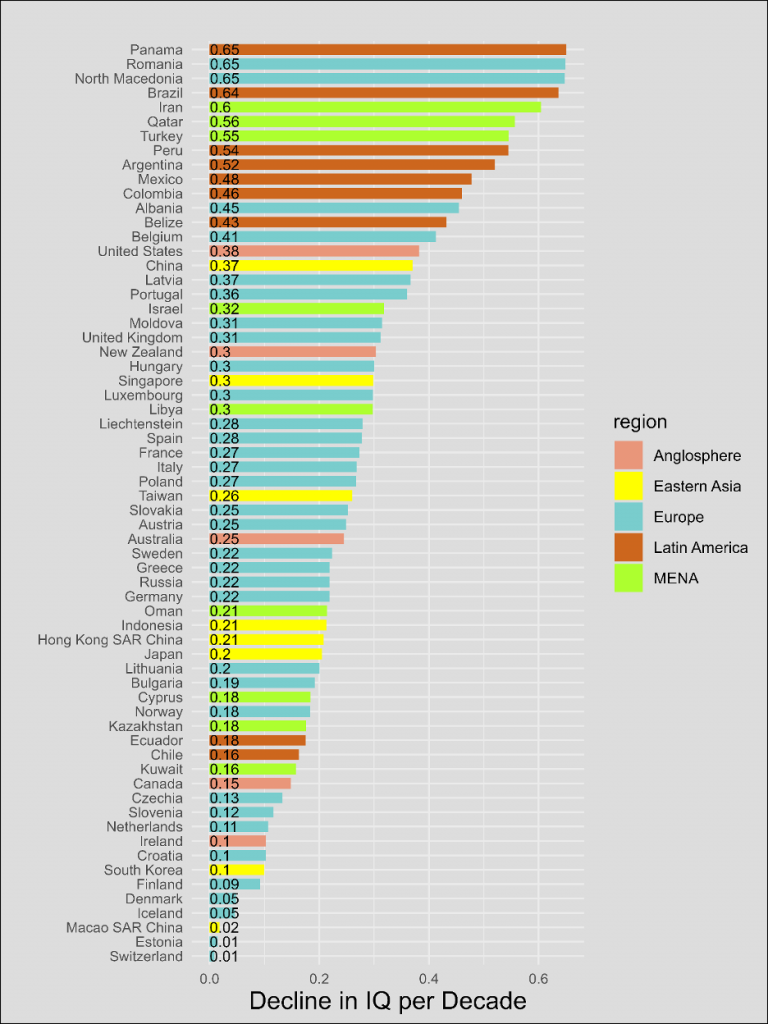
- This means that populations are getting less intelligent as time goes on. Through some basic assumptions, across 62 nations for which we have data, one can estimate a decline in IQ per decade that ranges from as low as 0.01 points in Estonia and Switzerland to as high as 0.65 in Panama, Romania, and North Macedonia.
- In general, more developed countries see a weaker decline in intelligence than less developed nations.
- Selection for lower IQ does not appear to be a major long-term problem in the richest countries today. If at some point even 20% of the population uses embryo selection, it would be more than enough to reverse the current trends that we are seeing.
- There may be more reasons to be concerned about developing countries. The fact that the rate of decline is so fast implies that even if IQ differences between nations are completely environmentally determined today, over the coming decades there may still be a significant divergence between them. That said, the data here may exaggerate the scale of the problem if large family size depresses phenotypic IQ in the developing world.
Introduction
While a work of fiction, it is reasonable to ask whether the dystopia described in the film gets at an issue with real world significance. There is certainly a stereotype that more intelligent people have fewer children, and as we know, stereotypes generally have a basis in fact. Whether this one is true is certainly worth looking into, given how important intelligence is for human flourishing. Moreover, if we are concerned with humanity as a whole, it is important to analyze differential fertility by intelligence not only in United States and other Western countries, but across the world.
Along with some co-authors, I have gathered relevant data on this question from 62 countries. In general, our research shows that humans are likely getting dumber, with the problem being much more pronounced in the developing world. If the data is correct and reflects a decline in genotypic intelligence, it may cause problems for poor states trying to catch up to first world nations, and ultimately threaten their economic health and political stability.
Past Work on IQ and Fertility
Other critics of the differential fertility literature argue that the Flynn effect, the global increase in IQ scores of about 2-3 points per decade,4 is evidence against differential fertility resulting in decreases in intelligence in future generations. However, IQ tests do not measure the same construct across time,5 and a portion of Flynn effect increases can be attributed to increases in guessing.6 Besides these issues, genetic predisposition to educational attainment fell in Iceland by about 0.1 standard units, the equivalent of 1.5 IQ points, in the 20th century, confirming the hypothesis that differential fertility leads to changes in a population’s genetic makeup.7
Other researchers have estimated that average levels of intelligence in the West have fallen by the equivalent of 13 IQ points since the Victorian era based on declines in reaction time.8 This is much larger than what could be reasonably inferred based on differential fertility. Instead, the primary cause of this decline is hypothesized to be mutational load. However, this study suffers from certain methodological issues, notably that some of the early samples were not representative of the general population and that only 14 samples were available.9 Woodley et al. (2013) responded to some of these critiques by arguing that the difference in reaction time between 19th century and modern students is similar to the overall decline in reaction time observed from their samples.
Fortunately, there is a better study on this topic that compares secular trends in the number of digits people can remember (the ‘digit span’ test), depending on whether they must be repeated forwards or backwards.10 The authors involved gathered over 1,700 effect sizes in total and controlled for the effect of moderators, so this study does not share the same concerns as the previous paper mentioned. It found that performance increased for forward digit span tasks, but decreased for backwards digit span tasks in recent years. The latter correlates more with IQ because it is a more cognitively complex task, so this is suggestive evidence that general intelligence has fallen with time. This also holds true for corsi tasks, where the test taker is asked to tap a given sequence of blocks forwards or backwards. Using the summary statistics from the previous study, I calculated that, based on the change in backward digit span, the magnitude of the decline in general intelligence is about 2 points per century.
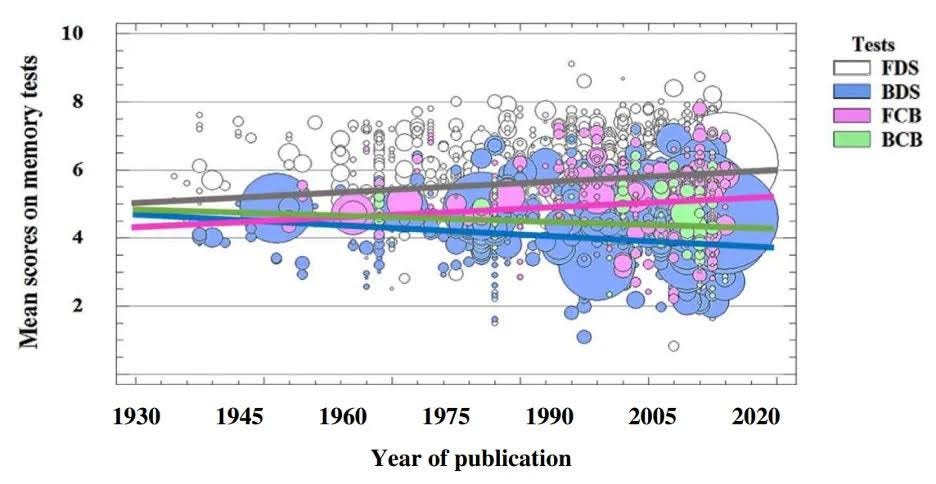
Changes in different kinds of memory tests over time. Size of circle indicates sample size. FDS: forward digit span, BDS: backwards digit span, FCB: forward corsi block span, BCB: backward corsi block span.
Moreover, a decline in intelligence should result in falls in quantitative and verbal abilities of students if the quality of education has stayed the same over time. Fortunately, the National Assessment of Educational Progress has tracked the achievement of American students in math and reading. Over time, Americans have hardly changed in their reading or mathematical abilities. In 1970, 13-year-old students scored 255 out of 500 in reading and 266 out of 500 in mathematics, and in 2023 they scored 256 in reading and 271 in mathematics. This is confounded a bit by immigration, but one might suspect that if anything that makes the arguments against a drop in IQ among Americans who have lived in the country for generations even stronger, given that most new residents over the past several decades have been low-skilled.
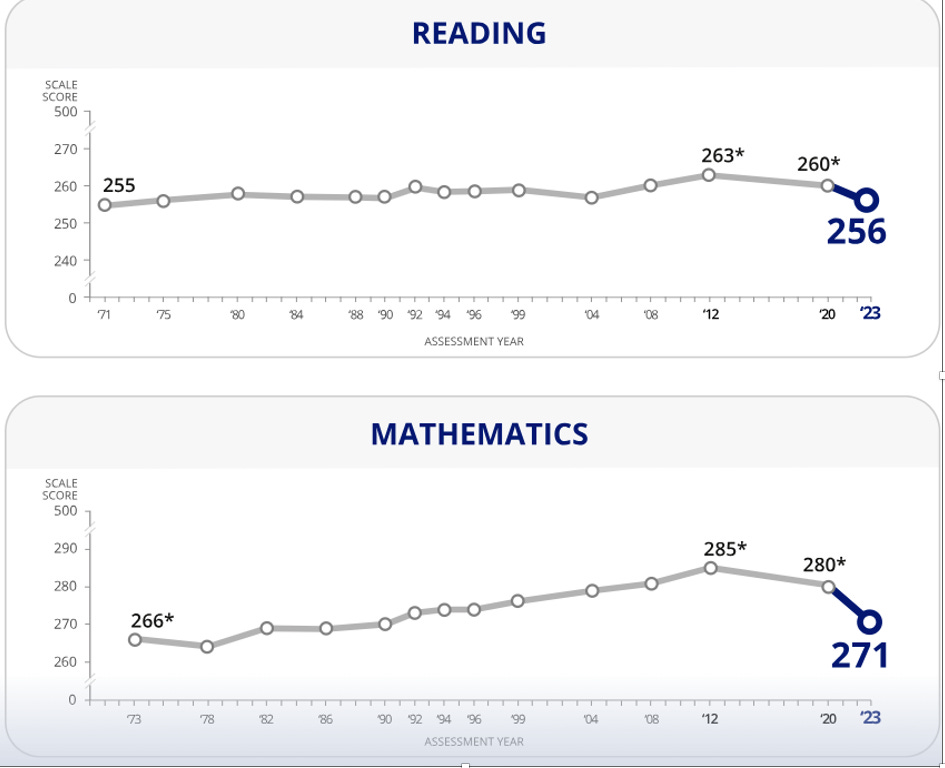
Source: NRC (2024).
If mutational load had such a large effect on IQ, then we might suspect that there would be stronger evidence for its existence by now. However, trends in mathematical performance, reading comprehension, and backwards digit span suggest that the average IQ in the United States has not fallen by a large amount. Sure, these tests do not measure intelligence directly, but if intelligence really was dropping, then performance on at least some of them would be expected to fall as well.
There is a lot of uncertainty in the literature regarding the exact effect of mutational load on the decline in IQ per decade (95% CI: [0.14, 1.5]), based on statistics taken from Woodley (2015). Also, recent research on mutational load finds an effect that is severely attenuated and not statistically significant after controlling for birth order.11 Based on theory, mutational load should result in decreases in IQ over time, but the magnitude of the effect is difficult to measure.
New Cross-National Data
To add to the literature on this topic, I collaborated with Bryan Pesta, George Francis, and Emil Kirkegaard on a study that assessed the relationship between intelligence and fertility in as many countries as possible, and projected the change in the average IQ of each nation and the entire world based on the available data. We were able to gather 156 effect sizes (n = 419,444) from a combination of the academic literature and public data, in particular the datasets of the National Longitudinal Study of Youth (NLSY), General Social Survey (GSS), Programme for International Student Assessment (PISA), Progress in International Reading Literacy Study (PIRLS), and Program for International Assessment of Adult Competencies (PIAAC). Not all of these sources directly test IQ — proxies such as performance in mathematics or reading had to be used in most cases. In some sources, such as the PISA and PIRLS datasets, the IQ of the children was tested instead of the IQ of the adults.
Unfortunately, only 62 countries had data on the relationship between intelligence and fertility, so imputations had to be made for the others. These imputations were estimated using the correlation between educational attainment and fertility, with, depending on the country, national IQ, socioeconomic development, or geographic estimates. For the sake of transparency, all of the figures in this article use data from countries that tested intelligence or a reasonable proxy for it (e.g., mathematical ability, reading comprehension). These projections of the average IQ of each country were then combined with the United Nations’ population projections to estimate the change in the world’s IQ from 2023 to 2100. Note that this analysis does not take into account the possibility that IQ can improve due to socioeconomic development or cultural changes. This may matter in developing nations, but is much less likely to in wealthier countries.
To measure the relationship between intelligence and fertility, we used a statistic called the selection differential: the difference between a reference population and the parents of that population weighted by the number of children each parent has. Then, this number is multiplied by the heritability of IQ to generate a different statistic called the response to selection, which is the expected genetic decline in a trait in one generation. So if the selection differential for IQ is 2 points, and the additive heritability of IQ is 80%, then the response to selection is 1.6, which is the expected genetic decline in that trait in the next generation. As the correlation between the average IQ of two parents and their child’s IQ is about 0.6,12 selection differentials found were shrunk by a factor of 0.6 to estimate the expected decline in genetic intelligence within the next generations. To calculate the projected decline in genotypic IQ per decade in each country, these selection differentials were divided by the average maternal age within each country to calculate the decline per year, and then that decline was multiplied by 10.
This may be an underestimate or overestimate of the true future decline depending on several factors, notably mutational load, environmental shifts, measurement error, and class based differences in generational turnover. Unfortunately, these variable cannot be modeled given the information that we have, so they have not been taken into consideration when projecting the future IQs of different countries.
While I was collecting the data, I noticed that the selection differentials for IQ varied considerably depending on the source. For example, the selection differential for IQ in the USA is about -2.4 based in the NLSY datasets, which were considered the best sources for that country due to the fact IQ was measured very accurately, they are large samples, most individuals were close to completed fertility (ages of 51-64 in NLSY79, 35-38 in NLSY97), and the samples are roughly representative of the nation as a whole. In comparison, the selection differential in the international datasets is -1.2.
It is unclear why this is the case. Perhaps the tests used are of lower quality, or the United States was not sampled in a representative fashion. The NLSY was relied on for the “regional” study of the US, meaning that it did not apply to other countries. It uses a very exhaustive measure of cognitive ability, the ASVAB, while the international datasets only have rough proxies for cognitive ability, which are comprised of 3 subtests in the case of the PISA dataset, one subtest in the case of the PIRLS, and 2-3 subtests in the case of the PIAAC dataset. In addition, the PIAAC dataset had uniquely high estimates of the selection differentials, with the average country having a selection differential for IQ 1.07 points higher than what would be normally expected. The differences in the magnitude of the selection differentials between datasets hold up well between countries, so this effect is not an artefact of different countries being present in each dataset.
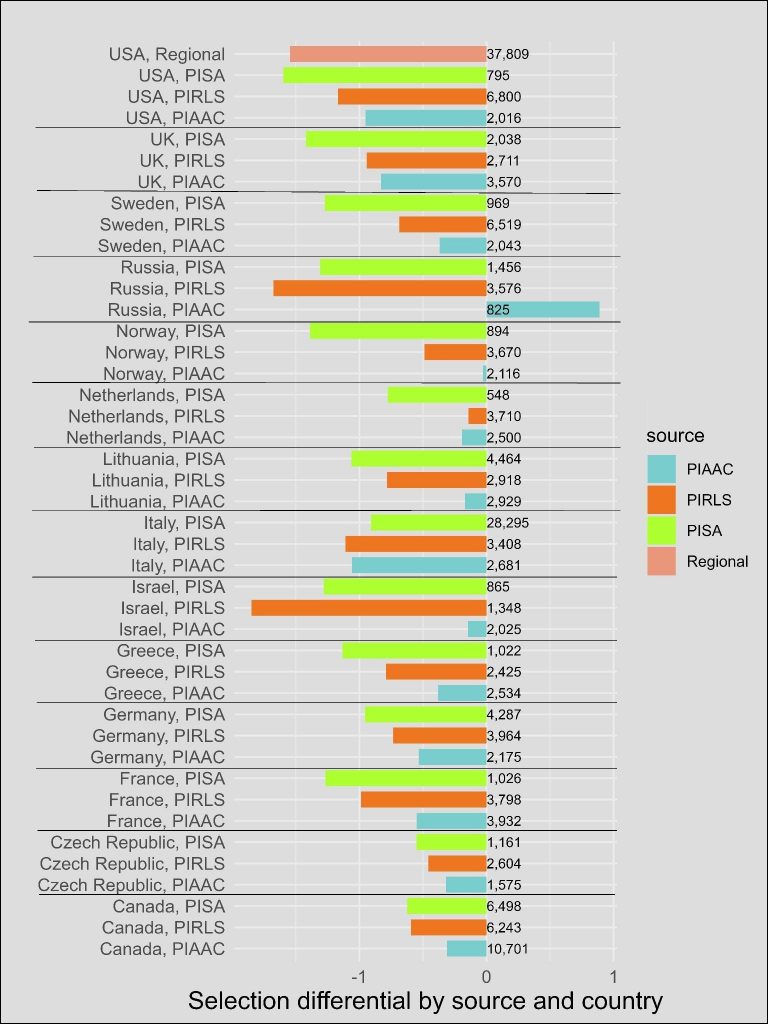
IQ points of parents weighted by number of children.
To correct for the bias introduced by the international (PISA, PIRLS, PIAAC) datasets, two different methods were considered. One assumed that the bias is multiplicative, that is, the international datasets shrink effect sizes by a factor of 0.5; or that the effect is additive, and the international datasets reduce the selection differentials for IQ by 1.2 points. Because it’s not clear which method is better, the results of both were averaged into one final estimation. Besides this adjustment, the effect of specific datasets was also considered, so the effects of individual datasets wouldn’t bias the estimation of the decline between countries.
If the reason why the international datasets have attenuated effect sizes within the United States is sampling error, correcting for this bias will potentially lead to deflated selection differentials within smaller countries, which are easier to sample. The reasoning is as follows: if sampling error is leading to attenuated effect sizes within the international datasets, then correcting for the effect observed within a large country like the United States will overcorrect for the effect of sampling error within other countries that are not as large.
Based on our data, we found that the average country is expected to decline in IQ by 0.35 points per decade, while the whole world is expected to decline by 1.1 points per decade during this century. The reason that the global decline is larger than the decline within the individual countries is that lower IQ nations are expected have higher growth rates. Fortunately, the rate at which global intelligence is falling is slowing down; by the end of the century the decline will only be 0.8 points per decade.
Countries also vary considerably in differential fertility for intelligence. In Iceland, Finland, Denmark, Estonia, and Switzerland, fertility and intelligence are negligibly related, while Latin American and certain Middle Eastern countries have a stronger negative relationship. Part of this is because the latter countries have younger mothers, so selection for intelligence occurs faster independent of the relationship between fertility and intelligence within a generation. But this doesn’t explain the whole relationship, as countries only vary so much in their average maternal ages; the number ranges from 25.7 to 33.4, while the decline in IQ per decade varies much more, from 0.01 in Switzerland to 0.65 in Panama.
Selection differentials for intelligence correlated with both national IQ (r = 0.51) and socioeconomic development (s-factor) (r = 0.48). As s-factor and national IQ are highly correlated (r = 0.8 in this dataset), it is difficult to tell which of these variables is more likely to be driving the relationship.
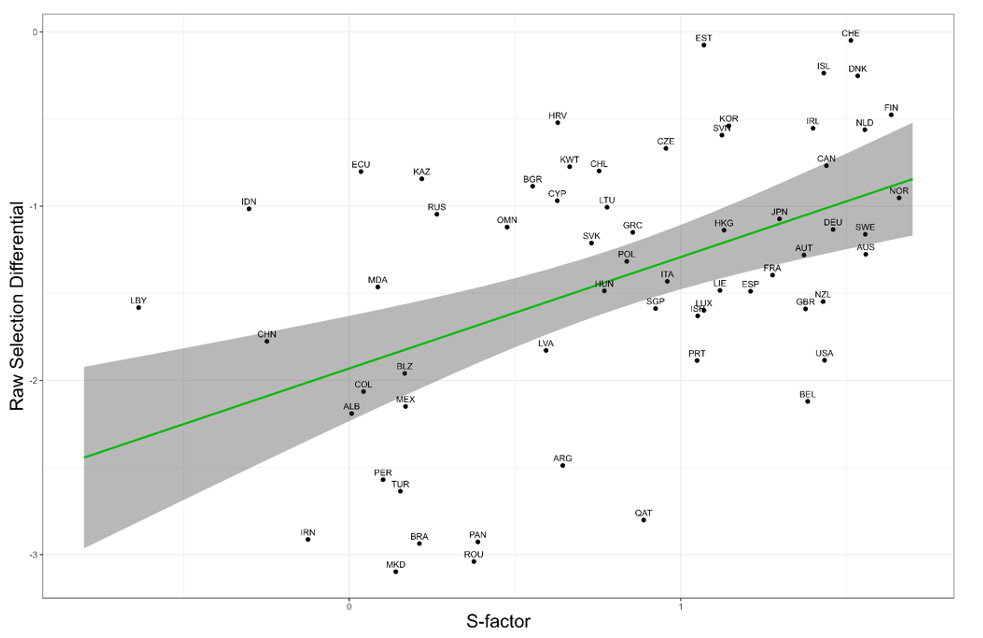
Relationship between socioeconomic development and IQs of parents weighted by number of children.
Prior to conducting the study, I had hypothesized that socioeconomic development past industrialization had a positive effect on selection differentials for IQ, because developed countries have more resources, so a slower life history. In addition, wealthier nations have more variance in years spent in the education system,13 so if education has a negative effect on fertility, the relationship between the two variables should be stronger in developing countries because of lower restriction of range. According to our data, socioeconomic development and the correlation between fertility and education are correlated between countries (r = .27, p < .01), though the relationship is weak and potentially spurious.
Another reason that less developed countries have more negative relationships between intelligence and fertility is that, at the individual level, early births tend to be disproportionately from less intelligent individuals, while later births follow the opposite pattern.14 As developed countries tend to have higher average ages of births (r = .37, p < .001), differential fertility for IQ and socioeconomic development should positively correlate.
The cause of the relationship between national IQ and the selection differential for IQ is opaque — it could be because the average IQ of a nation also measures its social development, or because there is some causal relationship between the two variables.
Alternatively, the relationship between socioeconomic development and the selection differential could be an artefact that arises out of using the IQs of children to estimate the selection differential instead of the parents. If family size has a more negative causal effect on the IQs of children in the developing world, then a positive relationship between the estimated selection differentials and social development will be found, but only because the causality occurs in the opposite direction — that is, larger families cause lower IQs, rather than the other way around. Because the heritability of fertility is very low,15 this environmental effect won’t be transmitted in any large degree to future generations, so the decline in IQ of these nations may be overestimated.
Implications and Conclusion
Besides the fact that the effect is weak within most developed nations, embryo selection for intelligence, and potentially other technologies, can attenuate secular decreases in intelligence, though I doubt the practice will be adopted by most of the general population. The average member of the public estimates their likelihood of using embryo selection to boost intelligence at 35%, with 30% morally opposed to the practice.16 Data from Pew Research (2018) suggests that favorability among the public may be even lower, with only 19% of Americans saying that selecting embryos for intelligence is an appropriate use of medical technology, while 80% think that it takes science too far. Embryo selection is also very expensive at the moment, with clinics requesting between $4,000 to $20,000 for the service, so some of the population will be priced out.17 Nonetheless, it is historically common for a practice to be rejected by the public at first and then have opinion towards it shift as its availability increases and its benefits become clear. Therefore, polls should be seen as reflecting a lower bound estimate for how many people might use a technology.
Assuming that 20% of Westerners in the future select their embryos for intelligence, half of those 20% only select for intelligence, and 20% of the causal variance in cognitive ability can be estimated with genes, then embryo selection will boost the average IQ of the population by approximately 0.73 points per generation (math done with gwern’s help). This is roughly equivalent to an increase of 0.24 IQ points per decade, which is enough for most developed countries to maintain their current levels of intelligence, assuming that the relationship between intelligence and fertility remains the same. Theoretically, genetic predictors should be able to explain up to 50% of the variance in intelligence, so this may be an underestimate of the impact of embryo selection.
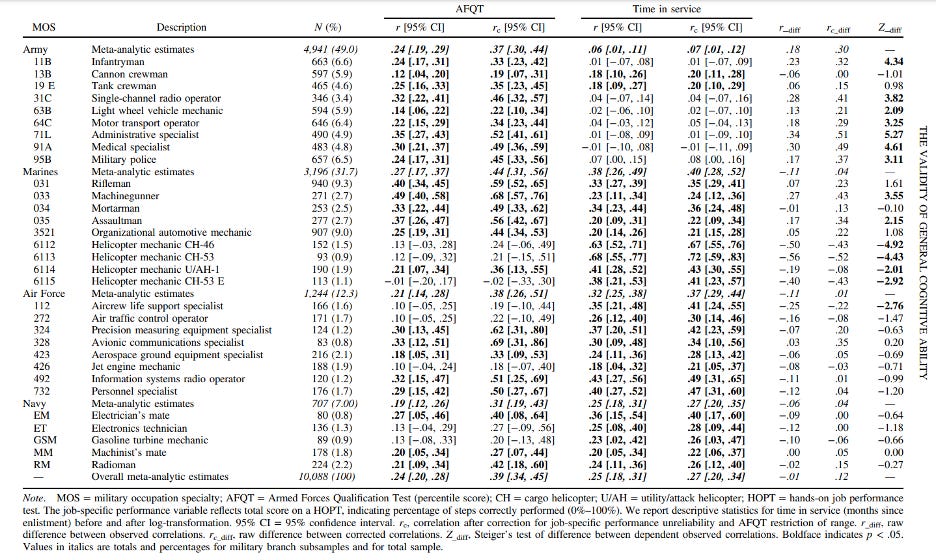
Some commentators like Anatoly Karlin argue that concerns about national IQ will not be as relevant once strong artificial intelligence has been developed, as lots of white collar work will then be automatable. This is true, but there are other reasons why national IQ would continue to be useful in the future; barring rapid technological breakthroughs, manual labor will still need to be done by humans, and job performance and IQ correlate at about 0.4, even within categories like rifleman (r = .59) and military policeman (r = .46).18
Across individuals, low IQ is a predictor of marital instability,19 obesity,20 and criminality,21 and the relationships are likely to be causal as they cannot be ascribed to confounders. This means that declines in national intelligence will lead to lower levels of wealth and social peace, and potentially civilizational collapse if the fall is too severe.
What is most concerning is the strong negative relationship between fertility and intelligence that is observed in some developing countries, like Turkey and Brazil. By the end of this century, these countries will have dropped by 5.5 and 6.4 points respectively. The effectiveness of embryo selection for intelligence drops with genetic distance from the reference population.22 This technique may therefore be effective for populations that are genetically close to Europeans like white Brazilians or Turks, but less so for people from Central America or Southeast Asia. Even worse, countries that are less developed are less likely to adopt embryo selection and similar practices in the first place, and will need to use the technology more to sustain their current levels of intelligence.
Figures for changes in IQ within nations and across the world should not be taken as exact estimates. They depend on many assumptions: for example, that the rate of differential selection by IQ doesn’t shift over time, the heritability of IQ stays constant, and nations do not see a rise or fall in IQ anywhere due to cultural or technological changes unrelated to patterns of fertility. It is certain that not all of these assumptions will hold for all countries indefinitely into the future. Nonetheless, given the importance of intelligence for accomplishing practically all human goals, it is worth undertaking back-of-the-envelope calculations to give us some idea of how worried we should be. The exercise is enough to determine that selection for low IQ is a minor problem in wealthier states, and potentially much more concerning in developing countries.
Notes
1 Chapman, J. Crosby, and D. M. Wiggins. 1925. “Relation of family size to intelligence of offspring and socio-economic status of family.” The Pedagogical Seminary and Journal of Genetic Psychology 32(3): 414–421; Lentz Jr, Theodore. 1927. “Relation of IQ to size of family.” Journal of Educational Psychology 18(7): 486–96.
2 Reeve, Charlie L., Michael D. Heeney, and Michael A. Woodley. 2018. “A systematic review of the state of literature relating parental general cognitive ability and number of offspring.” Personality and Individual Differences 134: 107–18.
3 Woodley, Michael A. 2015. “How fragile is our intellect? Estimating losses in general intelligence due to both selection and mutation accumulation.” Personality and Individual Differences 75: 80–84.
4 Wongupparaj, Peera, et al. 2017. “The Flynn effect for verbal and visuospatial short-term and working memory: A cross-temporal meta-analysis.” Intelligence 64: 71–80.
5 Beaujean, A. Alexander, and Steven J. Osterlind. 2008. “Using item response theory to assess the Flynn effect in the National Longitudinal Study of Youth 79 Children and Young Adults data.” Intelligence 36(5): 455–63.; Wicherts, Jelte M., et al. 2004. “Are intelligence tests measurement invariant over time? Investigating the nature of the Flynn effect.” Intelligence 32(5): 509-537.
6 Woodley, Michael A., et al. 2014. “Controlling for increased guessing enhances the independence of the Flynn effect from g: The return of the Brand effect.” Intelligence 43: 27-34.
7 Kong, Augustine, et al. 2017. “Selection against variants in the genome associated with educational attainment.” Proceedings of the National Academy of Sciences, 114(5): E727-32.
8 Woodley, Michael A., Jan te Nijenhuis, & Raegan Murphy. May 26, 2013. A response to two critical commentaries on Woodley, te Nijenhuis & Murphy (2013). The Unz Review.
9 Alexander, Scott. 2013. The Wisdom of the Ancients. Slate Star Codex.
10 Wongupparaj et al. 2017.
11 Wang, Mingrui. 2023. “Estimating the parental age effect on intelligence with controlling for confounding effects from genotypic differences.” Personality and Individual Differences 207: 112137.
12 Reed, Sheldon C., and Stephen S. Rich. 1982. “Parent-offspring correlations and regressions for IQ.” Behavior Genetics 12: 535–42.
13 Baloch, Amdadullah, et al. 2017. “The impact of gender equality on education inequality: A global analysis based on GMM dynamic panel estimation.” Universiti Putra Malaysia.
14 Kolk, Martin, and Kieron Barclay. 2019. “Cognitive ability and fertility among Swedish men born 1951–1967: evidence from military conscription registers.” Proceedings of the Royal Society B286.1902: 20190359.9.
15 Sacerdote, Bruce. 2007. “How large are the effects from changes in family environment? A study of Korean American adoptees.” The Quarterly Journal of Economics 122(1): 119–57.
16 Meyer, Michelle N., et al. 2023. “Public views on polygenic screening of embryos.” Science 379.6632: 541–43.
17 PFCLA. (August 9, 2022). “Cost of preimplantation genetic testing: Is PGS/PGT-A right for you?” PFC Management LLC; AFCC. (n.d.). PGD costs. Advanced Fertility Center of Chicago. Retrieved December 12, 2023.
18 Hambrick, David Z., Alexander P. Burgoyne, and Frederick L. Oswald. 2023. “The validity of general cognitive ability predicting job-specific performance is stable across different levels of job experience.” Journal of Applied Psychology.
19 Holley, Paul, Scott Yabiku, and Mary Benin. 2006. “The relationship between intelligence and divorce.” Journal of Family Issues 27(12): 1723–48.
20 Kanazawa, Satoshi. 2014. “Intelligence and obesity.” Current Opinion in Endocrinology & Diabetes and Obesity 21(5): 339–44.
21 Frisell, Thomas, Yudi Pawitan, and Niklas Långström. 2012 “Is the association between general cognitive ability and violent crime caused by family-level confounders?” PloS one 7(7): e41783.
22 Ding, Yi, et al. 2023. “Polygenic scoring accuracy varies across the genetic ancestry continuum.” Nature: 1-8.
* Republished from the original publication on CSPI.