_ Yuri Kofner, junior economist, Institute for Market Integration and Economic Policy. Munich, 6 June 2020.
One of the main arguments of Belarusian economists and statesmen against the further deepening of trade and economic relations between Minsk and Moscow under the framework of the Eurasian Economic Union (EAEU) or the BLR-RUS Union State is the stable negative balance of Belarus in goods trade with the Russian Federation.
Indeed, in 2012-2018, the deficit of Belarus in goods trade with the Russian Federation amounted to USD 8.5 billion on average annually (see Tab. 1).
According to economist, dean of the Faculty of Economics of the BSU (1999-2018), professor, Dr. Sc. Mikhail Kovalev, this amount can be seen as de-facto subtracted each year from the country’s economic product, according to the traditional concept of the GDP structure:
Y= C+I+G+(X-M).
The stable goods trade deficit of Belarus with Russia thus can be regarded a negative factor in Eurasian integration, limiting the republic’s potential for economic development, and, therefore, as an argument about the right of Minsk to demand a certain kind of compensation in return for these losses. For example, in the form of discounts on Russian oil or gas supplies to Belarus. This, by the way, is the same mercantilist mindset that Donald Trump uses in criticizing the US-CHN and US-EU merchandise trade deficit, and which ultimately led to the rather one-sided US-China “Phase-One-Deal” agreement.
However, is the Belarussian trade deficit with Russia really so bad?
In order to answer this question, in this article I would like to: a. see whether Belarus’s negative trade balance is characteristic only for goods trade with Russia, i.e. whether it is indeed the fault of Eurasian integration; b. study the structure of the country’s goods trade deficit c. look at the BLR-RUS trade balance in services trade, personal cross-border payments and foreign direct investments.
The negative balance is not exclusive to BLR-RUS goods trade
In 2010-2018, the negative balance of Belarus in merchandise trade with China amounted to USD 1.6 billion on average annually (Tab. 2), and to USD 3.5 billion with the European Union (Tab. 3). From this we may conclude that not the participation of the Republic of Belarus in the EAEU and the Union State is the (first) reason for its merchandise trade deficit with the Russian Federation, but rather its position in the international division of labor.
Moreover, the negative balance in merchandise trade of Belarus with the European Union grew by 7.1 percent on average each year (Tab. 3), in merchandise trade with China – even by 73.4 percent (Tab. 2). For comparison, the country’s goods trade deficit with Russia grew by only 1.4 percent on average annually (Tab. 1). It may follow from this that Eurasian integration actually expanded Belarussian export opportunities in the Russian market. Yet one should be careful with this interpretation, since here “correlation not necessarily means causation”.
Nonetheless, a study by the recognized Vienna Institute for International Economic Research (wiiw) from 2018 using a “gravity model” found that, thanks to the creation of the Eurasian customs union, factual export volumes from Belarus to Russia were on average one third higher in 2010-2015 than they could have been without its establishment, and, that, in fact, the greatest “trade creation effect” of the Eurasian CU was noticeable for the Republic of Belarus.
My own studies also indicate that out of all of the five EAEU member states: a. Minsk was most able to significantly increase its share in Russian imports in many sectors due to Eurasian integration and Moscow’s counter-sanction policies; b. Belarus would incur the greatest losses from a hypothetical dissolvement of the Eurasian Economic Union (-21.1 percent of its GDP).
Belarus has a surplus in non-fuels trade with Russia
In 2012-2018, coal, lignite, crude petroleum and natural gas – in this article summarily defined fuels – constituted on average 53.6 percent of Belarussian imports from Russia. For comparison, in 2010-2018, fuels made up only 0.6 percent of the country’s imports from the European Union and less then 0.002 percent of imports from China.
If one considers only non-fuels trade, Russia is the only partner with which Belarus has a trade surplus: of USD 2.1 billion on average each year during the study period (Tab. 4). In non-fuels trade, Belarus has an even greater balance deficit with the European Union of USD 5 billion annually on average (Tab. 5). This can be explained by the fact that fuels make up almost a third (31.5 percent) of Belarussian exports to the EU27 and are most likely reexports of petrol and gas originating from Russia. Belarussian merchandise trade with China basically is non-fuels trade and here the deficit is the same: USD 1.6 billion on average yearly.
Whereas the deficit in non-fuels trade with China grew by 73.4 percent yearly on average, as mentioned above, it practically remained unchanged with the EU27 (-0.1 percent). However, the BLR-RUS non-fuels trade surplus grew at 46.5 percent on average each year.
The fact that Belarus has a net surplus in non-energy goods trade only with Russia, and that it has grown significantly over the past six years, is another indicator that Eurasian integration actually contributes to the country’s economic development.
Belarussian exports to Russia became more sophisticated
Another criticism that often can be heard as an argument against the further deepening of Belarusian-Russian integration is that it led to the simplification of Belarusian exports to Russia. That is the belief that increased competition within the EAEU and the Union State caused the Republic of Belarus to buy more industrial goods from the Russian Federation and to sell more agricultural products, fertilizers and other low added-value products to Russia.
However, the opposite is true. In 2012-2018 the average share of finished goods in Belarussian exports to the Russian Federation amounted to 87.8 percent, of semi-processed goods to 9.9 percent and of raw materials to 2.3 percent. For comparison, over the study period, raw materials made up almost half of Russian exports to Belarus (48.4 percent), semi-processed and finished goods only 21.3 and 30.3 percent, respectively (Chart 1, Tab 6.).
Chart 1. Level of processing structure of BLR-RUS goods trade (2012-2018 average, in percent)
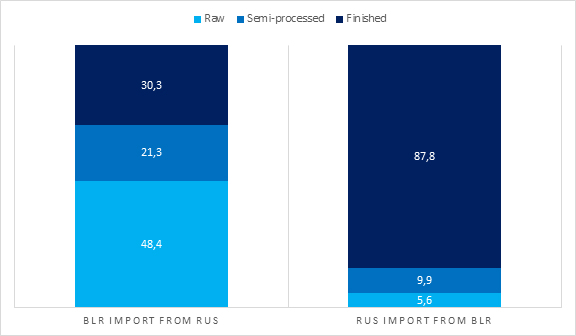
 Source: WITS (Comtrade) using MTN classification and author’s calculations.
Moreover, between 2012 and 2018 the share of finished products increased from 86.8 to 98.2 percent (Chart 2, Tab. 6). In other words, higher-added value goods now constitute practically all Belarussian exports to Russia.
Chart 2. Level of processing of BLR export to RUS (2012-2018, in percent)
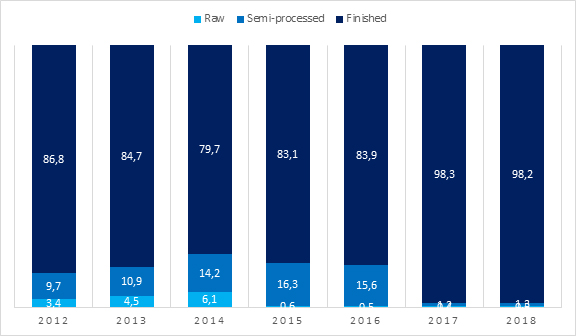
 Source: WITS (Comtrade) using MTN classification and author’s calculations.
This trend, as well as the Belarusian-Russian import-export structure is not only another indicator of the usefulness of Eurasian integration for Minsk, but also suggests that Belarus imports Russian raw materials and energy carriers, processes them and then sells them back to the Russian market as finished goods.
Belarus also has a net surplus in personal transfers and investments from Russia
In the discussion on the desirability of further deepening integration, it is often forgotten that goods constitute only one of the four factors of production that are relevant to trade and economic relations. For a more complete picture, one ought to look at the state of affairs in trade in services, cross-border transfers (representative of labor migration) and direct investment.
As in goods trade, in trade in services Belarus has negative balance with the Russian Federation of USD 1.2 billion on average annually for the period 2014-2018. And similarly, this deficit increased each year by only 1.4 percent on average (Tab. 7).
However, both in personal cross-border transfers and FDI the country has a net surplus with Russia.
The annual average surplus in BLR-RUS cross border payments and personal remittances constituted USD 809 m over 2012-2019, yet decreased slightly by 2.8 percent on average y.o.y. over the study period (Tab. 8).
The annual average surplus in BLR-RUS foreign direct investment contributed another USD 770 m over 2010-2018 to the Belarussian economy. Over the study period it increased by 18.8 percent on average each year, which, however, is caused by a 200 percent rise in net FDI in 2011 y.o.y. to 2010. Without this outlier the surplus actually declined by almost four percent (-3.9 percent) on average annually (Tab. 9).
Russian hydrocarbons make the difference
If one puts all the above yearly average net balances of BLR-RUS movement in goods, services, personal cross-border payments and investment into a stylized “balance of payments” version, one can see, that Belorussia’s annual average net deficit in trade and economic relations with Russia is not USD 8.5 billion, which represents only trade in goods, but actually only USD 1.2 billion, which is commensurate with its average deficit in services trade with the Russian Federation or equivalent to a loss of 1.9 percent of the country‘s GDP in 2018 (USD 60 billion according to World Bank data).
However, if we consider not all trade in goods, but only non-fuels trade, then the Republic of Belarus has a significant positive net balance in trade and economic relations with the Russian Federation: 9.5 billion US dollars on average annually or comparable to a 15.7 percent contribution to the country‘s GDP in 2018 (Tab. 10).
As one can infer, significant imports of Russian energy carriers, mainly crude oil and gas, make the difference in turning the large net deficit in overall trade and economic relations between Minsk and Moscow into a large net surplus.
Conclusions and policy recommendations
Returning to the question posed at the beginning of the article, it can be argued that the negative trade balance of Belarus with the Russian Federation is not as bad as it is often portrayed. And it certainly cannot be one of the main reasons for criticizing the Eurasian integration of Belarus.
Firstly, Belarus has a negative goods trade balance not only with Russia, but also with the European Union and China. Of course, the Belarusian side can ask a fair question to this – why then does Minsk need Eurasian integration if there is no difference anyway? But there is a difference: the deficit with the Russian Federation grew much more slowly compared to that with the EU and China.
And secondly, in non-fuels trade, only with Russia does Belarus have a significant surplus. There is no difference with China, and in non-fuels trade with the EU27 the deficit is even greater.
Thirdly, contrary to what Donald Trump and some of his followers might think, a net deficit in merchandise trade may not necessarily be a bad thing. According to the theory of comparative advantage, countries even benefit from imports. National enterprises get cheaper, and possibly qualitatively better input, which they can process and sell with higher added value domestically or abroad. Import, therefore, can increase national corporate profit. And domestic households benefit from imports due to cheaper, and possibly higher-quality goods. This increases the real income of citizens. In the end, imports may not reduce, but even increase overall national income.
Of course, the decisive factor is the commodity structure of imports. In this sense, it is generally better to import lower value-added goods, process them for domestic sale or export of higher value-added goods. The trade structure in terms of the level of processing between the Republic of Belarus and the Russian Federation indicates just such a relation.
Fourth, Belarus has a net surplus in personal money transfers and direct investment from Russia. As a result, its overall balance of payments, reflecting the movement of the four factors of production, shows a much smaller overall deficit with the Russian Federation compared to its goods trade deficit in iteself. If one excludes fuels trade from the formula, then Minsk has a significant net surplus with the Russian Federation.
All the above observations indicate (but not proof) that integration within the EAEU and the Union State, i.e. the process of facilitating mutual access to each other’s markets, was and is in fact beneficial for the Republic of Belarus.
By the way, asymmetries in merchandise trade balances between member states are not peculiar only to the EAEU. For example, according to Eurostat, France has a net deficit in intra-EU trade for twenty years now. Moreover, from 2002 to 2019 it grew from USD 19 billion to USD 112 billion.
However, a more balanced view of BLR-RUS trade and economic relations, which was the main purpose of this article, certainly does not solve the remaining problem of the Belarussian trade deficit with Russia.
In this regard, the following general policy recommendations may be given to the Belarussian government:
→ Reduce the fuels trade deficit
Firstly, Minsk could try to reduce the costs of Russian fuel in its balance sheet. There are several possible options for this: 1. Either by obtaining a discount on gas imports from Gazprom or by receiving subsidies for Belarussian oil refineries from the Russian budget to mitigate the negative effects of Moscow’s “tax maneuver” (a potential loss of 1.5 percent of the country’s GDP). 2. Or due to a technological reduction in the dependence on traditional energy sources, i.e. by increasing the energy efficiency of the Belarusian economy and by switching to renewable energy sources, for example, through the construction of nuclear power plants, wind farms and biofuel production. 3. Or through geographic diversification of energy imports, for example, by increasing the share of crude oil supplies from Venezuela, Iran or of reverse supplies from Europe. However, in general, this third option does not at all guarantee a reduction in total fuel costs and the country’s overall trade deficit.
→ Increase the non-fuels trade surplus
Secondly, as part of its 2020 presidency in the bodies of the Eurasian Economic Union, Minsk should continue to insist on reducing non-tariff barriers (NTBs) in intra-EAEU non-fuels trade. A recent study by the Russian Foreign Trade Academy (RFTA) showed that reducing NTBs and time costs in mutual goods trade would add 2.2 percent to Belarus’s GDP annually.
→ Reduce the trade in services deficit
Thirdly, since the Eurasian Economic Union has achieved its greatest success in creating a common labor market, making more substantial progress in this area, at least in the near future, seems rather unlikely. In great contrast to this, Minsk should pay much more attention to the liberalization of intra-EAEU trade in services. The negligence towards this crucial area is made evident by the fact that harmonized regulation covers only 17 percent of the common services market, and that only nine (!) people work in the Eurasian Economic Commission’s division responsible for this important integration area.
Of course, it would be in the interest of Belarus to facilitate access to the EAEU common services market primarily in those areas where the Belarusian sectors might have a comparative advantage, e.g. in the IT industry or in transport services.
→ Increase the investment surplus
Last but not least, Minsk could think about a reform to liberalize FDI regulation, including the liberalization of its financial market within the EAEU. It would also be worth exploring the feasibility of privatizing part of its state-owned enterprises. These steps would help attract new foreign direct investment into the Belarussian economy. The above-mentioned study by the RFTA estimated that reducing obstacles to the free intra-union movement of capital and services would raise the country’s GDP by another 0.5 percent.
***
Post scriptum: Belarussian merchandise exports to the EAEU market increased
Another complaint by Belarussian experts about the republic’s participation in the Eurasian integration project is the assertion that the country’s export volume to the other EAEU member states has not particularly increased over the years. And indeed, if in 2012 the volume of export of Belarus to the other member states of the union amounted to USD 13.8 billion, then in 2019 it reached only USD 14.6 billion. In 2013-2019, Belarusian goods exports within the EAEU grew by only 2.9 percent on average annually (Chart 3, Tab. 11).
Chart 3. BLR-EAEU goods trade dynamics (2010-2018, in current USD m)
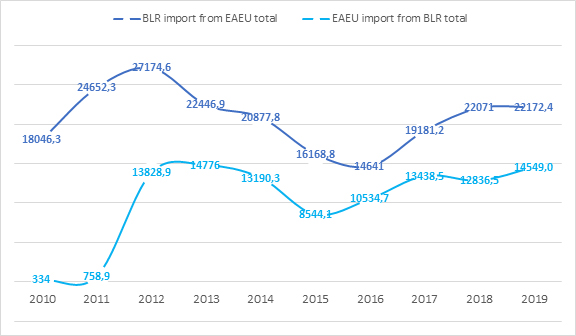
 Source: WITS UN Comtrade using SIC classification and author’s calculations.
However, these data are recorded in current prices and do not take into account the sharp devaluation of the national currencies of the EAEU member states compared to the USD and EUR in 2014-2015. If we express the trade data in the 2010 USD/RUB exchange rate, then it turns out that between 2012 and 2019 Belarusian goods exports to the other countries of the integration bloc more than doubled from USD 14.2 billion to USD 31 billion. The average year on year export growth rate for 2013-2019 was then 12.3 percent.
Chart 4. BLR-EAEU goods trade dynamics (2010-2018, in 2010 USD/RUB m)
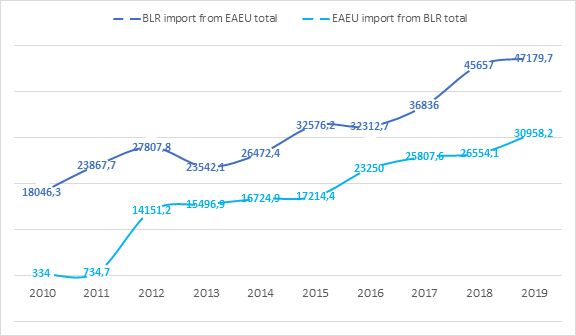
 Source: WITS UN Comtrade using SIC classification and author’s calculations.
Annex:
Table 1. BLR-RUS goods trade dynamics (2012-2018, in USD m)
| BLR import from RUS total | RUS import from BLR total | Balance total | Balance growth rate (in percent y.o.y. change) | |
| 2012 | 27036.5 | 12963.2 | -14073.3 | – |
| 2013 | 22348.0 | 13930.8 | -8417.2 | -40.2 |
| 2014 | 20780.4 | 12300.6 | -8479.8 | 0.7 |
| 2015 | 16114.6 | 7972.6 | -8142.0 | -4.0 |
| 2016 | 14574.9 | 10145.0 | -4430.0 | -45.6 |
| 2017 | 19071.4 | 12762.5 | -6308.9 | 42.4 |
| 2018 | 21940.0 | 12145.0 | -9795.0 | 55.3 |
| Yearly average | 20266.6 | 11745.7 | -8520.9 | 1.4 |
Source: WITS UN Comtrade using SIC classification and author’s calculations.
Table 2. BRL-CHN goods trade dynamics (2010-2018, in USD m)
| BLR m CHN total | CHN m BLR total | Balance total | Balance growth rate (in percent y.o.y. change) | |
| 2010 | 1608.1 | 476.1 | -1132.0 | – |
| 2011 | 2156.9 | 599.4 | -1557.5 | 37.6 |
| 2012 | 2341.9 | 663.1 | -1678.7 | 7.8 |
| 2013 | 2822.8 | 580.5 | -2242.2 | 33.6 |
| 2014 | 946.3 | 738.3 | -208.1 | -90.7 |
| 2015 | 2319.4 | 1010.8 | -1308.6 | 528.9 |
| 2016 | 2115.4 | 435.2 | -1680.3 | 28.4 |
| 2017 | 2693.7 | 515.3 | -2178.4 | 29.6 |
| 2018 | 3006.6 | 570.9 | -2435.7 | 11.8 |
| Yearly average | 2223.5 | 621.1 | -1602.4 | 73.4 |
Source: WITS UN Comtrade using SIC classification and author’s calculations.
Table 3. BRL-EU27 goods trade dynamics (2010-2018, in USD m)
| BLR import from EU27 total | EU27 import from BLR total | Balance total | Balance growth rate (in percent y.o.y. change) | |
| 2010 | 7476.9 | 3556.2 | -3920.7 | – |
| 2011 | 8633.1 | 5995.1 | -2638.0 | -32.7 |
| 2012 | 9253.9 | 6010.3 | -3243.6 | 23.0 |
| 2013 | 10449.2 | 4557.9 | -5891.3 | 81.6 |
| 2014 | 12775.5 | 4745.7 | -8029.8 | 36.3 |
| 2015 | 5744.1 | 4249.0 | -1495.1 | -81.4 |
| 2016 | 5450.9 | 3315.0 | -2135.9 | 42.9 |
| 2017 | 6596.1 | 3907.4 | -2688.7 | 25.9 |
| 2018 | 7055.7 | 5404.0 | -1651.7 | -38.6 |
| Yearly average | 8159.5 | 4637.8 | -3521.6 | 7.1 |
Source: WITS UN Comtrade using SIC classification and author’s calculations.
Table 4. BLR-RUS non-fuel goods trade dynamics (2012-2018, in USD m)
| BLR import from RUS non-fuel | RUS import from BLR non-fuel | Non-fuel balance | Non-fuel balance growth rate (in percent y.o.y. change) | Percent of fuel in total BLR import from RUS | |
| 2012 | 10128.0 | 12815.8 | 2687.9 | – | 62.5 |
| 2013 | 10325.1 | 13235.6 | 2910.4 | 8.3 | 53.8 |
| 2014 | 9296.7 | 11274.8 | 1978.1 | -32.0 | 55.3 |
| 2015 | 7118.7 | 7602.5 | 483.8 | -75.5 | 55.8 |
| 2016 | 7438.6 | 9984.2 | 2545.6 | 426.2 | 49.0 |
| 2017 | 9675.5 | 12631.7 | 2956.2 | 16.1 | 49.3 |
| 2018 | 11040.0 | 12109.8 | 1069.9 | -63.8 | 49.7 |
| Yearly average | 9288.9 | 11379.2 | 2090.3 | 46.5 | 53.6 |
Source: WITS UN Comtrade using SIC classification and author’s calculations.
Table 5. BLR-EU27 non-fuel goods trade dynamics (2010-2018, in USD m)
| BLR import from EU27 non-fuel | EU27 import from BLR non-fuel | Non-fuel balance | Non-fuel balance growth rate (in percent y.o.y. change) | Percent of fuel in total BLR import from EU27 | |
| 2010 | 7427.5 | 2520.1 | -4907.4 | – | 0.7 |
| 2011 | 8580.4 | 3067.6 | -5512.8 | 12.3 | 0.6 |
| 2012 | 9191.8 | 2731.5 | -6460.3 | 17.2 | 0.7 |
| 2013 | 10385.5 | 2952.4 | -7433.1 | 15.1 | 0.6 |
| 2014 | 12716.0 | 3191.8 | -9524.3 | 28.1 | 0.5 |
| 2015 | 5711.3 | 2928.2 | -2783.1 | -70.8 | 0.6 |
| 2016 | 5423.1 | 2742.5 | -2680.6 | -3.7 | 0.5 |
| 2017 | 6561.5 | 3219.8 | -3341.8 | 24.7 | 0.5 |
| 2018 | 7016.8 | 4462.5 | -2554.3 | -23.6 | 0.6 |
| Yearly average | 8112.7 | 3090.7 | -5022.0 | -0.1 | 0.6 |
Source: WITS UN Comtrade using SIC classification and author’s calculations.
Table 6. Level of processing structure of BLR-RUS goods trade (2012-2018, in percent of total)
| Raw | Semi-processed | Finished | |
| 2012 | 3.4 | 9.7 | 86.8 |
| 2013 | 4.5 | 10.9 | 84.7 |
| 2014 | 6.1 | 14.2 | 79.7 |
| 2015 | 0.6 | 16.3 | 83.1 |
| 2016 | 0.5 | 15.6 | 83.9 |
| 2017 | 0.4 | 1.2 | 98.3 |
| 2018 | 0.5 | 1.3 | 98.2 |
| Average (2012-2018) | 2.3 | 9.9 | 87.8 |
Source: WITS (Comtrade) using MTN classification and author’s calculations.
Table 7. BLR-RUS services trade dynamics (2014-2018, in USD m)
| BLR m RUS | RUS m BLR | Balance | Balance growth rate (y.o.y. change in percent) | |
| 2014 | 1486.4 | 317.2 | -1169.2 | – |
| 2015 | 1249.6 | 279.2 | -970.4 | -17.0 |
| 2016 | 1195 | 249.2 | -945.8 | -2.5 |
| 2017 | 1535 | 293.2 | -1241.8 | 31.3 |
| 2018 | 1750.3 | 338.5 | -1411.8 | 13.7 |
| Total (2014-2018) | 7216.3 | 1477.3 | -5739 | – |
| Yearly average | 1443.3 | 295.5 | -1147.8 | 6.4 |
Source: EEC Statistics Department and author’s calculations.
Table 8. BLR-RUS cross-border payments and personal remittances (2012-2019, in USD m)
| Cross border payments | Personal remittances | Cross border payments + personal remittances | ||||||
| from BLR to RUS | from RUS to BLR | from BLR to RUS | from RUS to BLR | from BLR to RUS | from RUS to BLR | Balance | Balance growth rate (y.o.y. change in percent) | |
| 2012 | 137 | 254.6 | 32.5 | 844.1 | 169.5 | 1098.7 | 929.2 | – |
| 2013 | 205.1 | 347.2 | 59.5 | 992 | 264.6 | 1339.2 | 1074.6 | 15.6 |
| 2014 | 253.3 | 311.2 | 74.4 | 999.7 | 327.6 | 1310.9 | 983.3 | -8.5 |
| 2015 | 172.7 | 251.7 | 65.3 | 584.8 | 238 | 836.5 | 598.5 | -39.1 |
| 2016 | 120 | 267.4 | 60.6 | 560.9 | 180.6 | 828.3 | 647.7 | 8.2 |
| 2017 | 101.4 | 297.5 | 74.3 | 710.9 | 175.7 | 1008.4 | 832.7 | 28.6 |
| 2018 | 118.8 | 301 | 83 | 664.8 | 201.8 | 965.8 | 764 | -8.3 |
| 2019 | 150.4 | 276.6 | 101.9 | 617.5 | 252.3 | 894.1 | 641.8 | -16.0 |
| Yearly average | 157.3 | 288.4 | 68.9 | 746.8 | 226.3 | 1035.2 | 809 | -2.8 |
| Total (2012-2019) | 1258.6 | 2307.3 | 551.6 | 5974.6 | 1810.2 | 8281.9 | 6471.7 | – |
Source: EEC Statistics Department and author’s calculations.
Table 9. BLR-RUS foreign direct investment (2010-2018, in USD m)
| from RUS to BLR | from BLR to RUS | Balance | Balance growth rate (y.o.y. change in percent) | |
| 2010 | 933.7 | 34.3 | 899.4 | – |
| 2011 | 2819.6 | 121.1 | 2698.5 | 200.0 |
| 2012 | 469.9 | 110.5 | 359.4 | -86.7 |
| 2013 | 862.7 | 219.4 | 643.3 | 79.0 |
| 2014 | 608.8 | 58.7 | 550.2 | -14.5 |
| 2015 | 735.1 | 42.2 | 692.9 | 25.9 |
| 2016 | 543.2 | 46 | 497.1 | -28.3 |
| 2017 | 455.7 | 47.9 | 407.8 | -18.0 |
| 2018 | 566.5 | 52.8 | 513.7 | 26.0 |
| 2019 | 452.6 | 14.6 | 438 | -14.7 |
| Yearly average | 844.8 | 74.7 | 770 | 18.8 |
| Total | 8447.9 | 747.5 | 7700.4 | – |
Source: EEC Statistics Department and author’s calculations.
Table 10. Stylized BLR net balance of payments with RUS (2010-2019 average, in USD m)
| Sector | Yearly average net balance | ||
| Goods trade | Total trade
-8520.9 |
Non-fuel trade
(2090.3) |
|
| Services trade | -1147.8 | ||
| Cross-border payments and personal remittances | 809.0 | ||
| FDI | 7700.4 | ||
| Total | -1159.3 | (9451.9) | |
Source: WITS (Comtrade), EEC Statistics Department and author’s calculations.
Table 11. BLR-EAEU goods trade dynamics (2010-2018, in USD m)
| Volumes in current USD | Volumes adjusted to 2010 RUB to USD exchange rate | |||||||
| BLR import from EAEU total | EAEU import from BLR total | EAEU import from BLR growth rate (y.o.y. percentage change) | Annual average RUB to USD exchange rate | Factor | BLR import from EAEU total | EAEU import from BLR total | EAEU import from BLR growth rate (y.o.y. percentage change) | |
| 2010 | 18046.3 | 334 | – | 30.4 | 1 | 18046.3 | 334 | – |
| 2011 | 24652.3 | 758.9 | 127.2 | 29.4 | 1 | 23867.7 | 734.7 | 120 |
| 2012 | 27174.6 | 13828.9 | 1722.3 | 31.1 | 1 | 27807.8 | 14151.2 | 1826 |
| 2013 | 22446.9 | 14776 | 6.8 | 31.9 | 1 | 23542.1 | 15496.9 | 9.5 |
| 2014 | 20877.8 | 13190.3 | -10.7 | 38.5 | 1.3 | 26472.4 | 16724.9 | 7.9 |
| 2015 | 16168.8 | 8544.1 | -35.2 | 61.2 | 2 | 32576.2 | 17214.4 | 2.9 |
| 2016 | 14641 | 10534.7 | 23.3 | 67 | 2.2 | 32312.7 | 23250 | 35.1 |
| 2017 | 19181.2 | 13438.5 | 27.6 | 58.3 | 1.9 | 36836 | 25807.6 | 11 |
| 2018 | 22071 | 12836.5 | -4.5 | 62.8 | 2.1 | 45657 | 26554.1 | 2.9 |
| 2019 | 22172.4 | 14549 | 13.3 | 64.7 | 2.1 | 47179.7 | 30958.2 | 12.3 |
| Yearly average (2013-2019) | 19651.3 | 12552.7 | 2.9 | – | – | 34939.4 | 22286.6 | 21.0 |
Source: WITS UN Comtrade, EEC Statistics Department and author’s calculations.