_ Yuri Kofner, junior economist, MIWI – Institute for Market Integration and Economic Policy. Munich, 16 June 2020.
In 2015, five post-Soviet states – Armenia, Belarus, Kazakhstan, Kyrgyzstan, and Russia – founded the Eurasian Economic Union (EAEU) – a trade and economic bloc, similar to the European Union (EU), aimed at creating a common single market for the free movement of goods, services, peoples, capital and “digits”. In October 2019 the Agreement on Trade and Economic Cooperation between the People’s Republic of China (PRC) and the Eurasian Economic Union came into effect. The agreement aims at reducing non-tariff barriers (NTBs) in trade between the parties but does not stipulate a reduction in tariff duties. In the introduction, an overview of this agreement is given. In the second part of the paper, the dynamics and current structure of trade relations between the PRC and the EAEU are examined. In the third part, using a partial equilibrium model, the author estimates the effects of deeper trade and economic cooperation between China and the EAEU under three potential scenarios: 1. a free trade area (FTA); 2. a “deep” free trade area; and 3. the full realization of the current Agreement on Trade and Economic Cooperation between the PRC and the EAEU. The paper concludes with policy recommendations by the author.
Keywords: China, PRC, Eurasian Economic Union, EAEU, integrate, free trade agreement, FTA, non-tariff measures, NTB, Greater Eurasia, Belt and Road Initiative, BRI
JEL F15, F17, F13
Introduction
In 2015, five post-Soviet states – Armenia, Belarus, Kazakhstan, Kyrgyzstan and Russia – founded the Eurasian Economic Union (EAEU) – a trade and economic bloc, akin to the EU, aimed at creating a customs union and common single market for the free movement of goods, services, peoples, capital and “digits”, as well as a common (supranational) or coordinated (intergovernmental) economic policy in many areas (Table 1). In 2018, its GDP by purchasing power parity was USD 4.8 trillion (USD 1.8 trillion in current prices) with a population of 182 million (EEC 2019a). The main administrative and executive body of the EAEU is the Eurasian Economic Commission (EEC), which, on behalf of the member states, also has the right to conduct trade negotiations with third partners.
Table 1. Core powers of the EAEU
| Direct (supranational) | Indirect (intergovermental) |
| – Foreign trade policy
– Customs regulations – Technical regulations and standards – Intra-union transborder competition and antitrust law |
– Macroeconomic convergence
– Digital cooperation – Common energy, transport and capital markets – Industrial and agricultural policy |
Source: Compiled by the author.
Between 2015 and 2018, internal goods trading in the EAEU increased by more than 20%. Additionally, the Union instituted a modern customs code in 2018, introducing a number of innovations. An important technical basis for a potential future common internal market with the EU is in place; more than 4/5 of goods traded on the Union’s domestic market are subject to common product conformity requirements, which in large part also comply with European and international standards. There has also been good progress in creating common pharmaceutical, alcohol and tobacco markets. The necessary framework conditions for common electricity, oil, gas and capital markets are to be created by 2025. Although there has been good progress towards macroeconomic convergence between member countries, there are no plans to introduce a single currency, a direct lesson from the euro crisis. Advances in the EEC’s cross-border competition policy, as well as enabling the free movement of services, which is currently only 1/5 established, is impaired by limited supranational competency and political interference by some of the member states. The EAEU has been most successful in creating a common labor market in which member state citizens enjoy the same rights in terms of employment, freedom of movement and social security (Table 2) (Kofner 2019).
Table 2. Main achievements and prospects of the EAEU
| Success so far | Agenda until 2025 |
| – Customs union, including a modern customs code
– Common technical regulations and standards for 70% of the goods in circulation – Common labor market, including health care, education and pensions – Common market for 55% of all services – Common markets for pharmaceuticals and medical devices |
– Common electricity market
– Common oil and gas market – Common financial market – Common markets for tobacco products and alcoholic beverages – Digital agenda until 2025 (launched in 2016)
|
Source: Compiled by the author.
Strengthening trade and economic ties between China and the Eurasian Economic Union is one of the main foreign economic policy priorities of the EAEU and of its member states, particularly of Russia, which made up 87% of the union’s GDP. It is also very important for Beijing, which can be seen by the fact, that China was one of the first countries to build direct ties with the EEC at the end of 2012 (EEC 2018a).
The political crux in relations, the mutual sanctions and the decline in trade between Russia and the West in wake of the Ukrainian crisis made Russia and the other EAEU member states, which to a significant extent are economically dependent from Russian economic performance, look east in hopes of harnessing the spill-over effects of China’s rise as the globe’s new leading economy. In 2018 the PRC’s GDP by PPP reached USD 25.4 trln, which is 5.3 times larger than that of the EAEU (EEC 2019a).
Policy-makers of both sides consider stronger trade and economic cooperation between China and the EAEU to be an integral and complimentary part – both of China’s Belt and Road Initiative (BRI), proposed by the President of China Xi Jinping in a speech delivered at the Nazarbayev University during his visit to Kazakhstan in September 2013 (State Council 2015), – as well as of the “Greater Eurasian Partnership” concept on a comprehensive nexus of free trade areas, infrastructure projects and transport corridors on the wider Eurasian continent. It was co-proposed by the President of Russia Vladimir Putin and the then President of Kazakhstan Nursultan Nazarbayev at the Saint Petersburg Economic Forum in 2016 (SPIEF 2016).
In May 2015, President Xi and President Putin issued a “Joint statement by the Russian Federation and the People’s Republic of China on cooperation in the conjunction of the Eurasian Economic Union and the Silk Road Economic Belt”. During the event, they also announced the launch of negotiations on a China-EAEU trade agreement (Kremlin 2015).
In June 2019 President of China Xi Jinping and President of Russia Vladimir Putin signed the Joint “Statement on Developing Comprehensive Partnership and Strategic Interaction Entering a New Era”, which under point III states: “The Russian side supports the “Belt and Road” initiative. The Chinese side supports the promotion of integration processes as part of the Eurasian Economic Union. The parties will intensify concerted efforts to pair the formation of the EAEU and the BRI. The Chinese side supports the initiative to form a “Greater Eurasian Partnership”. The parties believe that the “Belt and Road” initiative and the idea of a Greater Eurasian Partnership can develop in parallel and coordinated, will contribute to the development of regional trade agreements, bilateral and multilateral integration processes for the benefit of the peoples of the Eurasian continent” (Kremlin 2019). This view is shared also by the expert communities of both sides (see Li 2019 and Bordachev et al. 2016).
Since 2013 and 2015 deeper trade and economic cooperation between China and the EAEU moved beyond pure joint declarations and has taken the conclusive form of binding international treaties. Thus, in May 2018, after five rounds of negotiations, three panel meetings and two ministerial conferences, the Chinese Ministry of Commerce and the Eurasian Economic Commission signed the “Agreement on Trade and Economic Cooperation between the People’s Republic of China and the Eurasian Economic Union” (MOFCOM 2018). It entered into force in October 2019 (MOFCOM 2019).
The agreement is “non-preferential” in nature, i.e. it is not a free trade agreement – its provisions do not provide for the reduction or elimination of import duties (tariffs). Its main aim is to decrease non-tariff barriers (NTBs) by mutually improving the transparency of regulatory systems, simplifying trade procedures, as well as developing industrial cooperation ties. The scope of the agreement includes customs cooperation, technical barriers to trade, sanitary and phytosanitary measures, trade remedies, electronic commerce, intellectual property, competition and public procurement, as well as industrial cooperation (Table 3).
The agreement can be seen as a building block of the BRI’s “soft infrastructure”, i.e. the liberalization of non-tariff measures in trade, which is no less important for the implementation of China’s Belt and Road Initiative, than its better known “hard infrastructure”, i.e. the existing and planned railway- and pipelines, roads, ports, optical fiber cables, etc.
Table 3. Content of the China-EAEU Trade and Economic Cooperation Agreement
| – General provisions, institutional provisions, final provisions;
– Transparency; – Trade remedies (including state subsidies); – Technical barriers to trade (technical regulations and standards); – Sanitary and phytosanitary measures; – Customs cooperation and trade facilitation; – Intellectual property rights; – Competition; – Public procurement; – Sectoral (i.e. industrial) cooperation; – E-commerce. |
Source: (EEC 2018b).
The provisions of the agreement conceptually cover two components: “here and now” and “groundwork for the future”. The provisions of the first component consolidate a wide range of legal guarantees, predictable conditions of access and circulation of goods on the markets by increasing the transparency of regulatory systems and simplifying trade procedures. The provisions of the second component relate to the development of cooperative sectoral cooperation between China and the EAEU.
As the main mechanism for reaching its principal goal of mutually reducing non-tariff barriers to trade, the agreement outlines a negotiation and cooperation platform in the form of a joint commission at the ministerial level, which includes representatives of the relevant authorities of China, the EEC and the EAEU member states, as well as from the business and expert communities of both parties. The tasks and powers of the joint commission include decisions on the above-mentioned cross-sectoral directions, e.g. technical regulations, trade remedies, customs regulation, etc. The parties may also establish subcommittees and working groups to address specific issues and sectoral cooperation. Thus, according to the logic of agreement, mutual trade liberalization should not be instantaneous, but should rather occur gradually, which allows the countries and businesses to better adapt to the new conditions.
On many points the agreement involves the application of WTO rules. This circumstance is important for several reasons. Firstly, it allows the Republic of Belarus, which is a member of the EAEU but is not a member of the WTO, to enjoy the same rights and guarantees provided by the WTO agreements along with all WTO members. Secondly, it once again underlines the desire of Beijing and of the EAEU member states to uphold the international multilateral trade system, which is inclusive in nature. This is especially vital against the backdrop of rising US protectionism and the desire of the United States to change this system in favor of exclusive and “managed” trade deals.
The incorporation of legal guarantees in the form of “regime” articles as part of the agreement creates the prerequisites for a further non-discriminatory trade regime, and also lays the foundation for concluding broader and deeper agreements in the future.
In a step which already be considered as the implementation of the above agreement’s provisions on customs cooperation, the PRC, the EEC and the EAEU member states in June 2019 signed an “Agreement on the exchange of information on goods and vehicles involved in international transportation across the customs border of the Eurasian Economic Union and the People’s Republic of China” (EEC 2019b). It is aimed at accelerating the customs clearance of goods and improving risk management of customs control; thus it should increase the transit attractiveness of the northern BRI route through the EAEU member states. Another welcome side-effect of this agreement is that it could help address the substantial discrepancies in customs data between China and the EAEU member states (more on this in part two of the paper).
Nevertheless, as of February 2020, too little time has passed since the entry into force of this agreement and, therefore, it is premature to judge its trade and economic effects at this point. Still, despite some successes, cooperation between China and the EAEU is currently below Beijing’s expectations. For example, as of February 2020, almost half (47.6%) of the EEC’s ongoing anti-dumping and safeguard duties were directed against Chinese exporters (EEC 2019c). In light of this, in April 2019, the Chinese ambassador to the Russian Federation called for moving beyond the “non-preferential agreement” (NPA) and to begin negotiations on creating a free trade area between the People’s Republic of China and the Eurasian Economic Union as soon as possible (TASS 2019a).
Concurrently, the EAEU members states are primarily interested in developing industrial, technological and digital cooperation with China. In June 2018 the first meeting between the industry minister of China and the Eurasian Economic Commission pursued precisely this end (EEC 2018c). In October 2019 the EEC announced that is has identified three main areas of interest in potential industrial cooperation between China and the EAEU: digitalization, localization of production capacities and research cooperation. It is worth highlighting that the EEC emphasized the importance of adopting the digital standards developed by China in its innovation sectors. (Belta 2019). In October 2019, as part of the agreement, there was also a meeting at the ministerial level between the Eurasian Economic Commission and the State Administration for Market Regulation of the PRC to discuss cooperation on technical regulations and standards, primarily to simplify market access of goods produced by the parties (EEC 2019d).
According to the Eurasian Economic Commission, enterprises and businesses of the member states are not yet ready to open their markets to the duty-free import of Chinese goods. There are concerns that the creation of a free trade area will deepen the asymmetric sectoral trade structure between the PRC and the EAEU, according to which the EAEU is a net importer of Chinese goods with high added value (electric and non-electric machinery, transport equipment, etc.) and a net exporter of raw materials (petroleum, metals, lumber, etc.), which ultimately could slow down the modernization agenda of the Union’s economies and make them excessively dependent on China‘s economic performance. In this regard, the EEС expressed the opinion that before moving on to discussing a potential free trade agreement, the parties should first realize the provisions on eliminating NTBs set out in the “non-preferential” agreement (NPA) on trade and economic cooperation, which already is in force (Sputnik 2019).
In the course of this debate, three questions arise: Firstly, what is the scale of potential trade and welfare effects of deeper trade and economic cooperation between the PRC and the EAEU? Secondly, will the creation of a potential free trade area bring more export and welfare benefits than the elimination of non-tariff barriers provided in the PRC-EAEU agreement on trade and economic cooperation, which has already entered into force? Thirdly, will trade liberalization really solidify, either as part of a (deep) FTA, or within the framework of the NPA, the asymmetry of the commodity structure in mutual trade between China and the EAEU? In order to answer these questions, in the third part of this paper we will estimate the trade and welfare effects of three potential scenarios: 1. creation of a free trade area with; 2. creation a “deep” free trade area; and 3. the full realization of the current agreement on trade and economic Cooperation between the PRC and the EAEU.
However, before that, in the second part of the paper we will examine the dynamics and current structure of trade relations between China and the Eurasian Economic Union.
Trade relations between China and the Eurasian Economic Union
Between 2012-2018 the dynamics of mutual trade between China and the EAEU were affected, inter alia, by two main factors: Firstly, the fall in global oil prices in 2015-2016 decreased EAEU petroleum exports to the PRC in nominal prices. Between 2014 and 2016 the annual average oil price (USD per barrel, Brent) dropped by 55.5% (World Bank 2019a). Secondly, by the economic recession in Russia and the other EAEU countries in 2013-2016 (Chart 1), which dulled domestic demand for Chinese consumer products. Between 2013 and 2016 Russia’s nominal GDP (USD in current prices) contracted by 44.1%. (World Bank 2019b). As soon as both factors improved again after 2016, so did trade flows between China and the EAEU.
Chart 1. ifo World Economic Survey Heatmap (2009-2019)a
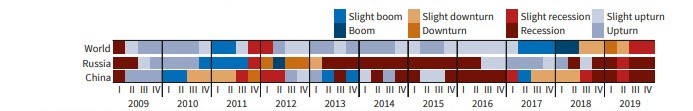

Source: (ifo 2019) aThe assessments of the current situation and economic expectations for the next six months are visualised by a four colour scheme that illustrates the four phases of a business cycle: boom, downturn, recession, upturn. The transition areas between these four phases are illustrated with lighter colours and are defined as follows: Slight boom when the current situation is smaller than +20. Slight downturn when expectations are between 0 and –20. Slight recession when the current situation is between 0 and –20. Slight upturn when expectations are smaller than +20.
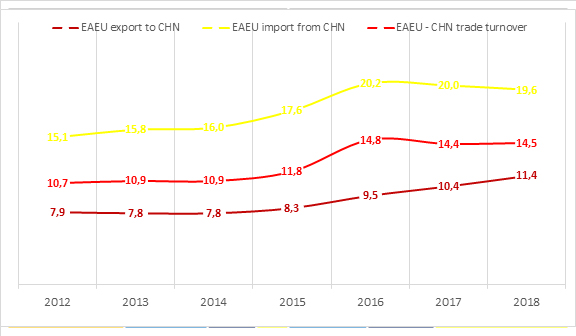
Thus, after increasing by 16% from USD 61.2 bln (in current prices) in 2012-2014, Chinese goods exports to the EAEU fell by 33.7% to USD 48.3 bln in 2014-2015. After 2016, they recovered again by 27% reaching USD 66.2 bln in 2018. Overall, exports from China to the EAEU increased by 7.6% during the study period. Eurasian exports to China declined by 32.2% from USD 59.6 bln in 2012 to USD 40.4 bln in 2015 but rose again by 40.9% to USD 68.4 bln in 2018. Overall exports from the EAEU to China grew by 12.9% during the reporting period. Between 2012 and 2018 the average annual volume of Chinese exports to the EAEU was USD 61.4 bln; that of Eurasian exports to the PRC – USD 52 bln. The average annual trade turnover was USD 113.4 bln. In 2018 it reached USD 134.6 bln (Table 4, Chart 2).
Chart 2. Dynamics of CHN – EAEU merchandise trade (2012-2018, in current USD bln)
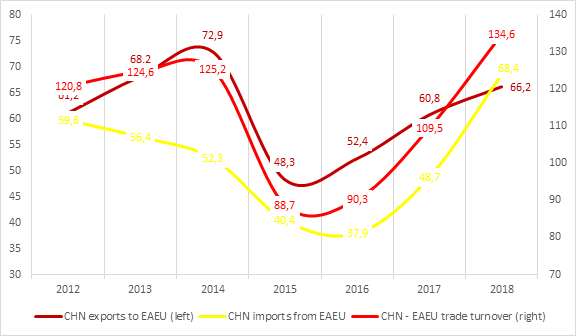

Source: WITS (UN COMTRADE) and author’s calculations.
The Eurasian Economic Union is only a minor trading partner for People’s Republic of China. During the study period it accounted for only ~3% of China’s foreign trade, both in exports, imports and turnover. The PRC most important trading partners are the United States, the EU, Japan and Korea (Tables 4 and 5, Charts 3 and 4).
Chart 3. Dynamics of EAEU share in China’s total merchandise export, import and trade turnover (2012-2018, % share of total)
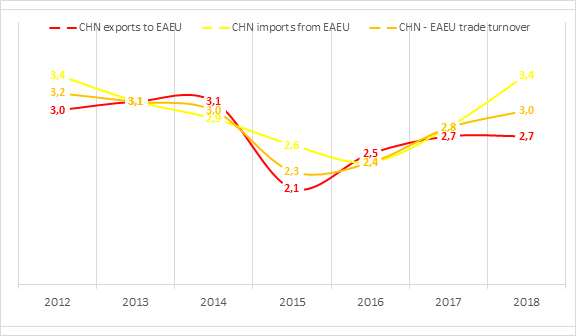

Source: WITS (UN COMTRADE) and author’s calculations
Chart 4. China’s geographic trade structure (2018, in % of total)
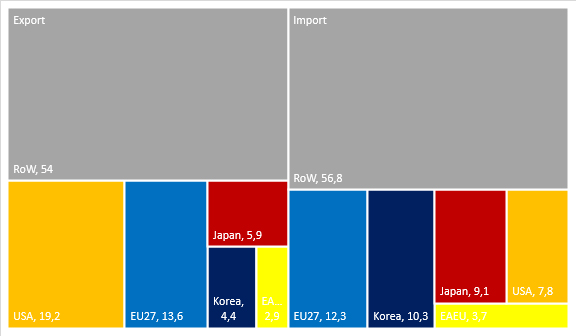

Source: WITS (UN COMTRADE) and author’s calculations.
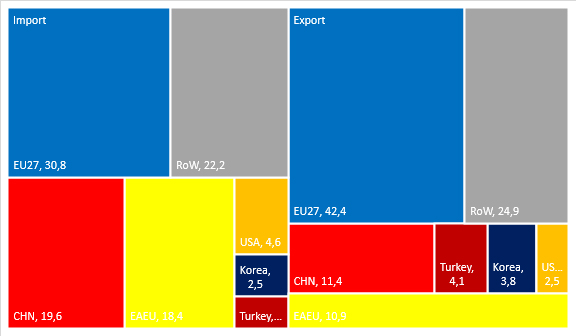
At the same time, China is the EAEU’s second most important trade partner after the European Union, even more important than intra-EAEU trade. Between 2012 and 2018 the PRC accounted for 9% of Eurasian exports, for 17.8% of imports to the EAEU, as well as for 12.6% of the Union’s total trade turnover. The PRC’s importance as a trade partner for the Eurasian Union increased steadily over the study period by 26.6% (Tables 4 and 5, Charts 5 and 6).
Chart 5. Dynamics of CHN share in total EAEU merchandise export, import and trade turnover (2011-2018, % share of total)

Source: WITS (UN COMTRADE) and author’s calculations.
Chart 6. The EAEU’s geographic trade structure (2018, in % of total)

Source: WITS (UN COMTRADE) and author’s calculations.
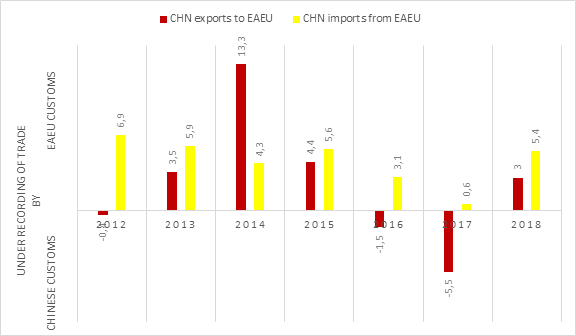
One distinct aspect of China-EAEU trade is that it is generally under-recorded by the customs agencies of the EAEU member states. During 2012-2018 the average annual under-recording of Chinese exports to the Eurasian Economic Union was USD 2.4 bln or USD 16.8 bln in total. Net under-recording of Eurasian exports to China was twice as large – USD 31.8 bln in total or USD 4.5 bln on average annually (Table 6, Chart 7). This indicates to towards a large volume of shadow trade which could reach up to 3.9% of exports from China to the EAEU and 8.7% vice versa.
Chart 7. Under-recording of China – EAEU merchandise trade (2012-2018, in USD bln)

Source: WITS (UN COMTRADE) and author’s calculations
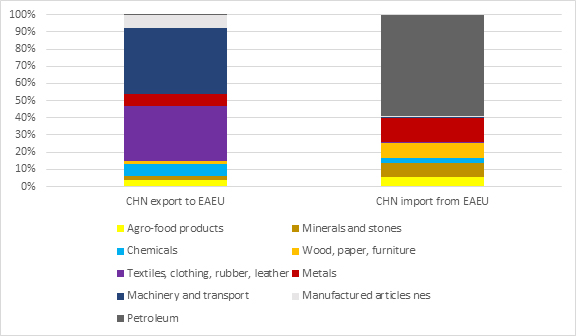
Another distinct aspect is that the commodity structure of China-EAEU trade is characterized by significant asymmetry and factor compatibility. Substantially, the countries of the Eurasian Economic Union provide the Chinese economy with basic energy carriers, raw materials and food products, while at the same time they buy from China more sophisticated goods, such as apparel, machines, electric appliances, transport vehicles and plastics (Table 7, Chart 8).
Chart 8. Commodity structure of mutual China-EAEU merchandise trade (2018, in % of total)

Source: WITS (MTN classification) and author’s calculations.
Non-electric machinery, electric machinery and transport equipment accounted for 38.5% (USD 25.4 bln) of China’s export sectors to the Eurasian Economic Union in 2018, as well as textiles, clothing, leather and footwear, which made up another 32.2% (USD 21.2). In particular, the main export items were smartphones, computers, monitors, shoes and coats (Table 8).
Table 8. Top-10 export sectors of China to the EAEU (2018)
| Nr. | MTN | Description | in USD bln | in % |
| 1 | 02 | Textiles & clothing | 13.2 | 20.0 |
| 2 | 07 | Non-electric machinery | 11.7 | 17.6 |
| 3 | 08 | Electric machinery | 10.4 | 15.8 |
| 4 | 03 | Leather, rubber, footwear & travel | 8.0 | 12.2 |
| 5 | 10 | Manufactured articles n,e,s, | 5.0 | 7.6 |
| 6 | 05 | Chemicals and photographic supplies | 4.6 | 7.0 |
| 7 | 04 | Metals | 4.5 | 6.9 |
| 8 | 06 | Transport equipment | 3.3 | 5.1 |
| 9 | 09 | Minerals products and precious ston | 1.5 | 2.3 |
| 10 | 12 | Fruit & vegetables | 1.4 | 2.1 |
Source: WITS (MTN classification) and author’s calculations.
On the contrary, 58.8% (USD 40.1 bln) of the EAEU’s export structure to China was made up of petroleum products, followed by metals, minerals and precious stones – 22.6% (USD 15.4 bln), wood products – 8.9% (USD 6.1 bln) as well as plant oils and seafood – 4.6% (USD 3.1 bln). In particular, the main export items were crude oil, lumber, coal, copper, uranium, iron, soybeans, sunflower oil, frozen fish and crustaceans, but also turbo engines (Table 9).
Table 9. Top-10 export sectors of EAEU to China (2018)
| Nr. | MTN | Description | in USD bln | in % |
| 1 | 97 | Petroleum | 40.1 | 58.8 |
| 2 | 04 | Metals | 9.6 | 14.1 |
| 3 | 01 | Wood, pulp, paper & furniture | 6.1 | 8.9 |
| 4 | 09 | Minerals products and precious stones | 5.8 | 8.5 |
| 5 | 11 | Fish and fish products | 2.2 | 3.3 |
| 6 | 05 | Chemicals and photographic supplies | 1.9 | 2.8 |
| 7 | 18 | Oilseeds, fats and oils | 0.9 | 1.3 |
| 8 | 10 | Manufactured articles n,e,s, | 0.3 | 0.5 |
| 9 | 03 | Leather, rubber, footwear & travel | 0.3 | 0.4 |
| 10 | 07 | Non-electric machinery | 0.2 | 0.4 |
Source: WITS (MTN classification) and author’s calculations.
Using the WTO’s Multilateral Trade Negotiation (MTN) product categories from the WITS database (Table 10), we can calculate the trade complementarity indices (TCIs) for China-EAEU commodity trade (Formula 1), which are rather substantial. In 2018 China’s exports abroad matched the EAEU’s foreign import structure by 72.8%, while the EAEU’s export composition matched the PRC’s import structure by 53.4%.
Formula 1. cij = 100 [1 – ∑mk=1 │mik – xjk│/ 2]
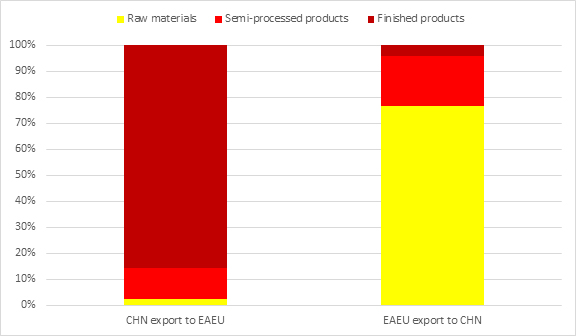
Finished products made up 85.8% of goods exported from China to the EAEU, semi-processed goods – 11.8% and raw materials only 2.4%. The picture is practically inverted for exports from the Eurasian Economic Union to China: raw materials accounted for 76.6% of goods shipped to China, whereas processed products only 4.3%. Nonetheless, semi-processed products still accounted for 19.1% of Eurasian goods sold in China (Table 11, Chart 9).
Chart 9. Level of processing of mutual exports between China and the EAEU (2018, % share of total)

Source: WITS (MTN classification) and author’s calculations.
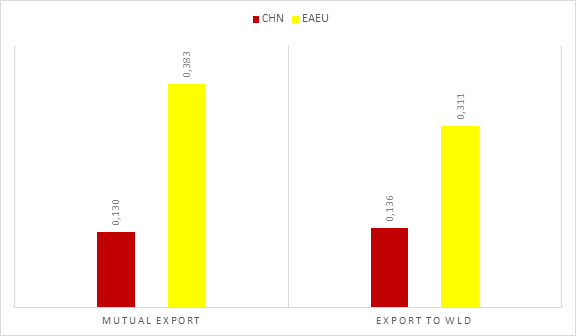
Chinese goods exports to the EAEU were also much more diversified, then vice versa. The Herfindahl-Hirschman index (HHI) (Formula 2) for the PRC’s commodity structure was 0.130, whereas that of the EAEU to China – 0.383 (Table 12, Chart 10). The HHI can range from 1 to 0. The lower the index, the higher the level of diversification.
Formula 2. hi = ∑k (sik)2
Chart 10. Export diversification of China and the EAEU (2018, HHI)

Source: WITS (MTN classification) and author’s calculations.
Effects of deeper trade and economic cooperation between China and the EAEU
The model
Using the “Global Simulation Analysis of Industry-Level Trade Policy” (GSIM) (for a detailed mathematical structure of the simulation model see Francois et al. 2002), the author estimated the potential trade and welfare effects of mutual trade policy liberalization between China and the EAEU.
The partial-equilibrium model estimates the effects of a trade policy change, e.g. the reduction of an import tariff, for a multi-country global market at an individual product or aggregated sector level by calculating a new global market clearing price, and, consequently, the percentage change of imports and exports (using import, export and substitution elasticities), as well as the country welfare effects, i.e. the new producer surplus, consumer surplus and tariff revenue change.
The simulation used in this paper is a 4×4 GSIM model with four parties: 1. China, 2. the EAEU, 3. the EU and 4. the rest of the world (RoW) and was repeated for each of the 24 aggregated MTN product sectors.
Three scenarios were defined: 1. the creation of a free trade area between China and the EAEU; 2. the creation a “deep” free trade area; 3. the “full” realization of the current agreement on trade and economic cooperation between the PRC and the EAEU. The first scenario was defined as a 100% mutual reduction in tariff duties, the second as a 100% mutual reduction in tariff duties and a 20% mutual reduction of NTBs, the third as a 20% mutual reduction of NTBs but with no mutual reduction in tariff duties. The purpose of specifying these scenarios was to answer three research questions: Firstly, what is the scale of potential trade and welfare effects of deeper trade and economic cooperation between the PRC and the EAEU? Secondly, will the creation of a potential free trade area bring more export and welfare benefits than the elimination of non-tariff barriers provided in the PRC-EAEU agreement on trade and economic cooperation, which has already entered into force? Thirdly, will trade liberalization really solidify, either as part of a (deep) FTA, or within the framework of the “non-preferential” agreement, the asymmetry of the commodity structure in mutual trade between China and the EAEU?
For the simulation in this paper the author used the following input data: 1. Bilateral trade data from 2018 for the four parties (China, EAEU, EU, RoW) aggregated for 24 MTN product sectors from the WITS (UN COMTRADE) database. For the bilateral trade flows CIF recorded imports were preferred.
2. Aggregated simple most favored nation (MFN) ad-valorem import tariffs from 2018 at the MTN product sector level from the World Trade Organization (WTO 2019) and the WITS (UNCTAD TRAINS) database (WITS 2020). Ad-valorem import tariffs for the EAEU were aggregated as the sum of the national sectoral tariffs of the five EAEU member states multiplied by their respective import share. The simple MFN applied tariff of China was 9.8% for all products, 15.6% for agricultural products and 8.8% for non-agricultural products, whereas the simple MFN applied tariff of the EAEU was somewhat lower – 6.8%, 11% and 6.1%, respectively (Table 13).
3. Ad-valorem equivalents of non-tariff measures (AVEs of NTMs) for each party and aggregated at the MTN product sector level. The AVEs of NTMs were taken as the sum of the ad-valorem equivalents of technical barriers to trade, sanitary and phytosanitary measures, and, if available, of price control, monopolistic measures and trade-facilitation barriers, e.g. time costs of trade due to bureaucratic customs procedures. The AVEs of NTMs for China were taken from (Niu 2018). The AVEs of NTMs for the EAEU were taken from (Knobel et al 2019) and aggregated as the sum of the national AVEs of NTMs of Belarus, Kazakhstan and Russia (together they make up 97.4% of the union’s imports from abroad) multiplied by their respective import share in the EAEU. The AVEs of NTMs for the EU were taken from (Berden et al 2015). The AVEs of NTMs for the rest of the world were taken from (Niu et al. 2018) (Table 14).
Over the past twenty-five years, beginning with the inception of the WTO in 1994, non-tariff barriers have out-passed import tariffs as the main instrument for national and regional trade protection. Between 1997 and 2015 the simple average ad valorem cost of tariffs on imports decreased from ~12% to ~5%, while at the same time the simple average ad valorem costs of NTMs increased from ~20% to ~57% (Niu et al. 2018). For this reason, including a quantification of non-tariff measures becomes vital for a more comprehensive and credible assessment of trade policy changes, e.g. as part of regional trade agreements (RTAs). As point of fact, non-tariff barriers represent significant benchmark distortions in mutual China-EAEU trade: the simple average ad valorem equivalents of China’s NTMs was 85.8%, whereas that of the EAEU towards China “only” 45%. The 20% mutual AVE of NTM reduction, as specified in scenarios two and three, was chosen by the author as an ambitious, yet not unrealistic liberalization and harmonization agenda of non-tariff measures between China and the EAEU.
4. Import elasticities, divided in two aggregated sectors for agricultural products and non-agricultural products, were taken from (Ghodsi et al. 2016). The import elasticities for the EAEU and the EU were calculated as the sums of the national elasticities of the member states multiplied by their import shares in the respective regional trading blocs (Table 15). The export supply (1.5) and substitution (5) elasticities were taken as constants across all sectors and regions.
In comparison with general equilibrium simulations, the known limitations of partial-equilibrium analysis are that they do not capture economy wide linkages, budget constraints, as well as long-term effects, and are can be very sensitive to the values used for the elasticities, for which the empirical literature is still limited.
The results
Results of the partial-equilibrium analysis show: Firstly, that any format of mutual trade liberalization and stronger economic cooperation would provide substantial trade and welfare effects for both China and the EAEU, especially since all effects are annual, i.e. they are repeated every year. Secondly, that these effects are more pronounced for the Eurasian Economic Union. Thirdly, that a “deep” FTA would provide the highest trade and welfare effects. And that, inter alia, the realization of the current China-EAEU agreement on trade and economic cooperation, interpreted as a mutual 20% cut of non-tariff barriers, would increase mutual trade and welfare benefits more, than a “plain” free trade area. Finally, trade liberalization between China and the EAEU could indeed increase the asymmetry in the current commodity structure of mutual trade.
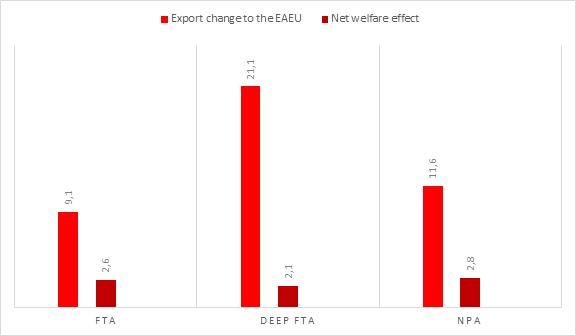
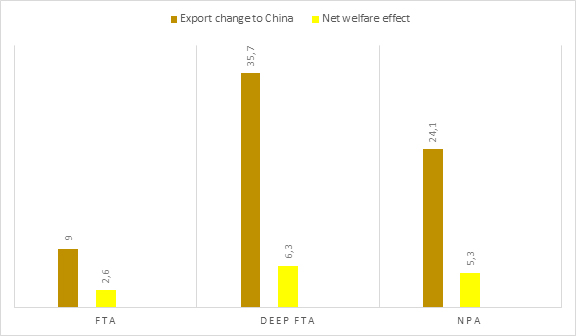
The creation of a free trade area between the parties would increase total Chinese exports to the Eurasian single domestic market by 13.8% (USD 9.1 bln) or by 0.1% in terms of the PRC’s GDP in current prices and increase Eurasian exports to the Chinese market by 13.2% (USD 9 bln) or by 0.5% of the EAEU’s GDP. The net welfare effect (producer surplus + consumer surplus – forgone tariff revenue) of an FTA for China and the EAEU would be both USD 2.6 bln each or 0.02% or 0.1% of their GDP, respectively (Tables 16 and 17).
A deep free trade area would increase total exports from the PRC to the EAEU by 31.8% (USD 21.1 bln) or by 0.2% in terms of China’s GDP and expand the EAEU’s exports to the People’s Republic of China by 52.4% (USD 35.7 bln) or by almost 2% of the union’s gross domestic product. The net welfare effect of a deep FTA for the PRC would be a little lower, than of the plain FTA – USD 2.1 (also 0.02% of GDP), since slashing the relatively high AVEs of NTMs is interpreted by the model as an equivalently high decrease in “tariff” revenues. The gross welfare effect (producer surplus + consumer surplus, but without subtracting the “tariff” loss) for China would thus be much higher: USD 19.4 bln or 0.14% of the country’s gross domestic product. For the EAEU the net welfare effect of the deep free trade agreement would be 6.3 bln or 0.3% of GDP, the gross welfare gain would be USD 13.1 bln or 0.7% of GDP (Tables 18 and 19).
Implementation of the existing “non-preferential” agreement on trade and economic cooperation in terms of a 20% reduction of mutual NTBs would increase Chinese exports to the Eurasian Economic Union by 17.6% (USD 12 bln) or by 0.1% in terms of the PRC’s GDP in current prices and increase Eurasian exports to China by 35.3% (USD 26 bln) or by 1.3% of the EAEU’s GDP. China’s net welfare gain from implementing the current agreement would be USD 2.9 bln or 0.02% of the country’s GDP, its gross welfare bonus – USD 14 bln or 0.1% of GDP. The net welfare effect for the Eurasian Economic Union would be USD 5.7 bln (0.3% of GPD), the gross welfare effect – USD 8.9 bln (0.4% of GDP) (Tables 20 and 21).
Thus, the effective implementation of the existing NPA on trade and economic cooperation would lead to a more significant increase in mutual trade and prosperity in China and the EAEU than a free trade area between them. All the while, a deep China-EAEU free trade area, which would provide for a reduction in both tariffs and non-tariff barriers, would bring the greatest trade and welfare gains (Charts 11 and 12).
Chart 11. Trade and welfare effects for China of a potential FTA, deep FTA and realization of the current NPA with the EAEU (in USD bln)

Source: Estimations by the author.
Chart 12. Trade and welfare effects for the EAEU of a potential FTA, deep FTA and realization of the current NPA with China (in USD bln)

Source: Estimations by the author.
From deepening trade and economic cooperation, China’s exports to the EAEU would increase most in total value terms in the following product sectors: electric machinery; textiles & clothing; metals; chemicals; non-electric machinery; manufactured articles n.e.s.; transport equipment; leather, rubber, footware, travel; minerals and precious stones; wood, pulp, paper & furniture. Exports of the EAEU towards China in total value terms would increase the most in: petroleum; metals; minerals and precious stones; wood, pulp, paper & furniture; fish and fish products; chemicals; oilseeds, fats and oils; manufactured articles n.e.s.; leather, rubber, footware, travel. Approximately in the same sectors and in the same order the corresponding producer and consumer surpluses would line up for China and the EAEU, respectively. Increased competition due to mutual trade liberalization could lead to a producer loss for China in: chemicals (FTA only), petroleum and dairy products. The producer loss for the Eurasian Economic Union could be more comprehensive and affect the following sectors: electric and non-electric machinery, textiles & clothing; transport equipment; fruit and vegetables; sugars and tobacco (Tables 22 and 23, Charts 13 and 14). This observation confirms the hypothesis that trade liberalization would increase the asymmetry of the commodity structure in mutual trade between China and the EAEU. In fairness, it should be noted that the Eurasian Economic Union would still incur substantial surpluses in the production of chemicals and manufactured articles n.e.s., which both are sophisticated industries with considerable value addition.
Chart 13. Sectoral export increases from China to the EAEU of a potential FTA, deep FTA and realization of the current NPA the EAEU (in USD mln)
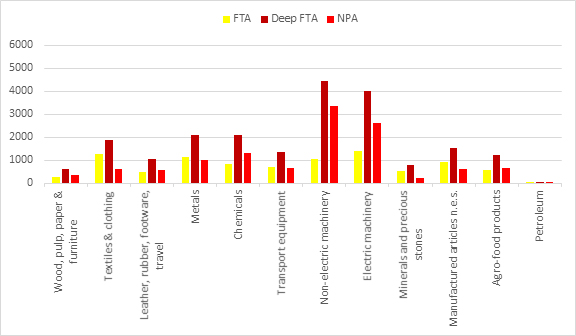

Source: Estimations by the author.
Chart 14. Sectoral export increases from China to the EAEU of a potential FTA, deep FTA and realization of the current NPA the EAEU (in USD mln)
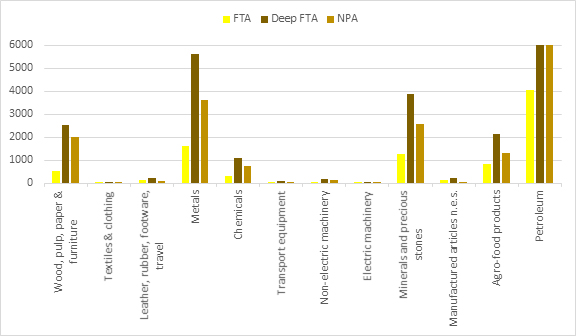

Source: Estimations by the author.
Table 22. China: Top-10 sectors with the greatest trade and welfare effect from deeper trade and economic cooperation with the EAEU (in absolute values, in order of magnitude)
| Positive export change | Producer surplus | Consumer surplus | Producer loss | |
| FTA | 1. Electric machinery
2. Textiles & clothing 3. Metals 4. Non-electric machinery 5. Manufactured articles n.e.s. 6. Chemicals 7. Transport equipment 8. Minerals and precious stones 9. Leather, rubber, footware, travel 10. Wood, pulp, paper & furniture |
1. Metals
2. Electric machinery 3. Textiles & clothing 4. Non-electric machinery 5. Manufactured articles n.e.s. 6. Transport equipment 7. Leather, rubber, footware, travel 8. Minerals and precious stones 9. Wood, pulp, paper & furniture 10. Fruit and vegetables |
1. Petroleum
2. Metals 3. Minerals and precious stones 4. Wood, pulp, paper & furniture 5. Fish and fish products 6. Oilseeds, fats and oils 7. Chemicals 8. Manufactured articles n.e.s. 9. Leather, rubber, footware, travel 10. Grains |
1. Chemicals
2. Petroleum 3. Dairy products |
| Deep FTA | 1. Non-electric machinery
2. Electric machinery 3. Chemicals 4. Metals 5. Textiles & clothing 6. Manufactured articles n.e.s. 7. Transport equipment 8. Leather, rubber, footware, travel 9. Minerals and precious stones 10. Wood, pulp, paper & furniture |
1. Non-electric machinery
2. Electric machinery 3. Textiles & clothing 4. Manufactured articles n.e.s. 5. Transport equipment 6. Leather, rubber, footware, travel 7. Metals 8. Minerals and precious stones 9. Chemicals 10. Fruit and vegetables |
1. Petroleum
2. Metals 3. Minerals and precious stones 4. Wood, pulp, paper & furniture 5. Fish and fish products 6. Chemicals 7. Oilseeds, fats and oils 8. Non-electric machinery 9. Leather, rubber, footware, travel 10. Manufactured articles n.e.s. |
1. Petroleum
2. Dairy products |
| “Non-preferential“ agreement (NPA) | 1. Non-electric machinery
2. Electric machinery 3. Chemicals 4. Metals 5. Transport equipment 6. Textiles & clothing 7. Manufactured articles n.e.s. 8. Leather, rubber, footware, travel 9. Fruit and vegetables 10. Wood, pulp, paper & furniture |
1. Non-electric machinery
2. Electric machinery 3. Chemicals 4. Metals 5. Leather, rubber, footware, travel 6. Transport equipment 7. Textiles & clothing 8. Manufactured articles n.e.s. 9. Fruit and vegetables 10. Wood, pulp, paper & furniture |
1. Petroleum
2. Metals 3. Minerals and precious stones 4. Wood, pulp, paper & furniture 5. Fish and fish products 6. Chemicals 7. Oilseeds, fats and oils 8. Non-electric machinery 9. Electric machinery 10. Leather, rubber, footware, travel |
1. Petroleum
2. Dairy products |
Source: Estimations by the author.
Table 23. EAEU: Top-10 sectors with the greatest trade and welfare effect from deeper trade and economic cooperation with China (in absolute values, in order of magnitude)
| Positive export change | Producer surplus | Consumer surplus | Producer loss | |
| FTA | 1. Petroleum
2. Metals 3. Minerals and precious stones 4. Wood, pulp, paper & furniture 5. Fish and fish products 6. Chemicals 7. Oilseeds, fats and oils 8. Manufactured articles n.e.s. 9. Leather, rubber, footware, travel 10. Grains |
1. Petroleum
2. Metals 3. Minerals and precious stones 4. Chemicals 5. Wood, pulp, paper & furniture 6. Fish and fish products 7. Oilseeds, fats and oils 8. Grains 9. Leather, rubber, footware, travel 10. Manufactured articles n.e.s. |
1. Electric machinery
2. Textiles & clothing 3. Non-electric machinery 4. Manufactured articles n.e.s. 5. Metals 6. Transport equipment 7. Chemicals 8. Leather, rubber, footware, travel 9. Minerals and precious stones 10. Fruit and vegetables |
1. Textiles & clothing
2. Electric machinery 3. Transport equipment 4. Non-electric machinery 5. Fruit and vegetable 6. Sugars 7. Tobacco |
| Deep FTA | 1. Petroleum
2. Metals 3. Minerals and precious stones 4. Wood, pulp, paper & furniture 5. Fish and fish products 6. Chemicals 7. Oilseeds, fats and oils 8. Leather, rubber, footware, travel 9. Manufactured articles n.e.s. 10. Non-electric machinery |
1. Petroleum
2. Minerals and precious stones 3. Wood, pulp, paper & furniture 4. Metals 5. Fish and fish products 6. Oilseeds, fats and oils 7. Chemicals 8. Grains 9. Leather, rubber, footware, travel 10. Dairy products |
1. Electric machinery
2. Non-electric machinery 3. Textiles & clothing 4. Chemicals 5. Metals 6. Manufactured articles n.e.s. 7. Transport equipment 8. Leather, rubber, footware, travel 9. Fruit and vegetables 10. Minerals and precious stones |
1. Electric machinery
2. Textiles & clothing 3. Non-electric machinery 4. Transport equipment 5. Fruit and vegetable 6. Sugars 7. Tobacco |
| “Non-preferential” agreement (NPA) | 1. Petroleum
2. Metals 3. Minerals and precious stones 4. Wood, pulp, paper & furniture 5. Chemicals 6. Fish and fish products 7. Oilseeds, fats and oils 8. Non-electric machinery 9. Leather, rubber, footware, travel 10. Manufactured articles n.e.s. |
1. Petroleum
2. Metals 3. Minerals and precious stones 4. Wood, pulp, paper & furniture 5. Fish and fish products 6. Chemicals 7. Oilseeds, fats and oils 8. Grains 9. Dairy products 10. Other agricultural products |
1. Non-electric machinery
2. Electric machinery 3. Chemicals 4. Metals 5. Textiles & clothing 6. Leather, rubber, footware, travel 7. Transport equipment 8. Manufactured articles n.e.s. 9. Fruit and vegetables 10. Wood, pulp, paper & furniture |
1. Electric machinery
2. Non-electric machinery 3. Textiles & clothing 4. Transport equipment 5. Fruit and vegetables 6. Sugars |
Source: Estimations by the author.
Policy recommendations
It seems to make sense to first concentrate on the implementation of the “non-preferential” agreement on trade and economic cooperation already in effect between China and the EAEU, before moving on to concluding a free trade agreement, since, as the model has shown, the former’s trade and welfare effects, by reducing mutual non-tariff barriers to trade, are substantially higher, than that of the latter: an increase in mutual trade of USD 38 bln and combined economic wealth of between USD 8.6 and USD 22.9 bln in case of the NPA as compared to USD 18.1 bln and USD 5.2 bln from an FTA.
Of course, in the mid-to-long run it would make sense to add a free trade agreement on top of the existing non-preferential agreement, since a deep FTA, implying the reduction of both NTBs and import duties, would provide the most substantial trade and welfare gains to China and the EAEU: an increase of mutual trade of USD 56.8 bln and of combined economic wealth of between USD 8.4 bln and USD 32.5 bln.
In any case, the actual effects of further trade liberalization would depend most of all on both parties’ preparedness and efforts to mutually lower non-tariff barriers to trade. Thus, as part of their existing agreement on trade and economic cooperation, the joint commission outlined therein should devise and implement concrete road maps on the step-by-step harmonization and reduction of NTMs – both cross-sectoral and in selected sectors. The greatest attention should be given, inter alia, to TBTs, SPS measures, customs procedures, state subsidies and trade remedies. The joint commission could be tasked with issuing an annual progress report on this matter. Real progress along these roadmaps, i.e. on the harmonization and reduction of non-tariff measures, could become a condition for moving forward with a free trade agreement.
However, there are two institutional drawbacks with the current “non-preferential” agreement that would need to be addressed. Firstly, the NPA currently neither imposes the parties with strict obligations, nor with sanctions for their failure to comply. Without them there is no guarantee and no “negative” incentive for the parties to make progress on mutually eliminating NTBs. Therefore, it would be worth making the appropriate amendments to the existing agreement. However, the implementation of such a step seems unlikely, since even the Eurasian Economic Union itself, unlike the EU, does not have such a mechanism. Secondly, the NPA lacks a well-defined rules-based dispute settlement system. It only stipulates that “any disputes shall be settled by the parties via consultations in order to reach a mutually acceptable solution” (EEC 2018b), which raises the risk of a deadlock when any significant dispute arises. Therefore, a distinct judicial body should be given the authority to give judgement on any potential trade dispute.
As already said, the final effectiveness of the “non-preferential” agreement depends on both parties’ ability to mutually cut NTBs, e.g. by 20% as suggested in our scenario. Therefore, taking into account the political, technical and financial difficulties of lowering non-tariff barriers to trade, it might all the while be easier and more straightforward to implement a traditional free trade agreement between China and the EAEU, even before real progress is made along the current NPA. Although the trade and welfare effects of zeroing import duties would be lower than that of the NPA or a deep FTA, they at least would be felt immediately.
Due to the producer losses that both parties could incur in various industries, China and the EAEU member states should stipulate phasing-in periods and exemptions for the (gradual) reducing of non-tariff and tariff barriers based on the sensitivity and relevance of each sector.
Another, if not problem, but issue is the fact that Belarus is not yet a member of the World Trade Organization. Although Minsk is moving ever closer towards accession to the WTO, it is not clear how soon this will in fact happen, especially since the international community is waiting for an end of the paralysis of the WTO Appellate Body and is contemplating a reform of the organization. Moreover, as observed above, the NPA already involves the application of WTO rights and guarantees for all agreement parties, including Belarus.
A real obstacle for deepening trade and economic relations between China and the EAEU could become the implementation of the highly asymmetric Economic and Trade Agreement (ETA), also called the “Phase-1 Deal” between the United States and China, which entered into force February 2020. The ETA sets out specific targets for increased Chinese imports of US goods and services, amounting to USD 200 bln over 2020 and 2021. These purchase commitments contradict the multilateral trading system and can generate substantial trade diversion effects and market share shifts for the PRC’s other trading partners. Due to this agreement, by 2021 China’s imports from the Russian Federation alone could be USD 3.1 bln less than without it (Chowdhry et al. 2020).
As already said, the above made estimations confirm the concerns that further mutual China-EAEU trade liberalization would adversely intensify asymmetry of the commodity structure in their mutual trade, according to which the EAEU would increase its role as a net importer of Chinese goods with high added value (electric and non-electric machinery, transport equipment, etc.) and as a net exporter of raw materials (petroleum, metals, lumber, etc.), which ultimately could slow down the modernization agenda of the Union’s economies and make them excessively dependent on China‘s economic performance. However, this is only one side of the argument. Another hypothesis is that lower production costs could encourage Chinese companies, operating under an implemented NPA or a potential (deep) FTA, to move part of their production capacities to or to create new ones in the EAEU with the intent of re-exporting their output back to China, to Europe or to other regions in the wider Eurasian space. There are at least two main factors that might support this line of argumentation: Firstly, industrial labor costs in the EAEU member states are actually lower than in China. In 2018 average labor costs in manufacturing measured as USD per employee per hour worked were USD 8.3 in the PRC and only USD 5.8 USD in the Russian Federation. Only Malaysia and the Philippines had lower labor costs in manufacturing – USD 2.8 and USD 2 respectively (Schroeder 2019). Secondly the average electricity prices for businesses are lower in the EAEU member states than in China. E.g., in June 2019 the were USD 0.09 per kWh in Russia, USD 0.07 in Armenia and USD 0.05 in Kazakhstan as compared to 0.10 in China (GPP 2020). Experience of the EU’s enlargement in Eastern Europe has shown that regional trade agreements can stimulate the creation and extension of up- and downstream value chains from core to periphery economies (Krzywdzinski 2014). Testing this hypothesis vis-a-vis PRC-EAEU trade liberalization could be the subject of another study, e.g. using a gravity model.
In this regard, China and the EAEU member states could undertake practical steps towards deeper sectoral (industrial) cooperation as outlined in the “non-preferential” agreement. Here the joint commission should be given the task to devise a road map on industrial cooperation and create a corresponding data bank of priority projects (EEC 2018b), e.g. in the form of an open digital interactive map. And again, the joint commission should be asked to prepare an annual progress report on this issue.
Since the current non-preferential and potential (deep) free trade agreements analyzed in this paper covers only the free movement of goods, it would be advisable for the parties to consider implementing additional agreements on the free movement of capital (foreign direct investment), services and the free flow of digital data (i.e. on digital cooperation), especially since the latter two are becoming ever more important for added value creation in global value chains (GVCs) (Kofner 2020). However, since the EEC does not have the authority to conduct negotiations in these key areas, Beijing and the EAEU member states could add “vertical” bilateral agreements (e.g. China-Armenia, China-Belarus, China-Kazakhstan, etc.) on FDI, services and digital cooperation under the “horizontal” framework of the existing multilateral “non-preferential” China-EAEU agreement. The EEC and the union member states already can show their first experience in this field: in October 2019 they inked a free trade agreement together with a ”Framework Agreement on Comprehensive Economic Cooperation” (EEC 2019e) with the Republic of Singapore under which Armenia and Singapore singed a bilateral “Agreement on Trade in Services and Investment” (UNCTAD 2019). Currently, China is waiting for the start of negotiations on a similar bilateral agreement with Russia (TASS 2019b).
Annex
Table 4. China – EAEU merchandise trade (2012-2018)
| in USD bln (current) | in % of CHN exports, imports, trade turnover | in % of EAEU exports, imports, trade turnover | |||||||
| CHN export to EAEU | CHN import from EAEU | CHN-EAEU total turnover | CHN export to EAEU | CHN import from EAEU | CHN-EAEU total turnover | EAEU export to CHN | EAEU import from CHN | CHN-EAEU total turnover | |
| 2012 | 61.2 | 59.6 | 120.8 | 3.0 | 3.6 | 3.2 | 7.9 | 15.1 | 10.7 |
| 2013 | 68.2 | 56.4 | 124.6 | 3.1 | 3.1 | 3.1 | 7.8 | 15.8 | 10.9 |
| 2014 | 72.9 | 52.3 | 125.2 | 3.1 | 2.9 | 3.0 | 7.8 | 16.0 | 10.9 |
| 2015 | 48.3 | 40.4 | 88.7 | 2.1 | 2.6 | 2.3 | 8.3 | 17.6 | 11.8 |
| 2016 | 52.4 | 37.9 | 90.3 | 2.5 | 2.4 | 2.4 | 9.5 | 20.2 | 14.8 |
| 2017 | 60.8 | 48.7 | 109.5 | 2.7 | 2.8 | 2.8 | 10.4 | 20.0 | 14.4 |
| 2018 | 66.2 | 68.4 | 134.6 | 2.7 | 3.4 | 3.0 | 11.4 | 19.6 | 14.5 |
Source: WITS (UN COMTRADE) and author’s calculations.
Table 5. Geographic trade structure of China and the EAEU (2018, in % of total)
| CHN | EAEU | |||
| Export | Import | Export | Import | |
| CHN | – | – | 11.4 | 19.6 |
| EAEU | 2.9 | 3.7 | 10.9 | 18.4 |
| USA | 19.2 | 7.8 | 2.5 | 4.6 |
| EU27 | 13.6 | 12.3 | 42.4 | 30.8 |
| Turkey | – | – | 4.1 | 1.9 |
| Korea | 4.4 | 10.3 | 3.8 | 2.5 |
| Japan | 5.9 | 9.1 | – | – |
| RoW | 54.0 | 56.8 | 24.9 | 22.2 |
Source: WITS (UN COMTRADE) and author’s calculations.
Table 6. Under-recording of China – EAEU merchandise trade (2012-2018, in USD bln)
| EAEU import from CHN | CHN exports to EAEU | Difference | EAEU export to CHN | CHN imports from EAEU | Difference | |
| 2012 | 61.6 | 61.2 | -0.4 | 52.7 | 59.6 | 6.9 |
| 2013 | 64.7 | 68.2 | 3.5 | 50.5 | 56.4 | 5.9 |
| 2014 | 59.6 | 72.9 | 13.3 | 48.0 | 52.3 | 4.3 |
| 2015 | 44.0 | 48.3 | 4.4 | 34.8 | 40.4 | 5.6 |
| 2016 | 53.9 | 52.4 | -1.5 | 34.7 | 37.9 | 3.1 |
| 2017 | 66.3 | 60.8 | -5.5 | 48.0 | 48.7 | 0.6 |
| 2018 | 63.2 | 66.2 | 3.0 | 63.0 | 68.4 | 5.4 |
Source: WITS (UN COMTRADE) and author’s calculations.
Table 7. Commodity structure of mutual China-EAEU merchandise trade (2018, in % of total)
| CHN | EAEU | ||||
| MTN | Description | Export to EAEU | Import from EAEU | Export to CHN | Import from CHN |
| 01 | Wood, pulp, paper & furniture | 1.5 | 8.9 | 7.8 | 1.9 |
| 02 | Textiles & clothing | 20.0 | 0.0 | 0.1 | 9.7 |
| 03 | Leather, rubber, footwear & travel | 12.2 | 0.4 | 0.4 | 5.3 |
| 04 | Metals | 6.9 | 14.1 | 10.0 | 8.0 |
| 05 | Chemicals and photographic supplies | 7.0 | 2.8 | 2.3 | 8.7 |
| 06 | Transport equipment | 5.1 | 0.2 | 0.3 | 4.3 |
| 07 | Non-electric machinery | 17.6 | 0.4 | 2.5 | 24.7 |
| 08 | Electric machinery | 15.8 | 0.1 | 0.1 | 23.9 |
| 09 | Minerals products and precious ston | 2.3 | 8.5 | 7.3 | 2.5 |
| 10 | Manufactured articles n,e,s, | 7.6 | 0.5 | 0.6 | 7.4 |
| 11 | Fish and fish products | 0.8 | 3.3 | 2.5 | 0.6 |
| 12 | Fruit & vegetables | 2.1 | 0.0 | 0.0 | 1.9 |
| 13 | Coffee, tea, mate, & cocoa | 0.1 | 0.1 | 0.2 | 0.1 |
| 14 | Sugars | 0.1 | 0.0 | 0.0 | 0.1 |
| 15 | Spices,cereal and other food prepar | 0.2 | 0.1 | 0.1 | 0.2 |
| 16 | Grains | 0.0 | 0.2 | 0.2 | 0.0 |
| 17 | Animals and products thereof | 0.0 | 0.0 | 0.0 | 0.0 |
| 18 | Oilseeds, fats and oils | 0.0 | 1.3 | 1.3 | 0.1 |
| 19 | Flowers,plants,vegetable materials, | 0.1 | 0.0 | 0.0 | 0.1 |
| 20 | Beverages & spirits | 0.1 | 0.1 | 0.1 | 0.1 |
| 21 | Dairy products | 0.0 | 0.1 | 0.1 | 0.0 |
| 22 | Tobacco | 0.0 | 0.0 | 0.0 | 0.1 |
| 23 | Other agricultural products | 0.3 | 0.1 | 0.1 | 0.3 |
| 97 | Petroleum | 0.3 | 58.8 | 63.9 | 0.0 |
| Total Trade | 100.0 | 100.0 | 100.0 | 100.0 | |
Source: WITS (MTN classification) and author’s calculations.
Table 10. Commodity structure of total foreign merchandise trade of China and the EAEU with third parties (2018, in % of total)
| CHN | EAEU | ||||
| MTN | Description | Export | Import | Export | Import |
| 01 | Wood, pulp, paper & furniture | 3.9 | 3.1 | 3.5 | 2.9 |
| 02 | Textiles & clothing | 12.5 | 1.4 | 0.6 | 5.3 |
| 03 | Leather, rubber, footwear & travel | 3.1 | 1.3 | 0.9 | 3.2 |
| 04 | Metals | 7.3 | 12.3 | 12.6 | 8.8 |
| 05 | Chemicals and photographic supplies | 8.2 | 11.2 | 3.9 | 15.0 |
| 06 | Transport equipment | 4.7 | 5.8 | 2.0 | 11.7 |
| 07 | Non-electric machinery | 21.1 | 10.0 | 2.3 | 17.6 |
| 08 | Electric machinery | 22.5 | 20.3 | 1.2 | 10.7 |
| 09 | Minerals products and precious stones | 3.6 | 8.8 | 12.8 | 4.2 |
| 10 | Manufactured articles n,e,s, | 8.4 | 5.5 | 0.9 | 4.7 |
| 11 | Fish and fish products | 0.9 | 0.7 | 1.0 | 0.9 |
| 12 | Fruit & vegetables | 0.9 | 0.6 | 0.3 | 3.1 |
| 13 | Coffee, tea, mate, & cocoa | 0.1 | 0.1 | 0.2 | 1.1 |
| 14 | Sugars | 0.1 | 0.1 | 0.1 | 0.3 |
| 15 | Spices,cereal and other food prepar | 0.3 | 0.6 | 0.5 | 1.1 |
| 16 | Grains | 0.0 | 0.3 | 2.4 | 0.2 |
| 17 | Animals and products thereof | 0.1 | 0.6 | 0.3 | 1.0 |
| 18 | Oilseeds, fats and oils | 0.1 | 2.7 | 1.0 | 1.4 |
| 19 | Flowers,plants,vegetable materials, | 0.1 | 0.0 | 0.0 | 0.4 |
| 20 | Beverages & spirits | 0.1 | 0.3 | 0.2 | 1.2 |
| 21 | Dairy products | 0.0 | 0.3 | 0.5 | 0.8 |
| 22 | Tobacco | 0.1 | 0.1 | 0.2 | 0.4 |
| 23 | Other agricultural products | 0.3 | 0.7 | 0.2 | 0.7 |
| 97 | Petroleum | 1.5 | 13.2 | 52.3 | 3.5 |
| Total Trade | 100.0 | 100.0 | 100.0 | 100.0 | |
Source: WITS (MTN classification) and author’s calculations.
Table 11. Level of processing share of China-EAEU merchandise trade (2018, in %)
| Raw materials | Semi-processed | Processed | |
| CHN export to EAEU | 2.4 | 11.8 | 85.8 |
| EAEU export to CHN | 76.6 | 19.1 | 4.3 |
Source: WITS (MTN classification) and author’s calculations.
Table 12. Export diversification of China and the EAEU (2018, HHI)
| CHN export to EAEU | CHN export to WLD | EAEU export to CHN | EAU export to WLD | |
| HHI | 0.130 | 0.136 | 0.383 | 0.311 |
Source: WITS (MTN classification) and author’s calculations.
Table 13. Simple average MFN applied tariff of China, the EAEU, the EU and the World (2018, MTN classification, in ad valorem %)
| MTN | Description | CHN | EAEU | EU | WLD | |
| 1 | Wood, pulp, paper & furniture | 4.1 | 7.9 | 0.9 | 8.9 | |
| 2 | Textiles & clothing | 16 | 7.8 | 11.5 | 17.9 | |
| 3 | Leather, rubber, footwear & travel | 13.2 | 5.7 | 4.1 | 10.4 | |
| 4 | Metals | 7.3 | 7.3 | 7.3 | 7.3 | |
| 5 | Chemicals and photographic supplies | 6.7 | 4.6 | 4.6 | 5.5 | |
| 6 | Transport equipment | 12.3 | 8.1 | 4.7 | 8.6 | |
| 7 | Non-electric machinery | 8.1 | 2.6 | 1.8 | 4.1 | |
| 8 | Electric machinery | 8.4 | 4.4 | 2.4 | 7.8 | |
| 9 | Minerals products and precious stones | 9.9 | 9.9 | 9.5 | 7.5 | |
| 10 | Manufactured articles n,e,s, | 11.6 | 7.2 | 102.2 | 109.8 | |
| 11 | Fish and fish products | 10.9 | 6.8 | 11.6 | 13.5 | |
| 12 | Fruit & vegetables | 14.8 | 8.0 | 10.7 | 15.5 | |
| 13 | Coffee, tea, mate, & cocoa | 14.9 | 24.8 | 5.9 | 15.1 | |
| 14 | Sugars | 28.7 | 11.5 | 27.5 | 14.9 | |
| 15 | Spices,cereal and other food prepar | 23 | 9.5 | 14.9 | 14.2 | |
| 16 | Grains | 23 | 9.5 | 14.9 | 14.2 | |
| 17 | Animals and products thereof | 14.2 | 24.8 | 17.9 | 18.5 | |
| 18 | Oilseeds, fats and oils | 10.9 | 6.5 | 5.5 | 10.2 | |
| 19 | Flowers,plants,vegetable materials, | 14.8 | 8.0 | 10.7 | 15.5 | |
| 20 | Beverages & spirits | 23.7 | 22.5 | 19.8 | 37.4 | |
| 21 | Dairy products | 12.3 | 15.3 | 43.7 | 22.2 | |
| 22 | Tobacco | 23.7 | 22.5 | 19.8 | 37.4 | |
| 23 | Other agricultural products | 11.8 | 4.7 | 3.3 | 8 | |
| 97 | Petroleum | 5.3 | 4.4 | 2.5 | 6.9 | |
| Total trade | 9.8 | 6.8 | 5.2 | – | ||
Source: (WTO 2019), (WITS 2020) and author’s calculations.
Table 14. Simple average ad valorem equivalents of non-tariff measures by China, the EAEU, the EU and the World (2018, MTN classification, in ad valorem %)
| MTN | Description | EAEU to RoW | EAEU to CHN | EAEU to EU | CHN | EU | WLD |
| 1 | Wood, pulp, paper & furniture | 46.7 | 49.5 | 45.4 | 79.0 | 7.7 | 56.0 |
| 2 | Textiles & clothing | 21.5 | 18.7 | 12.5 | 97.0 | 46.3 | 61.0 |
| 3 | Leather, rubber, footwear & travel | 33.6 | 34.2 | 31.2 | 50.0 | 46.3 | 60.0 |
| 4 | Metals | 36.5 | 32.0 | 19.4 | 78.0 | 38.5 | 47.0 |
| 5 | Chemicals and photographic supplies | 32.1 | 38.4 | 22.4 | 73.0 | 21.0 | 45.0 |
| 6 | Transport equipment | 33.8 | 40.0 | 27.0 | 84.0 | 26.8 | 53.0 |
| 7 | Non-electric machinery | 35.8 | 41.2 | 32.8 | 100.0 | 6.2 | 61.0 |
| 8 | Electric machinery | 35.8 | 41.2 | 32.8 | 100.0 | 19.4 | 61.0 |
| 9 | Minerals products and precious stones | 22.0 | 22.0 | 22.0 | 100.0 | 38.5 | 39.0 |
| 10 | Manufactured articles n,e,s, | 15.3 | 23.0 | 14.4 | 26.0 | 6.2 | 54.0 |
| 11 | Fish and fish products | 7.7 | 27.4 | 8.6 | 91.0 | 48.2 | 43.0 |
| 12 | Fruit & vegetables | 56.2 | 55.3 | 34.9 | 92.0 | 48.2 | 55.0 |
| 13 | Coffee, tea, mate, & cocoa | 44.8 | 56.7 | 40.2 | 88.0 | 48.4 | 75.0 |
| 14 | Sugars | 44.8 | 56.7 | 40.2 | 88.0 | 48.4 | 75.0 |
| 15 | Spices,cereal and other food prepar | 44.8 | 56.7 | 40.2 | 88.0 | 48.4 | 75.0 |
| 16 | Grains | 56.2 | 55.3 | 34.9 | 92.0 | 48.2 | 55.0 |
| 17 | Animals and products thereof | 44.8 | 55.3 | 34.9 | 91.0 | 68.2 | 43.0 |
| 18 | Oilseeds, fats and oils | 44.8 | 55.3 | 40.2 | 92.0 | 48.2 | 46.0 |
| 19 | Flowers,plants,vegetable materials, | 56.2 | 55.3 | 34.9 | 92.0 | 48.2 | 55.0 |
| 20 | Beverages & spirits | 44.8 | 56.7 | 40.2 | 88.0 | 41.8 | 75.0 |
| 21 | Dairy products | 44.8 | 56.7 | 40.2 | 91.0 | 48.4 | 75.0 |
| 22 | Tobacco | 44.8 | 56.7 | 40.2 | 88.0 | 41.8 | 75.0 |
| 23 | Other agricultural products | 56.2 | 55.3 | 34.9 | 92.0 | 48.2 | 55.0 |
| 97 | Petroleum | 41.7 | 40.2 | 22.6 | 100.0 | 24.2 | 51.0 |
| Total trade | 39.4 | 45.0 | 31.1 | 85.8 | 38.2 | 57.9 |
Source: (Niu 2018), (Knobel et al 2019), (Berden et al 2015), (Niu et al. 2018) and author‘s calculations.
Table 15. Simple average import elasticities of China, the EAEU, the EU and the World (1995-2014 average)
| Agri-food | Manufacturing | Total | |
| CHN | -1.049 | -0.963 | -0.966 |
| EAEU | -0.957 | -0.918 | -0.924 |
| EU | -0.981 | -0.976 | -0.976 |
| WLD | -0.972 | -0.975 | -0.975 |
Source: (Ghodsi et al. 2016) and author’s calculations.
Table 16. Effects for China of a free trade agreement (FTA) with the EAEU (benchmark year – 2018, 100% mutual reduction of tariffs)
| MTN | Description | Export change to EAEU (in %) | Export change to EAEU (in USD mln) | Total export change (in USD mln) | Net welfare change (in USD mln) | Gross welfare change (in USD mln) | Producers surplus
(in USD mln) |
Consumer surplus (in USD mln) |
| 1 | Wood, pulp, paper & furniture | 22.2 | 268.8 | 108.3 | 89.0 | 248.2 | 43.3 | 204.9 |
| 2 | Textiles & clothing | 20.8 | 1276.4 | 559.0 | 227.3 | 231.9 | 223.5 | 8.3 |
| 3 | Leather, rubber, footware, travel | 14.3 | 480.9 | 244.3 | 99.0 | 138.4 | 97.7 | 40.7 |
| 4 | Metals | 22 | 1117.2 | 262.0 | 418.0 | 915.6 | 245.8 | 669.8 |
| 5 | Chemicals | 14.9 | 814.8 | 1154.1 | -77.7 | 14.5 | -69.5 | 83.9 |
| 6 | Transport equipment | 24.9 | 681.4 | 270.6 | 116.9 | 129.7 | 108.2 | 21.5 |
| 7 | Non-electric machinery | 6.7 | 1057.1 | 438.4 | 191.2 | 205.2 | 175.4 | 29.8 |
| 8 | Electric machinery | 9.1 | 1385.4 | 598.1 | 251.9 | 256.7 | 239.3 | 17.4 |
| 9 | Minerals and precious stones | 33.2 | 530.1 | 213.8 | 255.4 | 663.4 | 85.5 | 577.9 |
| 10 | Manufactured articles n.e.s. | 19.9 | 937.2 | 386.1 | 155.7 | 201.0 | 154.5 | 46.6 |
| 11 | Fish and fish products | 22.3 | 84.8 | 36.2 | 54.6 | 212.3 | 14.5 | 197.8 |
| 12 | Fruit and vegetables | 20.8 | 253.0 | 104.2 | 44.2 | 47.8 | 41.7 | 6.1 |
| 13 | Coffee, tea | 64.1 | 57.4 | 22.9 | 10.8 | 18.4 | 9.2 | 9.3 |
| 14 | Sugars | 31.4 | 14.2 | 5.6 | 2.2 | 3.2 | 2.3 | 0.9 |
| 15 | Spices,cereal and other food prepar | 27.1 | 37.7 | 14.8 | 6.5 | 16.0 | 5.9 | 10.0 |
| 16 | Grains | 28.7 | 1.0 | 0.5 | 1.9 | 30.3 | 0.2 | 30.1 |
| 17 | Animals and products thereof | 68.8 | 1.1 | 0.4 | 0.6 | 1.9 | 0.2 | 1.7 |
| 18 | Oilseeds, fats and oils | 20.1 | 8.7 | 3.6 | 28.2 | 94.4 | 1.4 | 93.0 |
| 19 | Flowers,plants,vegetable materials | 23 | 13.5 | 5.4 | 2.5 | 4.0 | 2.1 | 1.8 |
| 20 | Beverages and spirits | 59.9 | 55.0 | 21.7 | 9.2 | 17.4 | 8.7 | 8.8 |
| 21 | Dairy products | 45.1 | 0.0 | 0.0 | 1.8 | 6.9 | 0.0 | 6.9 |
| 22 | Tobacco | 59.2 | 28.4 | 11.1 | 4.7 | 6.1 | 4.4 | 1.6 |
| 23 | Other agricultural products | 13.5 | 23.0 | 9.3 | 6.7 | 15.1 | 3.7 | 11.4 |
| 97 | Petroleum | 16.4 | 0.6 | -1.2 | 683.8 | 1955.3 | -0.5 | 1955.8 |
| Agri-food | – | 577.8 | 235.5 | 173.9 | 473.8 | 94.2 | 379.5 | |
| Manufacturing | – | 8550.0 | 4233.5 | 2410.4 | 4959.9 | 1303.2 | 3656.7 | |
| Total trade | 13.8 (%) | 9127.8 | 4469.0 | 2584.4 | 5433.7 | 1397.4 | 4036.2 | |
| Total (in % of CHN GDP) | – | 0.1 | 0.03 | 0.02 | 0.04 | 0.01 | 0.03 | |
Source: Estimations by the author.
Table 17. Effects for the EAEU of a free trade agreement (FTA) with China (benchmark year – 2018, 100% mutual reduction of tariffs)
| MTN | Description | Export change to CHN (in %) | Export change to CHN (in USD mln) | Total export change (in USD mln) | Net welfare change (in USD mln) | Gross welfare change (in USD mln) | Producers surplus
(in USD mln) |
Consumer surplus (in USD mln) |
| 1 | Wood, pulp, paper & furniture | 8 | 520.5 | 223.9 | 131.2 | 174.2 | 89.6 | 84.6 |
| 2 | Textiles & clothing | 42.1 | 12.3 | -62.7 | 7.5 | 468.3 | -25.1 | 493.4 |
| 3 | Leather, rubber, footware, travel | 39 | 115.7 | 23.6 | 49.2 | 192.4 | 9.5 | 182.9 |
| 4 | Metals | 15.9 | 1595.8 | -184.7 | 556.0 | 736.7 | 434.8 | 301.9 |
| 5 | Chemicals | 15.6 | 311.1 | -192.8 | 222.1 | 324.4 | 118.7 | 205.7 |
| 6 | Transport equipment | 31.7 | 38.7 | -14.3 | 60.0 | 214.3 | -5.7 | 220.1 |
| 7 | Non-electric machinery | 19.8 | 48.0 | -13.7 | 143.8 | 401.6 | -5.5 | 407.1 |
| 8 | Electric machinery | 22.7 | 16.5 | -56.6 | 197.7 | 655.3 | -22.6 | 677.9 |
| 9 | Minerals and precious stones | 22 | 1285.0 | 428.2 | 214.0 | 315.0 | 171.3 | 143.7 |
| 10 | Manufactured articles n.e.s. | 41 | 140.4 | 20.9 | 75.0 | 343.4 | 8.3 | 335.1 |
| 11 | Fish and fish products | 18.3 | 437.5 | 205.1 | 92.9 | 101.9 | 82.2 | 19.7 |
| 12 | Fruit and vegetables | 36 | 10.8 | -2.6 | 19.0 | 91.4 | -1.0 | 92.4 |
| 13 | Coffee, tea | 34.4 | 21.8 | 5.5 | 4.8 | 22.5 | 2.2 | 20.3 |
| 14 | Sugars | 66.7 | 2.0 | -2.4 | 3.1 | 4.6 | -1.0 | 5.6 |
| 15 | Spices,cereal and other food prepar | 54 | 22.5 | 4.9 | 10.0 | 14.4 | 2.0 | 12.4 |
| 16 | Grains | 51.9 | 67.3 | 26.8 | 11.0 | 10.7 | 10.7 | 0.0 |
| 17 | Animals and products thereof | 34.3 | 4.0 | 1.6 | 0.9 | 0.5 | 0.7 | -0.2 |
| 18 | Oilseeds, fats and oils | 22.3 | 206.9 | 91.8 | 39.9 | 33.1 | 36.8 | -3.7 |
| 19 | Flowers,plants,vegetable materials | 33.7 | 4.3 | 1.3 | 2.4 | 4.8 | 0.5 | 4.2 |
| 20 | Beverages and spirits | 54.8 | 19.3 | 4.5 | 5.8 | 21.1 | 1.8 | 19.3 |
| 21 | Dairy products | 29 | 16.2 | 11.1 | 2.0 | 0.3 | 4.4 | -4.1 |
| 22 | Tobacco | 56 | 3.3 | -0.6 | 1.5 | 10.5 | -0.2 | 10.7 |
| 23 | Other agricultural products | 27.1 | 26.7 | 9.9 | 8.5 | 11.0 | 4.0 | 7.0 |
| 97 | Petroleum | 9.8 | 4061.1 | 1970.6 | 759.8 | 755.4 | 788.5 | -33.1 |
| Agri-food | – | 842.7 | 357.1 | 201.8 | 326.8 | 143.0 | 183.7 | |
| Manufacturing | – | 8145.0 | 2142.4 | 2416.2 | 4581.1 | 1561.9 | 3019.2 | |
| Total trade | 13.2 | 8987.8 | 2499.5 | 2618.0 | 4907.9 | 1705.0 | 3202.9 | |
| Total (in % of EAEU GDP) | – | 0.5 | 0.1 | 0.1 | 0.3 | 0.1 | 0.2 | |
Source: Estimations by the author.
Table 18. Effects for China of a deep free trade agreement (deep FTA) with the EAEU (benchmark year – 2018, 100% mutual reduction of tariffs and 20% mutual reduction of AVEs of NTBs)
| MTN | Description | Export change to EAEU (in %) | Export change to EAEU (in USD mln) | Total export change (in USD mln) | Net welfare change (in USD mln) | Gross welfare change (in USD mln) | Producers surplus
(in USD mln) |
Consumer surplus (in USD mln) |
| 1 | Wood, pulp, paper & furniture | 51 | 618.2 | 249.0 | -31.9 | 1102.7 | 99.6 | 1003.1 |
| 2 | Textiles & clothing | 30.6 | 1883.8 | 824.5 | 330.6 | 345.6 | 329.9 | 15.8 |
| 3 | Leather, rubber, footware, travel | 31.3 | 1054.3 | 532.6 | 196.1 | 286.0 | 213.1 | 72.9 |
| 4 | Metals | 41 | 2075.5 | 1426.9 | -114.2 | 2383.0 | 183.1 | 2199.9 |
| 5 | Chemicals | 38.3 | 2107.0 | 1636.6 | 67.4 | 536.1 | 125.1 | 411.0 |
| 6 | Transport equipment | 49.5 | 1356.5 | 538.2 | 218.2 | 263.9 | 215.4 | 48.5 |
| 7 | Non-electric machinery | 28.2 | 4433.7 | 1838.3 | 763.3 | 846.0 | 735.4 | 110.5 |
| 8 | Electric machinery | 26.3 | 4002.4 | 1727.0 | 717.1 | 744.6 | 691.2 | 53.5 |
| 9 | Minerals and precious stones | 48.6 | 776.0 | 320.7 | -117.0 | 1872.5 | 128.3 | 1744.2 |
| 10 | Manufactured articles n.e.s. | 32.6 | 1535.2 | 632.1 | 245.7 | 322.0 | 253.0 | 69.1 |
| 11 | Fish and fish products | 40.7 | 154.7 | 68.0 | -47.0 | 569.3 | 27.2 | 542.1 |
| 12 | Fruit and vegetables | 49.5 | 606.3 | 249.4 | 101.2 | 113.8 | 99.9 | 14.0 |
| 13 | Coffee, tea | 93.4 | 83.9 | 33.3 | 8.8 | 33.6 | 13.4 | 20.2 |
| 14 | Sugars | 62.2 | 28.3 | 11.2 | 3.8 | 5.9 | 4.5 | 1.5 |
| 15 | Spices,cereal and other food prepar | 59.4 | 82.6 | 32.4 | 7.2 | 30.9 | 13.0 | 17.9 |
| 16 | Grains | 62.2 | 2.2 | 1.0 | -18.7 | 54.6 | 0.4 | 54.3 |
| 17 | Animals and products thereof | 99.7 | 1.5 | 0.6 | -0.6 | 4.2 | 0.2 | 4.0 |
| 18 | Oilseeds, fats and oils | 54.4 | 23.5 | 9.7 | -17.0 | 257.6 | 3.9 | 253.8 |
| 19 | Flowers,plants,vegetable materials | 54.9 | 32.2 | 12.8 | 4.2 | 9.3 | 5.1 | 4.1 |
| 20 | Beverages and spirits | 90 | 82.7 | 32.6 | 7.9 | 28.2 | 13.0 | 15.2 |
| 21 | Dairy products | 78.9 | 0.0 | 0.0 | -2.8 | 17.3 | 0.0 | 17.3 |
| 22 | Tobacco | 89.7 | 43.0 | 25.7 | 3.7 | 7.1 | 4.4 | 2.7 |
| 23 | Other agricultural products | 45.4 | 77.3 | 31.1 | 8.2 | 42.0 | 12.4 | 29.5 |
| 97 | Petroleum | 48.4 | 1.7 | -6.3 | -222.3 | 9525.4 | -2.5 | 9527.9 |
| Agri-food | – | 1218.2 | 507.7 | 59.1 | 1173.8 | 197.4 | 976.4 | |
| Manufacturing | – | 19844.3 | 9719.5 | 2053.2 | 18227.8 | 2971.6 | 15256.3 | |
| Total trade | 31.8 | 21062.5 | 10227.2 | 2112.2 | 19401.6 | 3169.0 | 16232.6 | |
| Total (in % of CHN GDP) | – | 0.2 | 0.1 | 0.02 | 0.1 | 0.02 | 0.1 | |
Source: Estimations by the author.
Table 19. Effects for the EAEU of a deep free trade agreement (FTA) with China (benchmark year – 2018, 100% mutual reduction of tariffs and 20% mutual reduction of AVEs of NTBs)
| MTN | Description | Export change to CHN (in %) | Export change to CHN (in USD mln) | Total export change (in USD mln) | Net welfare change (in USD mln) | Gross welfare change (in USD mln) | Producers surplus
(in USD mln) |
Consumer surplus (in USD mln) |
| 1 | Wood, pulp, paper & furniture | 38.2 | 2540.5 | 1171.0 | 508.6 | 629.5 | 470.2 | 159.4 |
| 2 | Textiles & clothing | 89.5 | 26.3 | -88.9 | -53.4 | 695.0 | -35.5 | 730.5 |
| 3 | Leather, rubber, footware, travel | 69 | 204.4 | 31.8 | 32.2 | 419.4 | 12.7 | 406.7 |
| 4 | Metals | 58.1 | 5632.8 | 4153.0 | 357.0 | 890.3 | 231.2 | 659.2 |
| 5 | Chemicals | 57.8 | 1112.9 | 705.2 | 192.8 | 704.4 | 40.1 | 664.3 |
| 6 | Transport equipment | 74.7 | 91.3 | -22.7 | 15.2 | 428.4 | -9.1 | 437.5 |
| 7 | Non-electric machinery | 69.2 | 167.1 | -70.6 | 246.0 | 1695.8 | -28.2 | 1724.1 |
| 8 | Electric machinery | 75.2 | 54.3 | -159.6 | 266.6 | 1917.5 | -63.7 | 1981.2 |
| 9 | Minerals and precious stones | 66.2 | 3881.7 | 1469.8 | 604.6 | 771.8 | 588.5 | 183.3 |
| 10 | Manufactured articles n.e.s. | 59.7 | 204.3 | 23.5 | 51.8 | 563.0 | 9.4 | 553.6 |
| 11 | Fish and fish products | 48.7 | 1187.8 | 560.2 | 233.6 | 255.4 | 225.2 | 30.2 |
| 12 | Fruit and vegetables | 80.9 | 24.3 | -6.7 | -19.2 | 219.8 | -2.7 | 222.5 |
| 13 | Coffee, tea | 74.6 | 47.6 | 14.5 | 1.1 | 34.2 | 5.8 | 28.4 |
| 14 | Sugars | 107.9 | 3.2 | -5.1 | 2.9 | 9.2 | -2.0 | 11.2 |
| 15 | Spices,cereal and other food prepar | 95.4 | 39.7 | 6.9 | 11.0 | 30.5 | 2.7 | 27.7 |
| 16 | Grains | 93.5 | 121.2 | 48.2 | 19.6 | 19.4 | 19.3 | 0.1 |
| 17 | Animals and products thereof | 78.3 | 9.2 | 3.9 | 1.9 | 0.8 | 1.6 | -0.8 |
| 18 | Oilseeds, fats and oils | 60 | 563.8 | 248.9 | 105.7 | 90.1 | 99.9 | -9.8 |
| 19 | Flowers,plants,vegetable materials | 75.6 | 9.7 | 2.9 | 2.0 | 11.4 | 1.2 | 10.2 |
| 20 | Beverages and spirits | 95.4 | 33.7 | 8.6 | 0.4 | 32.0 | 3.5 | 28.6 |
| 21 | Dairy products | 71.8 | 40.4 | 27.5 | 5.0 | 0.9 | 11.0 | -10.1 |
| 22 | Tobacco | 97.4 | 5.7 | -0.5 | -2.4 | 16.0 | -0.2 | 16.2 |
| 23 | Other agricultural products | 69.5 | 68.8 | 24.5 | 16.4 | 34.3 | 9.8 | 24.5 |
| 97 | Petroleum | 46.7 | 19619.9 | 9476.5 | 3661.3 | 3640.5 | 3799.6 | -159.1 |
| Agri-food | – | 2155.2 | 933.9 | 378.1 | 753.9 | 375.0 | 378.9 | |
| Manufacturing | – | 33535.4 | 16688.9 | 5882.7 | 12355.7 | 5015.1 | 7340.6 | |
| Total trade | 52.4 | 35690.6 | 17622.8 | 6260.8 | 13109.6 | 5390.1 | 7719.5 | |
| Total (in % of EAEU GDP) | – | 1.9 | 0.9 | 0.3 | 0.7 | 0.3 | 0.4 | |
Source: Estimations by the author.
Table 20. Effects for China of the non-preferential agreement with the EAEU (benchmark year – 2018, 20% mutual reduction of AVEs of NTBs)
| MTN | Description | Export change to EAEU (in %) | Export change to EAEU (in USD mln) | Total export change (in USD mln) | Net welfare change (in USD mln) | Gross welfare change (in USD mln) | Producers surplus
(in USD mln) |
Consumer surplus (in USD mln) |
| 1 | Wood, pulp, paper & furniture | 28.8 | 349.0 | 140.7 | 19.8 | 843.1 | 56.3 | 786.8 |
| 2 | Textiles & clothing | 9.9 | 606.3 | 265.3 | 108.0 | 113.7 | 106.1 | 7.5 |
| 3 | Leather, rubber, footware, travel | 17 | 572.0 | 287.9 | 119.9 | 147.2 | 115.2 | 32.0 |
| 4 | Metals | 19.7 | 998.7 | 426.7 | 257.4 | 1629.3 | 170.7 | 1458.6 |
| 5 | Chemicals | 23.8 | 1314.4 | 524.9 | 227.0 | 492.1 | 210.0 | 282.1 |
| 6 | Transport equipment | 24.6 | 673.3 | 267.3 | 114.1 | 134.0 | 106.9 | 27.0 |
| 7 | Non-electric machinery | 21.5 | 3374.7 | 1399.6 | 591.4 | 640.6 | 559.9 | 80.7 |
| 8 | Electric machinery | 17.2 | 2615.1 | 1128.7 | 471.8 | 487.7 | 451.5 | 36.2 |
| 9 | Minerals and precious stones | 15.4 | 245.3 | 106.8 | 125.6 | 1202.5 | 42.7 | 1159.8 |
| 10 | Manufactured articles n.e.s. | 12.7 | 597.3 | 246.0 | 104.4 | 120.8 | 98.4 | 22.4 |
| 11 | Fish and fish products | 18.3 | 69.7 | 31.8 | 33.3 | 344.6 | 12.7 | 331.9 |
| 12 | Fruit and vegetables | 28.8 | 351.4 | 144.7 | 60.8 | 65.8 | 57.9 | 7.8 |
| 13 | Coffee, tea | 29.3 | 26.2 | 10.4 | 5.4 | 15.0 | 4.2 | 10.8 |
| 14 | Sugars | 30.8 | 14.0 | 5.5 | 2.3 | 2.8 | 2.2 | 0.6 |
| 15 | Spices,cereal and other food prepar | 32.2 | 44.8 | 17.6 | 8.6 | 14.9 | 7.0 | 7.8 |
| 16 | Grains | 33.5 | 1.2 | 0.5 | 8.8 | 8.7 | 0.2 | 24.1 |
| 17 | Animals and products thereof | 30.9 | 0.5 | 0.2 | 0.4 | 2.3 | 0.1 | 2.2 |
| 18 | Oilseeds, fats and oils | 34.3 | 14.8 | 6.1 | 24.1 | 160.3 | 2.4 | 157.9 |
| 19 | Flowers,plants,vegetable materials | 31.9 | 18.7 | 7.5 | 3.2 | 5.3 | 3.0 | 2.3 |
| 20 | Beverages and spirits | 30.1 | 27.6 | 10.9 | 5.5 | 10.7 | 4.3 | 6.4 |
| 21 | Dairy products | 33.8 | 0.0 | 0.0 | 1.2 | 10.3 | 0.0 | 10.3 |
| 22 | Tobacco | 29.7 | 14.3 | 5.6 | 2.5 | 3.4 | 2.2 | 1.2 |
| 23 | Other agricultural products | 31.8 | 54.2 | 21.8 | 10.9 | 26.7 | 8.7 | 18.0 |
| 97 | Petroleum | 32.2 | 1.1 | -5.1 | 561.6 | 7489.6 | -2.0 | 7491.6 |
| Agri-food | – | 637.3 | 262.5 | 167.0 | 670.7 | 105.0 | 581.2 | |
| Manufacturing | – | 11347.2 | 4788.8 | 2701.0 | 13300.5 | 1915.7 | 11384.7 | |
| Total | 17.6 | 11984.5 | 5051.3 | 2868.0 | 13971.2 | 2020.8 | 11966.0 | |
| Total (in % of CHN GDP) | – | 0.1 | 0.04 | 0.02 | 0.1 | 0.01 | 0.1 | |
Source: Estimations by the author.
Table 21. Effects for the EAEU of the non-preferential agreement with China (benchmark year – 2018, 20% mutual reduction of AVEs of NTBs)
| MTN | Description | Export change to CHN (in %) | Export change to CHN (in USD mln) | Total export change (in USD mln) | Net welfare change (in USD mln) | Gross welfare change (in USD mln) | Producers surplus
(in USD mln) |
Consumer surplus (in USD mln) |
| 1 | Wood, pulp, paper & furniture | 30.1 | 2001.0 | 941.6 | 428.2 | 452.0 | 377.8 | 74.2 |
| 2 | Textiles & clothing | 47.4 | 14.1 | -26.5 | 27.9 | 221.1 | -10.6 | 231.7 |
| 3 | Leather, rubber, footware, travel | 30 | 88.5 | 8.1 | 44.7 | 223.8 | 3.2 | 220.6 |
| 4 | Metals | 36.5 | 3620.8 | 1432.1 | 684.6 | 813.4 | 573.6 | 239.8 |
| 5 | Chemicals | 37.9 | 738.5 | 238.5 | 244.9 | 486.6 | 95.4 | 391.2 |
| 6 | Transport equipment | 43 | 52.6 | -8.4 | 62.3 | 212.7 | -3.3 | 216.0 |
| 7 | Non-electric machinery | 49.4 | 119.3 | -57.0 | 269.9 | 1287.1 | -22.8 | 1309.9 |
| 8 | Electric machinery | 52.6 | 38.2 | -103.6 | 280.5 | 1244.4 | -41.4 | 1285.8 |
| 9 | Minerals and precious stones | 44.1 | 2586.4 | 1039.3 | 436.4 | 455.1 | 416.0 | 39.1 |
| 10 | Manufactured articles n.e.s. | 18.7 | 63.7 | 2.7 | 58.9 | 215.8 | 1.1 | 214.7 |
| 11 | Fish and fish products | 30.4 | 733.8 | 350.1 | 147.4 | 150.9 | 140.5 | 10.4 |
| 12 | Fruit and vegetables | 44.9 | 13.5 | -4.2 | 15.7 | 126.9 | -1.7 | 128.6 |
| 13 | Coffee, tea | 40.2 | 25.6 | 9.0 | 8.9 | 11.5 | 3.6 | 7.9 |
| 14 | Sugars | 41.2 | 1.2 | -2.7 | 2.9 | 4.5 | -1.1 | 5.6 |
| 15 | Spices,cereal and other food prepar | 41.4 | 17.2 | 2.0 | 9.5 | 16.1 | 0.8 | 15.3 |
| 16 | Grains | 41.5 | 53.8 | 21.4 | 4.0 | 24.3 | 8.6 | 0.1 |
| 17 | Animals and products thereof | 44 | 5.2 | 2.2 | 1.2 | 0.3 | 0.9 | -0.6 |
| 18 | Oilseeds, fats and oils | 37.7 | 351.3 | 155.5 | 67.0 | 56.2 | 62.3 | -6.1 |
| 19 | Flowers,plants,vegetable materials | 41.9 | 5.3 | 1.6 | 2.6 | 6.6 | 0.6 | 5.9 |
| 20 | Beverages and spirits | 40.6 | 14.3 | 4.1 | 6.9 | 10.9 | 1.7 | 9.2 |
| 21 | Dairy products | 42.8 | 24.1 | 16.4 | 3.0 | 0.5 | 6.6 | -6.0 |
| 22 | Tobacco | 41.4 | 2.4 | 0.0 | 2.5 | 5.3 | 0.0 | 5.3 |
| 23 | Other agricultural products | 42.4 | 41.8 | 14.6 | 12.9 | 23.3 | 5.8 | 17.4 |
| 97 | Petroleum | 26.9 | 15460.7 | 7476.7 | 2887.1 | 2870.6 | 2996.3 | -125.7 |
| Agri-food | – | 1289.6 | 570.1 | 284.4 | 437.2 | 228.6 | 193.1 | |
| Manufacturing | – | 24783.9 | 10943.5 | 5425.3 | 8482.5 | 4385.2 | 4097.3 | |
| Total trade | 35.3 | 26073.5 | 11513.6 | 5709.7 | 8919.8 | 4613.8 | 4290.4 | |
| Total (in % of EAEU GDP) | – | 1.3 | 0.6 | 0.3 | 0.4 | 0.2 | 0.2 | |
Source: Estimations by the author.
Literature
Belta News Ageny (2019) EEC has identified three main areas of industrial cooperation between the EAEU and China. In Russian. https://www.belta.by/economics/view/eek-opredelila-tri-osnovnyh-napravlenija-promyshlennogo-sotrudnichestva-eaes-s-kitaem-365900-2019/
Berden K, Francois J (2015) Quantifying Non-Tariff Measures for TTIP. CEPS. https://www.ceps.eu/system/files/SR116%20Berden%20and%20Francois%20NTMs.pdf
Bordachev T, Skriba A, Kazakova A (2016) Conjunction of the EAEU and Silk Road Economic Belt. Higher School of Economics. http://greater-europe.org/archives/4135
Chowdhry S, Felbermayr G (2020) The US–China trade deal and its impact on China’s key trading partners. Kiel Institute for the World Economy. https://www.ifw-kiel.de/fileadmin/Dateiverwaltung/IfW-Publications/-ifw/Kiel_Policy_Brief/Kiel_Policy_Brief_134.pdf
Eurasian Economic Commission (2018a) EAEU and China are focused on a breakthrough in trade, economic and investment cooperation. In Russian. http://www.eurasiancommission.org/ru/nae/news/Pages/19-06-2018-3.aspx
Eurasian Economic Commission (2018b) Agreement with China. http://www.eurasiancommission.org/ru/act/trade/dotp/sogl_torg/Documents/Соглашение%20с%20Китаем/Текст%20ангийский%20%28EAEU%20alternate%29%20final.pdf
Eurasian Economic Commission (2018c) Partnership of the EAEU and China creates incentives for the development of industry of the Union. In Russian. http://eec.eaeunion.org/ru/nae/news/Pages/22-06-2018-2.aspx
Eurasian Economic Commission (2019a) Foreign trade in goods. Statistics of the Eurasian Economic Union. 2018 year. Statistical Digest. In Russian. http://www.eurasiancommission.org/ru/act/integr_i_makroec/dep_stat/tradestat/publications/Documents/Ext_2018.pdf
Eurasian Economic Commission (2019b) EAEU and China signed Agreement on Customs Information Exchange http://www.eurasiancommission.org/en/nae/news/Pages/06-06-2019-3.aspx
Eurasian Economic Commission (2019c) Trade remedy measures in force. http://www.eurasiancommission.org/en/act/trade/podm/mery/Pages/default.aspx
Eurasian Economic Commission (2019d) Creating conditions for barrier-free trade is an important condition for the development of cooperation between the EAEU and China in the field of technical regulation. In Russian. http://www.eurasiancommission.org/ru/nae/news/Pages/22-10-2019-4.aspx
Eurasian Economic Commission (2019e) Agreements with Singapore. http://www.eurasiancommission.org/ru/act/trade/dotp/Pages/Соглашение-с-Сингапуром.aspx
Francois J, Hall K (2002) Francois Global Simulation Analysis of Industry-Level Trade Policy. World Bank. http://wits.worldbank.org/data/public/GSIMMethodology.pdf
Ghodsi M, Grübler J, Stehrer R (2016) Import Demand Elasticities Revisited. Vienna Institute for International Economic Studies. https://wiiw.ac.at/import-demand-elasticities-revisited-dlp-4075.pdf
GlobalPetrolPrices.com (2020) Electricity prices for business, June 2019. https://www.globalpetrolprices.com/electricity_prices/
ifo (2019) ifo World Economic Survey IV (November) 2019. https://www.ifo.de/DocDL/WES_4_19_1.pdf
Knobel A, Lipin A, Malokostov A, Tarr D and Turdyeva N (2019) Deep Integration in the Eurasian Economic Union: What are the Benefits of Successful Implementation or Wider Liberalization? Bank of Russia. https://www.cbr.ru/Content/Document/File/72459/wp_41e.pdf
Kofner J (2019) Did the Eurasian Economic Union (EAEU) create a common market for goods, services, capital and labor within the Union? Vienna Institute for Security Policy. https://www.institutfuersicherheit.at/did-the-eurasian-economic-union-eaeu-create-a-common-market-for-goods-services-capital-and-labor-within-the-union/
Kofner J (2020) Digital transformation: implications for trade policy and economic integration. International Institute for Applied Systems Analysis. (forthcoming)
Kremlin (2015) Joint statement by the Russian Federation and the People’s Republic of China on cooperation in the conjunction of the Eurasian Economic Union and the Silk Road Economic Belt. http://kremlin.ru/supplement/4971
Kremlin (2019) Joint Statement on Developing Comprehensive Partnership and Strategic Interaction Entering a New Era http://kremlin.ru/supplement/5413
Krzywdzinski M (2014) How the EU’s Eastern Enlargement Changed the German Productive Model. The Case of the Automotive industry. https://journals.openedition.org/regulation/10663
Li Z (2019) Connecting the BRI with Eurasian Economic Union is strategic choice of China, Russia. China Institute of International Studies. http://www.ciis.org.cn/english/2019-06/10/content_40780998.html
Ministry of Commerce of the People’s Republic of China (2018) China and Eurasian Economic Union Officially Sign Trade and Economic Cooperation Agreement. http://english.mofcom.gov.cn/article/newsrelease/significantnews/201805/20180502746079.shtml
Ministry of Commerce of the People’s Republic of China (2019) Joint Statement on the Entry into Force of the Agreement on Economic and Trade Cooperation Between the People’s Republic of China and the Eurasian Economic Union Signed on May 17, 2018. http://english.mofcom.gov.cn/article/newsrelease/significantnews/201911/20191102909280.shtml
Niu Zh (2018) The Rising Importance of Non-tariff Measures in China’s Trade Policy. In: Non-Tariff Measures: Economic Assessment and Policy Options for Development. UNCTAD. https://unctad.org/en/PublicationsLibrary/ditctab2018d3_en.pdf
Niu Zh, Liu Ch, Gunessee S, Milner C (2018) Non-Tariff and Overall Protection: Evidence from Across Countries and Over Time. University of Nottingham. https://www.nottingham.ac.uk/gep/documents/papers/2018/2018-05.pdf
Saint Petersburg Economic Forum (2016) Transcript of the plenary session. https://forumspb.rcfiles.rcmedia.ru/upload/iblock/bc1/bc1e9a08b2e875d985d6393e674255d3.pdf
Schroeder C (2019) Industrial labor costs in international comparison. IW Koeln. In German. https://www.iwkoeln.de/fileadmin/user_upload/Studien/IW-Trends/PDF/2019/IW-Trends_2019-02-05_Industrielle_Arbeitskosten.pdf
Sputnik News Agency (2019) A free trade area with China – why the EAEU is in no hurry to open it. In Russian. https://ru.sputnik.kg/asia/20190916/1045717349/eehas-kitaj-soglashenie-zona-svobodnoj-torgovli-usloviya.html
State Council of the People’s Republic of China (2015) Chronology of China’s Belt and Road Initiative. http://english.www.gov.cn/news/top_news/2015/04/20/content_281475092566326.htm
TASS News Agency (2019a) Chinese Ambassador to Russia: Beijing wants to sign an FTA agreement with the EAEU as soon as possible. In Russian. https://tass.ru/ekonomika/6336321
TASS News Agency (2019b) China is waiting for the start of negotiations on an agreement on a Eurasian Economic Partnership with Russia. https://tass.ru/ekonomika/6352244
United Nations Conference on Trade and Development (2019) Armenia – Singapore Agreement on Trade in Services and Investment – 2019. International Investment Agreements Navigator. https://investmentpolicy.unctad.org/international-investment-agreements/treaties/treaties-with-investment-provisions/4906/armenia—singapore-agreement-on-trade-in-services-and-investment-2019-
World Bank (2019a) World Bank Commodity Price Data (The Pink Sheet) https://www.worldbank.org/en/research/commodity-markets
World Bank (2019b) World Bank Open Data. https://data.worldbank.org/indicator/NY.GDP.MKTP.CD?end=2018&locations=RU&start=1988
World Integrated Trade Solution database. (2020). World Bank. https://wits.worldbank.org/
World Trade Organization (2019) World Tariff Profiles 2019. https://www.wto.org/english/res_e/booksp_e/tariff_profiles19_e.pdf