_ Yuri Kofner, junior economist, MIWI – Institute for Market Integration and Economic Policy. Munich, February 2020. First published in: Vol 4 No 20 (2019): Trade policy.
In 2019 the EAEU officially celebrated its five-year anniversary. How was the Union’s aggregate economic performance over the past five years, i.e. from 2014 to 2018? And, during the study period, did the EAEU move closer towards macroeconomic stability and macroeconomic convergence.
Economic growth and sustainability
While the EAEU’s real GDP fell from 2.4 trln in 2014 to 1.9 trln in 2018, its GDP by purchasing power parity (PPP) actually grew from USD4.4 trln to USD4.7 trln (Chart 1, Table 1). This discrepancy in numbers can be explained by a sharp devaluation of the national currencies of the member states against the US USD in 2014-2015 (Chart 2, Table 2).
Chart 1. EAEU GDP (2014-2018; nominal, real and by PPP; trillion USD)
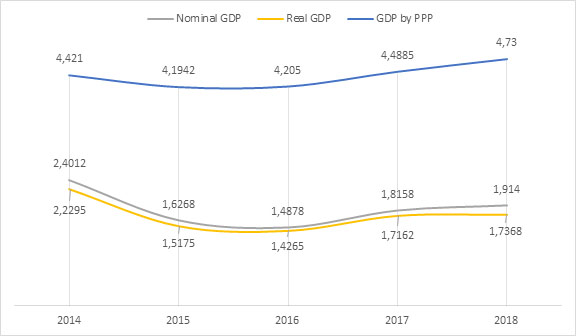

Source: [14, p. 391, and author’s calculations].
Chart 2. EAEU member states annual average exchange rate change (2014-2018, units of national currency against the US USD, % change y.o.y.) *1 July 2016 Belarus changed the denomination of the Belarusian ruble by a ratio of 1:10 000.
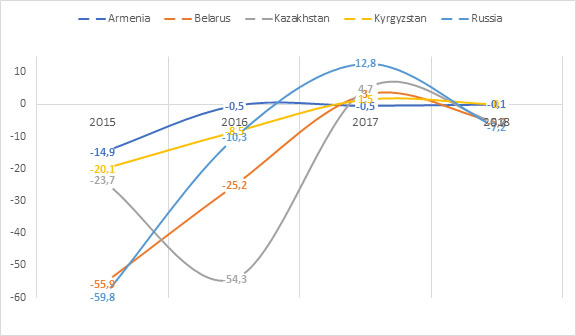

Source: [14, p. 362, and author’s calculations].
In 2014-2015 the Union’s largest economy – Russia – was hit by several adverse factors: the Ukrainian crisis, international sanctions and a drop in oil prices, which also directly affected Kazakhstan. This led to a recession in the Russian Federation, and consequently in the other member states, which rely on the remittances and consumption from Russia. In 2015 its economy contracted by 2.5%, that of Belarus by 3.8%. By 2016 Armenia’s GPD growth rate slowed down to 0.2%. However, from 2017 onwards the Eurasian economies recovered again. In that year the EAEU’s GDP growth rate reached 1.9%, in 2018 – already 2.5% (Chart 3, Table 3).
Chart 3. EAEU annual GDP growth rate (2014-2018, index of physical volume of GDP, % change y.o.y.)
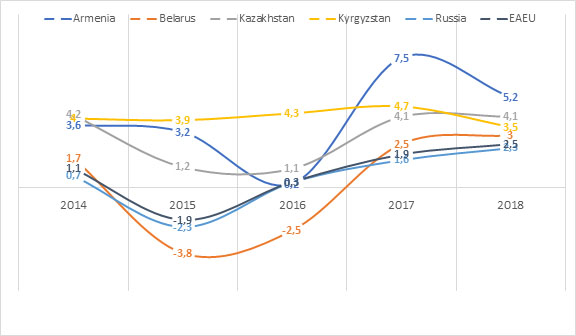

Source: [14, p. 146].
The average growth rate of the Union during the past five years was at 0.8%. This was very low for a group of developing and emerging economies, for whom the average GDP growth rate was around 3.5 to 7% during that period. Even the developed economies grew faster, such as the EU and the USA, which had an average growth rate of 2.1 and 2.4%, correspondingly. Only South America had a comparable low growth rate (Chart 4, Table 4).
Chart 4. EAEU’s GDP growth rate in comparison (2014-2018, % change y.o.y.)
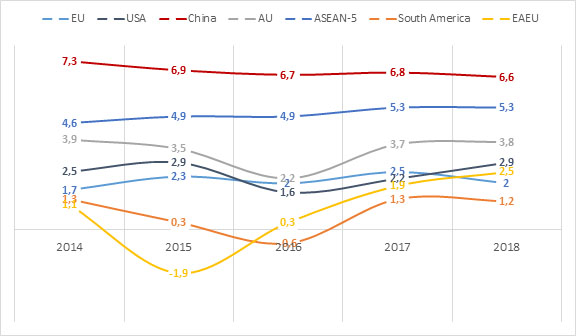

Source: [14, p. 391, and author’s calculations].
The German ifo Institute for Economic Research predicts that, despite the global economic cooldown, Russia’s economy will grow by 2.6% in 2020 and even by 3% in 2021. Russian GDP growth is estimated to be higher than that of Turkey, South Korea, Latin America and the Western countries, which are expected to grow by around 1.7% to 2.4%. As reasons for the relative lively economic upswing, the Munich economists name further interest rate cuts by the Russian Central Bank, which are expected for the coming months, and, above all, a planned expansion of the national fiscal policy. As part of a program for additional investment in infrastructure, health care and the education system, which runs until 2024, the budget will provide funding of around USD40 bln or 1.5% of the country’s GDP. As a result, economic expansion in Russia is expected to strengthen during the forecast period. However, due to the slowdown in the international economy and the new OPEC-Plus agreement, which foresees a reduction in oil production, exports are unlikely to increase during the forecast period. Also, no broad recovery in private investment is expected, – the research publication states. [1, p. 5]
The EAEU’s GDP per capita by purchasing power parity grew from USD24 686 in 2014 to USD25 740 in 2018. That is an increase of USD1 054 per citizen or 4.3% over the past five years in total with an average growth rate of 1.2% (Chart 5, Table 5).
Chart 5. EAEU GPD per capita (2014-2018, USD)
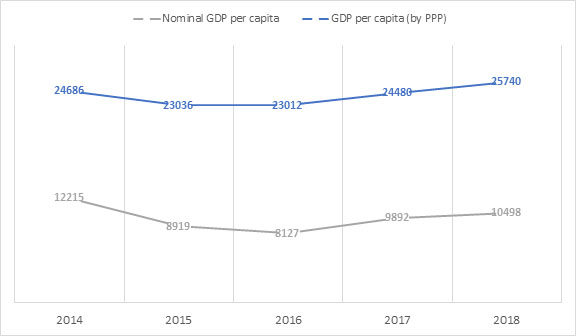

Source: [14, p. 397, and author’s calculations].
The more equal the contribution of the member states to the overall GDP of an integration bloc, the better for its sustainable economic development. Unfortunately, as already said, the EAEU is very dependent on Russia’s economic performance and its role remained high during that period: 86.7% in 2014 and 86.8% in 2018 (Chart 6, Table 6). However, it is worth noting that the large weight of one of the member states is common for many other regional integrations, including USMECA and MERCOSUR. [2, p. 150]
Chart 6. EAEU GDP structure by member state (2014-2018, % of total)
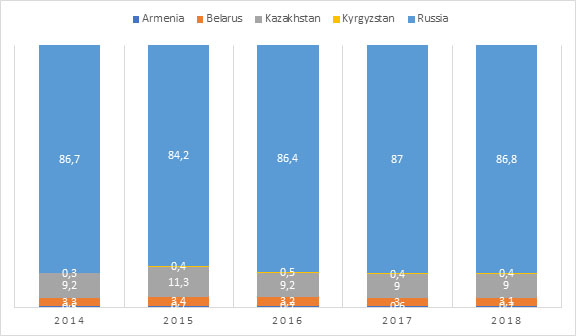

Source: [14, p. 391, and author’s calculations].
Macroeconomic stability
Macroeconomic convergence is a very important factor for the sustainable economic development of a given integration bloc. According to the EAEU Treaty, the member states must conduct a “coordinated” exchange rate policy (Article 64), as well as an agreed macroeconomic policy with the following “convergence criteria” (Articles 62, 63):
- the annual deficit of the consolidated budget of a state-controlled sector shall not exceed 3% of GPD;
- the government debt shall not exceed 50% of GDP;
- the inflation rate (consumer price index) per annum shall exceed the inflation rate in the member state with the lowest value by not more than 5%.
Currently, the introduction of a single currency is not planned. Instead, the member states agreed to establish a common financial market (Article 70) together with a “supranational financial regulator” by 2025. These relatively moderate aims of monetary integration in the EAEU, as compared to that of the EU, can be explained by the current trends and developments of the financial markets, monetary policies and macroeconomic conditions in the EAEU region.
The inflation rates in the EAEU member states are relatively high, with an average inflation rate of 7.5% in the EAEU over the past five years (2014-2018). During the past five years Belarus overshot the inflation convergence criteria three times (by 10.1 pp. in 2014, by 4.8 pp in 2015 and by 8.2 pp in 2016), Kazakhstan two times (by 11 pp in 2016, by 1.4 pp in 2017) and Russia two times (by 6.8 pp in 2015, by 3.5 pp in 2016). In 2016 Armenia experienced a deflation rate of -1.4%. In 2018 all the EAEU member states met the inflation convergence criteria (Chart 7, Table 7).
Chart 7. EAEU inflation rate (2014-2018, % change y.o.y.)
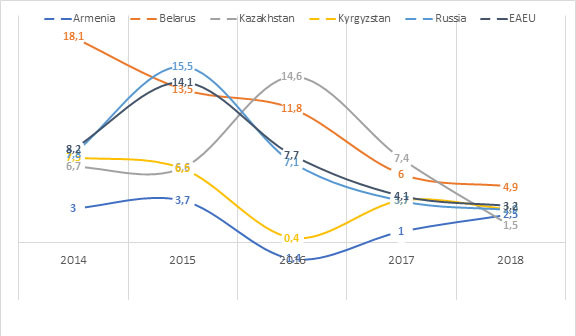

Source: [14, p. 116].
No common monetary policy aim, e.g. price stability, is stipulated in the EAEU Treaty. The EAEU member states conduct different monetary policy regimes, but with relatively similar equivalent mid-term inflation targets: Armenia (inflation targeting at 4%), Belarus (monetary targeting at 5%), Kazakhstan (price stability set as the aim with an operational inflation target of 3-4%), Kyrgyzstan (price stability set as the aim with an operational inflation target of 5-7%), Russia (inflation targeting at 4%) [3, p. 3].
Except for Belarus, which always had a sound budget surplus, all of the four other EAEU member states missed the budget deficit convergence criteria at some point during the last five years: Armenia (by 1.8 pp in 2015, by 2.5 pp in 2016, by 1.8 pp in 2017), Kazakhstan (by 1.4 pp in 2016, by 1.2 pp in 2017), Kyrgyzstan (by 1.5. pp in 2016), Russia (by 0.4 pp in 2015 and by 0.7 pp in 2016). Again in 2018 all EAEU member states met this criterion (Chart 8, Table 8).
Chart 8. EAEU budget deficit (2014-2018, % in relation to GDP)
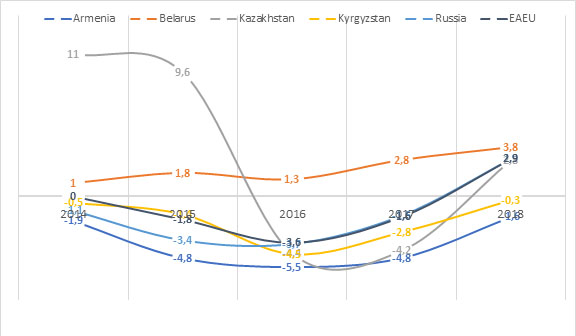

Source: [14, p. 374 and author’s calculations].
Over the past five years the EAEU as a whole had a comparatively low average government debt of 12.5% of the Union’s GDP. Only Armenia and Kyrgyzstan didn’t meet the government debt convergence criteria. From 2016 on Armenia exceeded the acceptable level by 7 pp in average and Kyrgyzstan by 9 pp in average during the whole period. Both were able to slightly decrease their excess by the end of the period (Chart 9, Table 9).
Chart 9. EAEU government debt (2014-2018, % in relation to GDP)
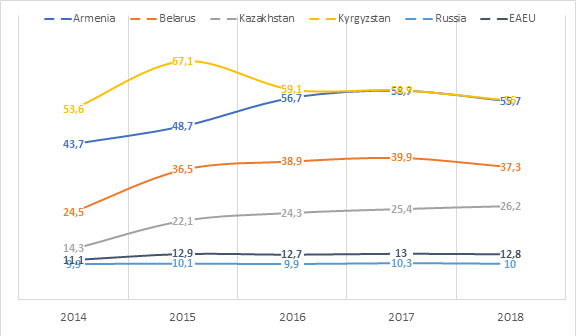

Source: [14, p. 386 and author’s calculations].
The EAEU Treaty does not set the aim that the member states should fix or peg their national currencies to the ruble or to an EAEU currency basket, but in Annex 15 of the EAEU Treaty it is stipulated that their “exchange rate policies shall be coordinated by an independent authority consisting of the heads of national (central) banks of the member states determined under an international treaty within the Union”. In June 2019, the EEC Board approved the draft “Agreement on the Establishment of an Advisory Council on the Exchange Policy of the EAEU member states”.
As for now, the EAEU member states conduct different exchange rate regimes: Armenia (officially free float, de-facto pegged to the US dollar), Belarus (managed free float), Kazakhstan (in 2014 changed from pegged to free float), Kyrgyzstan (managed free float), Russia (free float) [4, p. 24].
During the past five years we saw diverging national exchange rates tendencies, with that of Belarus, Kazakhstan and Russia devaluating by 18.8%, 19.8% and 11.7% respectively (in relation to an international currency basket with 2010 as the basis year), while that of Armenia and Kyrgyzstan were revaluating by 4.5% and 14.5% respectively. Despite of this divergence, the exchange rates of all the four other EAEU member states depend more or less on the course of the Russian ruble. The exchange rates of the Russian ruble and of the Kazakhstani tenge themselves are strongly influenced by the international oil price (Chart 10, Table 10).
Chart 10. Influence of the international oil price on the real effective exchange rate of the Russian ruble and Kazakhstani tenge against foreign currencies (in % in relation 2010 = 100%, Brent average annual oil price at USD per barrel, 2014-2018)
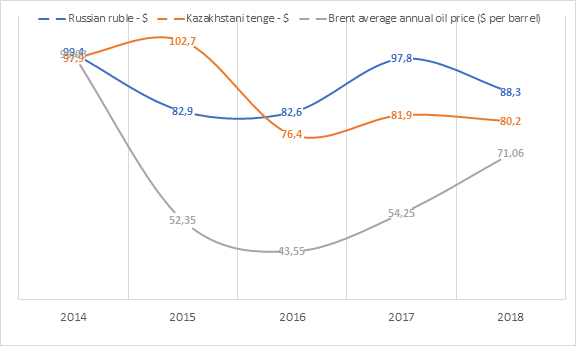

Source: [14, p. 362].
Dollarization of the financial markets, internal and external trade is considered a major challenge in the EAEU, it seriously impairs the effectiveness of the monetary transmission process. In 2016 in the EAEU on average 45% of the deposits and almost 60% of liabilities were held in US USD. In the EU these indicators were 22% and 14% respectively. Also, external trade with third parties and internal trade between EAEU members states, except with Russia, is conducted mainly in USD and EUR [5, p. 6].
A recently published study by the Eurasian Economic Commission, which compares the degree of integration of various regional economic blocs, has shown, that the EAEU increased its macroeconomic convergence from 56% in 2014 to 59% in 2017. In this aspect it came second to the EU, which achieved a macroeconomic convergence of 91% in 2017, but was ahead of both ASEAN (33%) and MERCOSUR (34%). [6, p. 73] Deeper macroeconomic convergence within the EAEU might be achieved if, similar to the system in the EU, the EEC would be given the right to impose sanctions on member states that violate the criteria.
At the beginning of 2019, the Eurasian Economic Commission published a report that analyzes the positions of the EAEU member states in 16 international ratings, which assess various spheres of economic development for the period from 2010 to 2018. According to the study, the EAEU overall occupies the highest positions (index values) in macroeconomic stability:
- Reliable money: money supply growth – 8.66 on a 10-point scale, standard deviation of inflation – 8.83 on a 10-point scale (Fraser Institute Index of Economic Freedom);
- Credit market regulation: loans to individuals – 8.48 on a 10-point scale, control over interest rates – 9.84 on a 10-point scale (Fraser Institute Index of Economic Freedom) [7, p. 25] ;
- State of the fiscal system: 87.2 points on a 100-point scale (Heritage Foundation Index of Economic Freedom) [7, p. 29].
Conclusion
In general, the following conclusions can be drawn in response to the question of whether the Eurasian Economic Union managed to ensure the stability and convergence of the levels of macroeconomic development of its member states during its first five-year period:
Firstly, evaluating the member states by levels of socio-economic development and the degree of their macroeconomic convergence with each other, the EAEU appears as a “two-tier” economic integration bloc. On the one hand, the EAEU initiating countries – Belarus, Kazakhstan and Russia, form a “core” integration project, where the macroeconomic convergence between them is quite noticeable. On the other hand, the newer and smaller member states – Armenia and Kyrgyzstan, lag behind this “core” in terms of both the level and the speed of convergence. In the medium term, one can hardly expect a change in this trend.
In this regard, for the further development of a coherent macroeconomic policy, the EEC and member states should not chase after some symbolic unity of indicators, behind which real distortions may lie. Instead, they should strive to implement a purely pragmatic policy, which would maximally meet the national interests of all of the member states and would provide them both comparative and absolute integration benefits. Here, further research on the implementation of optimal “multi-speed integration” would be advisable, especially since in recent years this concept has been widely discussed in the European Union [13, p. 8].
Secondly, although between 2014 and 2018 all member states in different years missed the convergence criteria in one area or another, they still generally improved their performance by the end of the study period due to a partial restoration of the regional economic cycle in 2017-2018. Especially noticeable was the convergence of inflation rates, which is partially due to a voluntary coordination and an increased efficiency of the monetary policies of the Union member states.
Thirdly, in order to achieve a sustainable coordinated economic development of the EAEU member states, further improvement of the organizational and institutional environment in this area will be required. One of the right steps in this direction will be the establishment of the “Advisory Council of the National (Central) Banks on the EAEU exchange rate policy”. Furthermore, the creation of advisory councils between the national (central) banks and national governments on inflation, budget deficit and public debt would be advisable. These inter-central bank / intergovernmental coordinating bodies on monetary policy could be located on the premises of the EAEU supranational financial regulator, which is to be set up by 2025 in Kazakhstan. And all fiscal policy coordinating bodies could be located either in Yerevan or in Bishkek.
A more concrete specification of the goals, objectives and mechanisms for pursuing a coherent macroeconomic policy would also be required. E.g., in the monetary sphere, the Union central banks could consider the feasibility of a common inflation (price stability) target of 4 percent.
In the longer term, purely voluntary interstate coordination without any supranational levers on the national governments and central banks is unlikely to be sufficient for a more sustainable macroeconomic integration in the future. Looking at the European Union, one might consider the possibility of granting the Eurasian Economic Commission or the future supranational financial regulator in Nursultan the right to impose financial sanctions on member states that violate the convergence criteria. Here it would be important to create both a warning mechanism and a corrective one.
Appendix
Table 1. EAEU GDP (2014-2018; nominal, real and by PPP; bln USD)
| 2014 | 2015 | 2016 | 2017 | 2018 | |
| Nominal GPD | 2 401.2 | 1 626.8 | 1 487.8 | 1 815.8 | 1 914.0 |
| GPD deflator | 107.7 | 107.2 | 104.3 | 105.8 | 110.2 |
| GDP deflator/100 | 1.077 | 1.072 | 1.043 | 1.058 | 1.102 |
| Real GDP | 2 229.5 | 1 517.5 | 1 426.5 | 1 716.2 | 1 736.8 |
| GDP by purchasing power parity (PPP) | 4 421.0 | 4 194.2 | 4 205.0 | 4 488.5 | 4 730.0 |
Source: [14, p. 391 and authors calculations].
Table 2. EAEU member states annual average exchange rate change (2014-2018, units of national currency against the US USD, % change y.o.y.)
| 2014 | 2015 | 2016 | 2017 | 2018 | |
| Armenia | – | -14.9 | -0.5 | -0.5 | -0.1 |
| Belarus | – | -55.9 | -25.2 | 3.0 | -5.7 |
| Kazakhstan | – | -23.7 | -54.3 | 4.7 | -5.8 |
| Kyrgyzstan | – | -20.1 | -8.5 | 1.5 | -0.0 |
| Russia | – | -59.8 | -10.3 | 12.8 | -7.2 |
Source: [14, p. 362]. *1 July 2016 Belarus changed the denomination of the Belarusian ruble by a ratio of 1:10 000.
Table 3. EAEU annual GDP growth rate (2014-2018, index of physical volume of GDP, % change y.o.y.)
| 2014 | 2015 | 2016 | 2017 | 2018 | |
| Armenia | 3.6 | 3.2 | 0.2 | 7.5 | 5.2 |
| Belarus | 1.7 | -3.8 | -2.5 | 2.5 | 3.0 |
| Kazakhstan | 4.2 | 1.2 | 1.1 | 4.1 | 4.1 |
| Kyrgyzstan | 4.0 | 3.9 | 4.3 | 4.7 | 3.5 |
| Russia | 0.7 | -2.3 | 0.3 | 1.6 | 2.3 |
| EAEU | 1.1 | -1.9 | 0.3 | 1.9 | 2.5 |
Source: [14, p. 146].
Table 4. EAEU’s GDP growth rate in comparison (2014-2018, % change y.o.y.)
| 2014 | 2015 | 2016 | 2017 | 2018 | Five-year average | |
| EU | 1.7 | 2.3 | 2.0 | 2.5 | 2.0 | 2.1 |
| USA | 2.5 | 2.9 | 1.6 | 2.2 | 2.9 | 2.4 |
| China | 7.3 | 6.9 | 6.7 | 6.8 | 6.6 | 6.9 |
| African Union | 3,9 | 3,5 | 2,2 | 3,7 | 3,8 | 3.4 |
| ASEAN-5 | 4.6 | 4.9 | 4.9 | 5.3 | 5.3 | 5.0 |
| South America | 1.3 | 0.3 | -0.6 | 1.3 | 1.2 | 0.7 |
| EAEU | 1.1 | -1.9 | 0.3 | 1.9 | 2.5 | 0.8 |
Source: [14, p. 391].
Table 5. EAEU GPD per capita (2014-2018, USD)
| 2014 | 2015 | 2016 | 2017 | 2018 | |
| Armenia | 3 852 | 3 512 | 3 524 | 3 869 | 4188 |
| Belarus | 8 289 | 5 829 | 4 997 | 5 729 | 6283 |
| Kazakhstan | 12 807 | 10 510 | 7 715 | 9 030 | 9 462 |
| Kyrgyzstan | 1 331 | 1 163 | 1 179 | 1 296 | 1 332 |
| Russia | 14 252 | 9 356 | 8 765 | 10 753 | 11 312 |
| EAEU | 13 215 | 8 919 | 8 127 | 9 892 | 10 408 |
| EAEU (PPP) | 24 686 | 23 036 | 23 012 | 24 480 | 25 740 |
| EAEU(PPP, % change y.o.y.) | – | -6.7 | -0.1 | 6.4 | 5.1 |
Source: [14, p. 397 and authors calculations].
Table 6. EAEU GDP structure by member state (% of total)
| 2014 | 2015 | 2016 | 2017 | 2018 | |
| Armenia | 0.5 | 0.7 | 0.7 | 0.6 | 0.7 |
| Belarus | 3.3 | 3.4 | 3.2 | 3.0 | 3.1 |
| Kazakhstan | 9.2 | 11.3 | 9.2 | 9.0 | 9.0 |
| Kyrgyzstan | 0.3 | 0.4 | 0.5 | 0.4 | 0.4 |
| Russia | 86.7 | 84.2 | 86.4 | 87.0 | 86.8 |
| EAEU | 100.0 | 100.0 | 100.0 | 100.0 | 100.0 |
Source: [14, p. 391 and author’s calculations].
Table 7. EAEU inflation rate (2014-2018, % change y.o.y.)
| 2014 | 2015 | 2016 | 2017 | 2018 | |
| Armenia | 3.00 | 3.7 | -1.4 | 1.0 | 2.5 |
| Belarus | 18.1 | 13.5 | 11.8 | 6.0 | 4.9 |
| Kazakhstan | 6.7 | 6.6 | 14.6 | 7.4 | 1.5 |
| Kyrgyzstan | 7.5 | 6.5 | 0.4 | 3.7 | 2.9 |
| Russia | 7.8 | 15.5 | 7.1 | 3.7 | 2.9 |
| EAEU | 8.2 | 14.1 | 7.7 | 4.1 | 3.2 |
Source: [14, p. 116].
Table 8. EAEU budget deficit (2014-2018, % in relation to GDP)
| 2014 | 2015 | 2016 | 2017 | 2018 | |
| Armenia | -1.9 | -4.8 | -5.5 | -4.8 | -1.6 |
| Belarus | 1.0 | 1.8 | 1.3 | 2.8 | 3.8 |
| Kazakhstan | 11.0 | 9.6 | -4.4 | -4.2 | 2.8 |
| Kyrgyzstan | -0.5 | -1.4 | -4.5 | -2.8 | -0.3 |
| Russia | -1.1 | -3.4 | -3.7 | -1.5 | 2.9 |
| EAEU | 0 | -1.8 | -3.6 | -1.6 | 2.9 |
Source: [14, p. 374 and author’s calculations].
Table 9. EAEU government debt (2014-2018, % in relation to GDP)
| 2014 | 2015 | 2016 | 2017 | 2018 | |
| Armenia | 43.7 | 48.7 | 56.7 | 58.7 | 55.7 |
| Belarus | 24.5 | 36.5 | 38.9 | 39.9 | 37.3 |
| Kazakhstan | 14.3 | 22.1 | 24.3 | 25.4 | 26.2 |
| Kyrgyzstan | 53.6 | 67.1 | 59.1 | 58.9 | 56.0 |
| Russia | 9.9 | 10.1 | 9.9 | 10.3 | 10.0 |
| EAEU | 11.1 | 12.9 | 12.7 | 13.0 | 12.8 |
Source: [14, p. 386 and author’s calculations].
Table 10. Real effective exchange rate of the national currencies of the EAEU member states against foreign currencies (in % in relation 2010 = 100%)
| 2014 | 2015 | 2016 | 2017 | 2018 | |
| Armenia | 102.5% | 108.4% | 107.6% | 104.0% | 104.5% |
| Belarus | 95.8% | 92.4% | 84.7% | 80.7% | 81.2% |
| Kazakhstan | 97.9% | 102.7% | 76.4% | 81.9% | 80.2% |
| Kyrgyzstan | 110.0% | 115.1% | 113.2%% | 113.3% | 114.5% |
| Russia | 99.4% | 82.9% | 82.6% | 95.7% | 88.3% |
| Brent average annual oil price (USD per barrel) | 99.03 | 52.35 | 43.55 | 54.25 | 71.06 |
Source: [14, p. 362]
References
- ifo Schnelldienst 19/2019. URL: https://www.ifo.de/publikationen/2019/zeitschrift-einzelheft/ifo-schnelldienst-192019
- Vinokurov, E. (2018). Introduction to the Eurasian Economic Union. Palgrave Macmillan.
- EEC, EDB (2017). Monetary Policy of EAEU Member States: Current Status and Coordination Prospects. URL: https://eabr.org/en/analytics/integration-research/cii-reports/monetary-policy-of-eaeu-member-states-current-status-and-coordination-prospects/
- EDB (2017). Exchange Rate Fluctuations within the EAEU in 2014–2015: Analysis and Recommendations. URL: https://eabr.org/en/analytics/integration-research/cii-reports/exchange-rate-fluctuations-within-the-eaeu-in-2014-2015-analysis-and-recommendations/
- Valdai Club (2018). De-Dollarization in the EAEU: Experience and Prospects. Working Paper Nr. 83. // http://greater-europe.org/archives/4573
- EEC (2019). Integration indicators. URL: http://eurasian-studies.org/archives/12589
- EEC (2019). The economic development of the Eurasian Economic Union and the Member States in 2018: international ratings. Analytical report. (In Russian). // http://eurasian-studies.org/archives/12589
- For example see: Scharpf Fritz W. (2018). There Is an Alternative: A Two-Tier European Currency Community. MPIfG Discussion Paper 18/7. Max Planck Institute for the Study of Societies. URL: http://www.mpi-fg-koeln.mpg.de/pu/mpifg_dp/2018/dp18-7.pdf
- EEC (2019). Statistical Yearbook of the Eurasian Economic Union. URL: http://www.eurasiancommission.org/ru/act/integr_i_makroec/dep_stat/econstat/Documents/Stat_Yearbook_2019.pdf