_ Yuri Kofner, junior economist, MIWI – Institute for Market Integration and Economic Policy. Munich, 11 December 2020.
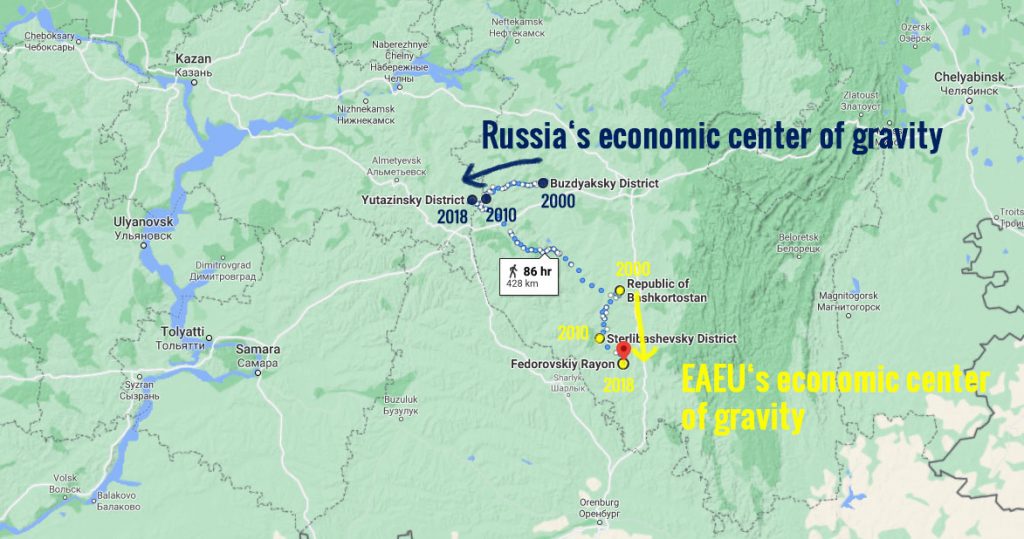
Over the past near 20 years, from 2000 to 2018, the economic center of gravity of the Eurasian Economic Union (EAEU, formerly EurAsEC), remained in the Republic of Bashkortostan (part of the Russian Federation) near the cities of Sterlitamak and Salavat. The EAEU’s economic center of gravity moved over 73 km south – away from Ufa towards Orenburg, which indicates the relative growth of Kazakhstan’s economic weight in the integration block. Worryingly, the economic center of gravity has practically not shifted east, which suggests that Moscow could not reduce the output slope between the European part of Russia and its vast Siberian and Far Eastern regions.
Map 1. The economic centers of gravity of Russia and the EAEU (2000, 2010, 2018, Google maps)
Methodology and data
These are the results of a study that calculates the economic center of gravity based on the regional and national GDP of the EAEU member states (Armenia, Belarus, Kazakhstan, Kyrgyzstan and the eight federal districts of the Russian Federation), weighted by the geographic location of their respective largest cities, according to the following two formulas:
(Formula 1) Latitude = ∑BIP * Latitude / ∑BIP
(Formula 2) Longitude = ∑BIP * longitude * cos (latitude * π / 180) / ∑BIP * cos (latitude * π / 180)
The methodology of this study is taken from (Kauder 2020), who estimated the movement of the economic center of the European Union between 2000 and 2018.
As data input the author used the national GDP indicators of Armenia, Belarus, Kazakhstan, and Kyrgyzstan provided by the (World Bank 2020) as well as the regional GDP of the eight federal districts of the Russian Federation provided by the Russian Federal Statistics Agency. All GDP estimates were harmonized in USD in constant prices in the base year 2010 to exclude exchange rate distortions.
For the geographical coordinates of the districts and countries, the author used neither the geographic center nor the regional capital, but rather the latitude and longitude coordinates of their respective largest city. This was done to represent the economic center of each region more accurately, which is especially important in the case of expansive regions such the Siberian and the Far Eastern districts.
The study identified and documented the movement of the EAEU’s (formerly EurAsEC’s) economic center between the years 2000, 2010, and 2018.
Interpretation
Over the entire studied period, the economic center of gravity of the EAEU was located in the Republic of Bashkortostan south of Ufa and north of Orenburg, next to, but along the western side of the Ural ridge.
Tab. 1. The economic centers of gravity of Russia and the EAEU (2000, 2010, 2018, latitude and longitude)
| 2000 | 2010 | 2018 | |
| RUS | 54.8206,54.5587 | 54.7068,53.6693 | 53.168,55.5991 |
| EAEU | 53.8231,55.6325 | 53.4084,55.2725 | 54.7028,53.4549 |
Russia made up the predominant share in the geographical structure of the EAEU’s GDP: in 2018, its share was 86 percent. The rest of the member states formed less than one sixth of the union’s economy (14 percent).
The largest regions in terms of economic weight, both within the Russian Federation and in the EAEU, are the Central (30 percent), Volga (13 percent) and Ural (13 percent) federal districts, which explains the location of the EAEU economic center in Bashkiria.
In 2018, the Trans-Ural federal districts (Ural, Siberian and Far East) accounted for less than one third of the EAEU economy (26.6 percent).
Tab. 2. GDP/GRP share in the GDP structure of the EAEU (2000, 2010, 2018, in percent)
| 2000 | 2010 | 2018 | |
| ARM | 0.4 | 0.5 | 0.6 |
| BLR | 2.7 | 3.3 | 3.1 |
| KAZ | 6.3 | 8.5 | 10.1 |
| KGZ | 0.3 | 0.3 | 0.3 |
| RUS (in total) | 90.3 | 87.4 | 85.9 |
| RUS CFD | 28.9 | 31.2 | 29.7 |
| RUS NW FD | 9.1 | 9.1 | 9.1 |
| RUS SFD | 5.2 | 5.4 | 5.9 |
| RUS NK FD | 1.7 | 2.1 | 2.0 |
| RUS VFD | 16.3 | 13.2 | 12.6 |
| RUS UFD | 13.6 | 11.9 | 12.9 |
| RUS SIB FD | 10.0 | 8.9 | 8.4 |
| RUS FE FD | 5.7 | 5.6 | 5.3 |
Over the past 20 years. the economic center of gravity of the Russian Federation has also been in Bashkiria, but it has clearly moved 73 km to the west, which means that Moscow has failed to raise the economic development of Siberia and the Far East to the level of the European part of Russia. From 2000 to 2018. the share of the Trans-Urals federal districts in the union’s GDP decreased from 29.2 to 26.6 percent.
The economic center of gravity of the entire Eurasian Economic Union was between 130 km in 2000 to 222 km in 2018 southeast from the Russian economic center, which indicates the relative weight of Kazakhstan in the integration block.
Overall, the EAEU’s economic center of gravity moved over 73 km south – away from Ufa towards Orenburg (4.1 km on average annually). This is due, firstly, as already said, to Kazakhstan‘s increasing weight in the union: its share in the EAEU GDP increased from 6 to 10 percent over this period. And also, secondly, thanks to the economic growth of Russia’s southern regions – the Southern and North-Caucasian federal districts. Their share in the union’s GDP increased from 7 to 9 percent during the study period.
If this trend continues exactly the same way and at the same speed, then in 2060 Orenburg will have every right to call itself the economic center (of gravity) of Eurasia.
Tab. 3. Annual average GDP/GRP growth rates (2000. 2010. 2018. in percent)
| 2000-2010 | 2010-2018 | |
| ARM | 11.5 | 5.1 |
| BLR | 10.4 | 1.1 |
| KAZ | 12.1 | 4.7 |
| KGZ | 5.0 | 5.5 |
| RUS (in total) | 6.0 | 1.8 |
| RUS CFD | 7.9 | 1.3 |
| RUS NW FD | 6.7 | 2.0 |
| RUS SFD | 7.3 | 3.3 |
| RUS NK FD | 10.7 | 1.3 |
| RUS VFD | 3.5 | 1.3 |
| RUS UFD | 4.5 | 3.3 |
| RUS SIB FD | 4.7 | 1.3 |
| RUS FE FD | 6.4 | 1.1 |
In the decade between 2000 and 2010. the fastest-growing economies in the Eurasian space were Kazakhstan (12.1 percent on average annually), Armenia (11.5 percent), the North Caucasus Federal District (10.7 percent), and Belarus (10.4). The GRP of the Volga Federal District grew the slowest: by 3.5 percent on average annually.
In the period between 2010 and 2018. the economic growth rates in the Eurasian countries and regions of the EAEU were generally lower. The fastest growing economies during this period were the economies of Kyrgyzstan (5.5 percent), Armenia (5.1 percent), Kazakhstan (4.7 percent), as well as the Southern and Ural federal districts (both 3.3 percent). It is alarming that despite the efforts of the federal authorities to raise the level of economic development of the Russian Far East, its average annual GRP growth rate was the lowest among those studied and amounted to only 1.1 percent.