_ Martin Larch, Head of Secretariat, European Fiscal Board; Stefano Santacroce, Economist, Secretariat of the European Fiscal Board. Brussels, 24 September 2020.
The urgent need to respond to the unprecedented economic shock resulting from the Covid-19 pandemic has relegated the review of EU fiscal rules to the background. However, the question of whether and how to review the Stability and Growth Pact will soon re-emerge as a key topic in the policy debate, not least in light of the very sharp increase in government debt levels. This article presents a new database from the Secretariat of the European Fiscal Board that tracks numerical compliance with the SGP. It offers valuable insights into which rules worked or not for which group of countries and under what circumstances. The database is available to the research community and can inform any future attempt to improve the current fiscal framework of the EU.
Compliance with the rules of the Stability and Growth Pact (SGP) is not an end in itself. It is meant to safeguard the smooth functioning of the Economic and Monetary Union (EMU) and to contribute to the overall stability of the euro area. In the EMU, monetary policy is delegated to the ECB, while fiscal policy remains in the hands of individual member states. To avert cross-border spillovers from national budgets, governments agreed to impose limits on their fiscal policy discretion.1
When the SGP entered into force in the late 1990s, its implementation essentially revolved around one rule, which asks countries to attain sound medium-term budgetary positions. If the budget deficit exceeds 3% of GDP, the EU can request corrections. The SGP also requires member states to keep gross government debt below 60% of GDP or to diminish the excess over that value at a satisfactory pace. However, the debt rule did not play much of a role in the early days because average rates of nominal GDP growth of around 5% per year meant that countries complying with the deficit rule would also be in line with the one for the debt.
Successive reforms of the SGP added new rules and clarified existing ones, mostly with the intent to add more economic rationale. The main expectation inspiring the reforms was that smarter rules, including country-specific elements, would enhance ownership and compliance.
The secretariat of the European Fiscal Board has collected information on whether and how EU member states complied with the rules of the SGP.2 The results of our analysis are mixed. The expected nexus between smarter and country-specific rules, on the one hand, and compliance on the other is not confirmed, at least not across the board. In an important group of countries, government debt levels and forward-looking sustainability assessments have not improved and fiscal policy interventions remained largely pro-cyclical.3 The debate on whether and how to mend the SGP has been going on for some time (e.g. Bénassy-Quéré et al. 2018, Feld et al. 2018). It has taken a backseat in the wake of the Covid-19 pandemic but will regain prominence soon. Our database is available here and can inform any future analysis and attempt to improve the EU’s fiscal framework.
Main features of the new database
The SGP consists of an intricate set of legal provisions complemented by a plethora of established precedents and practice.4 In view of the considerable degree of discretion allowed by the rules, establishing formal compliance with the SGP is an exceedingly challenging exercise, involving lots of political judgement.
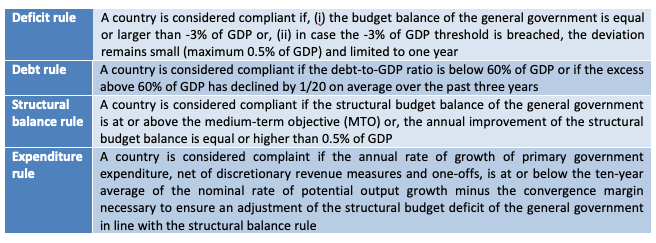
Our database focuses on numerical compliance. Abstracting from margins of discretion allowed by the letter or spirit of the law and established practice, we assess whether the relevant fiscal aggregates – the budget balance, the debt-to-GDP ratio or government expenditure – evolve within or outside the quantitative perimeters defined by the four main rules of the SGP (Table 1).
Table 1 Definitions of fiscal rules underpinning the compliance database of the EFB Secretariat

Starting in 1998, we compute a qualitative and a quantitative indicator of compliance for each rule. The qualitative indicator is a simple binary variable, which takes the value 1 to signal compliance and 0 otherwise. The quantitative indicator measures the deviation, in percent of GDP, from the numerical constraint imposed by the rule. A positive value indicates an overachievement; a negative value a shortfall. We calculate the qualitative and quantitative indicators of compliance for all EU countries starting in 1998, the year after the two main regulations of the SGP entered into force. For countries that joined the EU after the inception of the SGP and for rules introduced after 1997, our compliance scores are hypothetical but still of interest. They tell us how actual fiscal performance compared to the requirements of the SGP, and more importantly, whether compliance changed significantly ones a country joined the EU or a rule was introduced.
Main facts and trends
Our database supports a number of important findings:
- On average – across all countries, years and rules – budgetary policies have been compliant in just over half of the cases (Figure 1), i.e. following the rules is as common as not following them. This finding is broadly in line with the literature.5
- There are significant and largely persistent differences across countries (Figure 1). Compliance scores range from two-thirds or more in Luxembourg, Sweden, Denmark, Bulgaria, Finland, Ireland and Estonia, to one-third or less in Portugal, Greece, Italy and France.
Figure 1 Average compliance with fiscal rules across countries, 1998-2019

Source: European Commission, own calculations
- Countries with a lower compliance score exhibit larger average deviations from the rules. While this may seem obvious, one could equally imagine a situation in which non-compliance happens by small margins. However, our database excludes this possibility.
- Compliance is a very good predictor of government debt dynamics. Countries with a lower compliance score are associated with a stronger increase in the debt-to-GDP ratio.
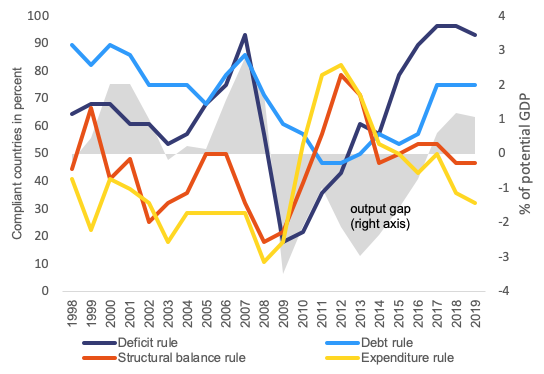
- Compliance differs markedly across rules. It tends to be higher for the two ‘nominal rules’, i.e. the deficit and the debt rule (Figure 2). Of course, the structural budget balance and the expenditure rule were introduced later, respectively in 2005 and 2011, and did not formally bind budgetary policies before. But the differences across rules nicely illustrates the shortcoming of the deficit and debt rule in ensuring sustainable public finances.
Figure 2 Average compliance with each fiscal rule and output gap developments, EU, 1998-2019

Source: European Commission, own calculations
Some noteworthy correlations
Our database also highlights some noteworthy correlations with a number of key macroeconomic and institutional variables:
- Compliance scores reveal the notorious tendency to run pro-cyclical policies. Fiscal policy loosens when cyclical improvements in government deficit and debt offer a sense of safety; it tightens when an economic downturn reveals the ‘true’ state of public finances. Although this pattern was meant to be addressed by the structural balance and the expenditure rule, it recurs in our sample (Figure 2). In the run-up to the 2008-2009 crisis, many EU countries did not make use of good times to build fiscal buffers. Low headline balances and declining debt-to-GDP ratios were interpreted as evidence of healthy public finances. Signals from other gauges were ignored.6 The recovery years ahead of the Covid-19 pandemic are very similar: compliance with rules that exhibit a cyclical pattern improved, while compliance with rules designed to adjust for the cycle deteriorated.
- As a corollary of the previous point, better compliance with rules designed to keep fiscal policy on a stabilising path over the cycle is on average associated with a lower number of pro-cyclical fiscal episodes (Figure 3).7
Figure 3 Compliance score and pro-cyclical fiscal policy, 1998-2019

Source: European Commission, own calculations
- Compliance tends to be associated with quality of governance. First, better compliance scores go hand in hand with a longer tradition of independent national fiscal institutions.8 In countries where watchdogs were established before 2011 – the year the Six-Pack reform of the SGP introduced elements of independent scrutiny in the EU fiscal framework – average compliance is 20 percentage points higher than in countries where watchdogs were established later. While the causality is not entirely clear, the presence of strong watchdogs is generally associated with better fiscal results (Beetsma et al. 2018).
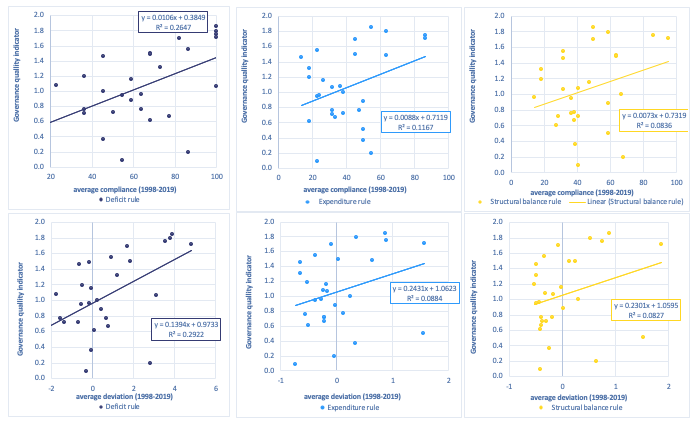
- Second, average compliance tends be higher in countries where the overall quality of institutions, as captured by indicators of the World Bank database of governance (WGI), is high (Figure 4). We use a composite indicator that averages the control over corruption, government effectiveness and quality of regulations.9 Although the fit is loose in the two-dimensional space, Figure 4 points to a clear positive correlation.
Figure 4 Quality of governing institutions and compliance with fiscal rules, 1998-2019

Source: European Commission, World Bank Group (WGI), own calculations
To test the stability of the correlations discussed above, we ran panel regressions. Our results are not meant to be waterproof evidence in terms of causality. They nevertheless corroborate indications arising from a descriptive analysis of the data; they also turn out to be robust across different specifications. Briefly:
- Nominal GDP growth fosters compliance across all rules – it is easier to comply with fiscal rules when inflation and real GDP growth are higher.
- Compliance with the deficit rule is cyclical – it improves when the output gap is positive and deteriorates when the output gap goes south. By contrast, and unfortunately, compliance with rules correcting for the cycle are pro-cyclical.
- Very high debt (above 90 % of GDP) makes compliance with the current formulation of the debt rule much more difficult.
- Market pressure impacts compliance. Higher market volatility, which correlates with the average interest rate on government debt, makes it more difficult to stay within the limits of rules targeting budgetary aggregates. By contrast, volatility seems to have a minor but still significant effect on compliance with the debt rule, suggesting that government react to heightened concerns of investors by controlling debt.
- The quality of governance matters. Better governance goes hand in hand with better compliance.
Conclusions
Our new database on numerical compliance with the EU fiscal rules confirms established truths and points to new interesting patterns. It opens the door to new and more detailed analyses. Any upcoming attempt to review or reform the existing rules should take into account current trends and issues. We very much hope our database will give rise to new research or complement existing ones so as to better inform policy decisions.
References
Beetsma, R (2001), “Does EMU need a stability pact?”, in A Brunila, M Buti, and D Franco (eds), The stability and growth pact – The architecture of fiscal policy in EMU, Palgrave.
Beetsma, R, X Debrun, X Fang, Y Kim, V Lledó, S Mbaye, and X.Zhang (2019), “Independent fiscal councils: Recent trends and performance”, European Journal of Political Economy 57: 53-69.
Bénassy-Quéré, A, M K Brunnermeier, H Enderlein, E Farhi, M Fratzscher, C Fuest, P-O Gourinchas, P Martin, J Pisani-Ferry, H Rey, I Schnabel, N Véron, B Weder di Mauro, J Zettelmeyer (2018), “How to reconcile risk sharing and market discipline in the euro area”, VoxEU.org, 17 January.
European Commission (2019), “Vade Mecum on the Stability and Growth Pact – 2019 Edition”, European Economy no. 101, Brussels.
European Fiscal Board (2019), Assessment of EU fiscal rules with a focus on the six and two-pack legislation, Brussels.
Eyraud, L, V Gaspar, and T Poghosyan (2017), “Fiscal Politics in the Euro Area”, in V Gaspar, S Gupta, and C Mulas-Granados (eds), Fiscal Politics, IMF.
Feld, L, C Schmidt, I Schnabel and V Wieland (2018), “Refocusing the European fiscal framework”, VoxEU.org, 12 September.
Gaspar V and D Amaglobeli (2019), “Fiscal Rules”, SUERF Policy Note No. 60.
Larch, M and S Santacroce (2020), “Numerical compliance with EU fiscal rules: The compliance database of the Secretariat of the European Fiscal Board”.
Larch, M, E Orseau and W van der Wielen (2020), “Do EU Fiscal Rules Support or Hinder Counter-Cyclical Fiscal Policy?”, JRC Working Papers on Taxation and Structural Reforms No 01/2020.
Reuter, W H (2019), “When and why do countries break their national fiscal rules?”, European Journal of Political Economy 57: 125–141.
Endnotes
1 Beetsma (2001) provides a summary of the different arguments in favour of a fiscal rule.
2 A comprehensive description of our approach and of the database can be found in Larch and Santacroce (2020).
3 For a comprehensive and in-depth assessment of the effectiveness of the last two legislative reforms of the SGP – the ‘Six-Pack’ and the ‘Two-Pack’ reforms – see EFB (2019).
4 The latest version of the so-called Vade Mecum of the SGP, a kind of users’ guide of the EU fiscal rules, exceeds 100 pages (see European Commission 2019).
5 Reuter (2019) finds that average compliance with all rules – national and supranational – was around 50% in 1995-2014 and slightly higher (around 58%) for the EU rules. Using somewhat different definitions of EU fiscal rules and a narrower definition of compliance, Eyraud et al. (2017) and Gaspar and Amoglobeli (2019) conclude that non-compliance has been the rule rather than the exception in the EU.
6 In 2007, the last year before the global economic and financial crisis, more than 80% of the EU Member States complied with the deficit and the debt rule of the SGP. Compliance with the structural budget balance rule was much lower and in very few countries net expenditure growth was aligned with the underlying rate of economic growth.
7 See Larch et al. (2020) for a comprehensive econometric analysis.
8 We classify countries into two groups based on the number of years since the establishment of a national independent fiscal body: well-established institutions (NL, SE, AT, BE, DK, EE, LT, LU) and recently established institutions (IT, IE, SK, DE, EL, ES, FI, FR, HR, HU, LV, PT, RO, UK, MT, SI, CZ, CY, BG).
9 See https://info.worldbank.org/governance/wgi/
Author’s note: The views expressed in this column belong to the authors and should not be attributed to the European Commission.
Source: https://voxeu.org/
