_ Yuri Kofner, junior economist, MIWI – Institute for Market Integration and Economic Policy. Munich, 20 April 2020.
Intra-regional trade indicators of RTAs in comparison
An important indicator for assessing the intensity of regional economic integration and the importance of a common domestic market for its member states is the percentage share of intra-regional trade in total trade of the integration block or regional trade agreement (RCA).
In this analytical note, the author compared this indicator for six of the world’s most significant trade and economic integration initiatives: AU (African Union, 55 member states), ASEAN (Association of Southeast Asian Nations, 10 member states), EAEU (Eurasian Economic Union, 5 member states), EU (European Union, 27 member states), MERCOSUR (South American Common Market, 4 member states), USMECA (United States – Mexico – Canada free trade agreement, former NAFTA – North American Free Trade Agreement, 3 member states).
Of these, the European Union reached the greatest integration depth, covering not only a single domestic market, but also an economic, monetary, and partially political union, including a common foreign policy in trade-economic and, partially, political matters. In this regard, the Eurasian Economic Union is in second place, since in the past five years it has managed to create a customs and economic union with a formally common macroeconomic and foreign economic policy. Next are MERCOSUR and ASEAN. The first is formally more integrated, having achieved a common domestic market and a customs union. However, being de facto only a free trade area, ASEAN is currently implementing a wider range of integration proposals. USMECA stands out: it can be considered as a comprehensive regional free trade agreement, since in addition to zeroing import duties, it also presumes the harmonization of technical regulations and standards, investments, services, digital commerce, a special dispute settlement mechanism, and, most importantly, elements of a coordinated foreign economic policy. Last, but not least, there is the African Union, an ambitious and potentially very promising integration association that includes all 55 countries of the African continent. However, the launch of its “continental free trade area” is planned only for July 2020.
Still, an analysis of the indicator of the share of regional trade in total trade of a given regional trade agreement (RCA) shows that greater depth of institutional integration does not necessarily entail greater importance of the common domestic market for the member states of the integration initiative. As expected, with 30.6 percent the European Union had the highest average indicator for the study period. However, next came USMECA, with almost 20 and 10.5 percent, respectively. MERCOSUR and the EAEU share a common level of (un-) importance of their common domestic market in overall merchandise trade – 7.3 percent. Intra-regional trade accounted for only 5.3 percent of total trade of the African Union (Chart 1, Table 1).
Chart 1. Share of intra-regional trade of total trade (2007-2019, in percent)
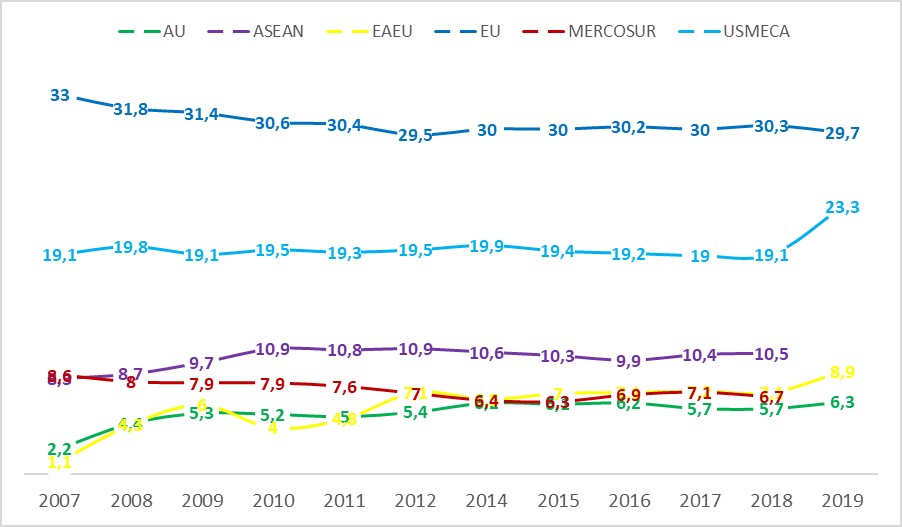

Source: Compiled by the author based on WITS UN COMTRADE data.
Based on the logic that for associations with a larger number of member states this indicator should theoretically be higher (it’s easier to have a higher trade volume between a larger number of countries), we can give a weight in the form of the number of participating countries. So, the indicator of the share of intra-regional trade in total trade of a given RTS, weighted by the number of its member states, can more accurately convey the importance of the common domestic market for a given regional integration initiative. Thus, the following ranking is obtained: USMECA (6.6), MERCOSUR (1.8), EAEU (1.5), ASEAN and EU (both 1.1), AU (0.1). Please note that this is not a percentage, but a weighted indicator, which theoretically can range between 0 and 50.
From the analysis, we can also see that RTAs that have long established a customs union or FTA (EU, MERCOSUR, USMECA), the importance of the common market is no longer significantly changing in one direction or another. And if it changes, then slowly and usually in a decreasing direction (EU, MERCOSUR). Such a trend does not necessarily mean a diminishing importance of the common domestic market for the integration association. It can also be linked to a greater internationalization of value chains, which should be viewed as a positive development. An exception from this trend (not from the interpretation) is the jump in the share of intra-regional trade from 19.1 to 23.3 percent after the conversion of NAFTA to USMESA in October 2018.
After the ASEAN countries formed a free trade area in 2010, the share of their mutual trade in total trade also jumped from 9.7 to 10.9 percent, but since then it remained rather unchanged at 10.5 percent.
It is noteworthy that the share of intra-union trade in the total trade of the African Union and of the EAEU continuously grew over the entire study period: from 2.2 to 6.3 percent and from 1.1 to almost 9 percent, respectively. Thus, the Eurasian integration bloc had the largest increase in this indicator out of all six integration groups studied. The EAEU experienced a jump in the share of intra-union trade after the establishment of its customs union in 2010 (from 4 to almost 7 percent), but which then also remained at about the same level with the exception of 2019, when this indicator grew substantially by almost 2 percentage points. The probable causes are, so far, up to speculation.
Also, based on the analysis, it can be noted that the share of intra-regional trade practically does not correlate with international trade and economic crises. In other words, during periods of global recession the common domestic market does not become relatively more important for the member states of a given integration initiative.
Appendix:
Table 1. Share of intra-regional trade of total trade (2007-2019, in percent)
|
|
AU | ASEAN | EAEU | EU | MERCOSUR | USMECA |
| 2007 |
2,2 |
8,3 | 1,1 | 33,0 | 8,6 | 19,1 |
| 2008 |
4,4 |
8,7 | 4,3 | 31,8 | 8,0 | 19,8 |
|
2009 |
5,3 | 9,7 | 6,0 | 31,4 | 7,9 |
19,1 |
|
2010 |
5,2 | 10,9 | 4,0 | 30,6 | 7,9 |
19,5 |
|
2011 |
5,0 | 10,8 | 4,8 | 30,4 | 7,6 | 19,3 |
|
2012 |
5,4 |
10,9 | 7,1 | 29,5 | 7,0 |
19,5 |
| 2014 |
6,2 |
10,6 | 6,5 | 30,0 | 6,4 |
19,9 |
| 2015 |
6,1 |
10,3 | 7,0 | 30,0 | 6,3 |
19,4 |
| 2016 |
6,2 |
9,9 | 7,1 | 30,2 | 6,9 |
19,2 |
| 2017 |
5,7 |
10,4 | 7,2 | 30,0 | 7,1 |
19,0 |
| 2018 |
5,7 |
10,5 | 7,1 | 30,3 | 6,7 |
19,1 |
|
2019 |
6,3 | – | 8,9 | 29,7 | – |
23,3 |
Source: Compiled by the author based on WITS UN COMTRADE data.