_ Eric Kaufmann, professor of politics, Birkbeck College, University of London; Research Fellow, Center for the Study of Partisanship and Ideology (CSPI). 26 October 2022. *
Summary
- America’s elite university students are more demographically diverse than the general population, but more politically divided along lines of race, gender, sexuality, and religion.
- Minority and female students are far more left** on campus than in the general population, whereas straight white Christian men are somewhat more conservative on campus than in the general population. Current trends portend a politics in which elite women, minorities, gays, and the nonreligious are more left-leaning while elite whites, males, and Christians remain relatively conservative.
- White Christians tend to cluster in red state flagship universities, which are the most politically balanced in the country and have similar shares of left and conservative students. Yet many flagship universities in flyover states with conservative reputations actually have more left than conservative students.
- A quarter of students are LGBT, and there are roughly equal shares of Christian and nonreligious students. LGBT, Nonreligious, and Christians are set to become more important political groups among America’s future leaders.
- Liberal arts colleges are the least politically diverse. Many have almost no conservatives, and thus very low viewpoint diversity. But they have high sexual diversity, at nearly 40 percent LGBT.
- Ivy League schools average 10-15 percent conservative and 60-75 percent left. Across 150 leading schools, there are nearly 2.5 leftists for every conservative.
- Democrats outnumber Republicans by a 55-23 margin on campus, and leftists outnumber conservatives 53-21. Elite students are thus two-thirds more Democratic and twice as left as the American population.
- Among elite students, there is a 15-point gender gap in political ideology and party identification between men and women. This is 3 to 5 times larger than the gender gap in the general population. It is also 2 to 3 times larger than the gender gap among either the 18-25 or college-educated general population. The campus gender gap has grown steadily since 2004.
- The university with the highest viewpoint diversity ranking is the University of Arkansas, whose students are 35 percent conservative, 37 percent left, 36 percent Republican, and 41 percent Democratic. The least diverse is Smith College, at 81 percent left, 1 percent conservative, 78 percent Democratic, and 2 percent Republican.
- Thirty percent of students and nearly the same share of academic staff in Social Sciences and Humanities (SSH) fields identify as the furthest left point on a 7-point conservative-left scale. For Sciences, Technology, Engineering, and Math (STEM) subjects, a smaller share – 20 percent of students and 10 percent of staff – identify as far left.
- Self-identified Jews make up only 3 percent of elite students and just 7 percent of Ivy League students, suggesting a considerable decline since the early 2000s.
- Homeschooled and parochial schooled undergraduates are as or more likely to identify as LGBT or non-binary as those from public or private school backgrounds.
Introduction
The most elite fifth of undergraduates in the country will supply most of the nation’s future leaders. They are also an important leading indicator of emerging social and political trends. The Foundation for Individual Rights in Education (FIRE)’s campus expression surveys sampled 57,000 undergraduates across 159 of the top universities in the country, allowing for an unprecedented opportunity to learn more about this important group.
Method
This report makes use of FIRE’s distinctive 2020 and 2021 student free speech surveys, drawn from College Pulse’s panel of over 500,000 verified undergraduates.1 This contains some 57,000 respondents and a rich range of political questions to explore emerging trends among elite students. The FIRE survey focuses on students at research-intensive, selective institutions. In 2021, 75 percent of FIRE respondents attended one of the 113 Research 1 (R1) institutions, and all attended one of the approximately 335 R1, R2, or R3 doctoral-granting institutions or a prestigious liberal arts college. This means the data represents about 3 in 4 R1 institutions, just over 10 percent of R2 schools, and very few R3 or lower-ranked institutions. The colleges in the survey educate around 1 in 5 of the nation’s undergraduate students, focusing very much on the intellectually influential top tier.
Across the country, R1 schools, including those not in the FIRE dataset, enroll around 1 in 7 undergraduates. By comparison, the Higher Education Research Institute (HERI) Freshman Survey samples a representative stratified draw of around 100,000 freshmen pupils from roughly 100 institutions selected out of a possible 1,427 4-year degree-granting colleges.2 This report should therefore be viewed as a portrait of the political views and demographics of the approximately 15 percent of American undergraduates who attend top institutions. The FIRE sample is weighted during analysis by College Pulse data weights based on official data submitted by each university to the Integrated Postsecondary Education Data System (IPEDS) database and other sources.3
Student Demographics
Race
I begin with the basic demography of the 57,000 college students surveyed by FIRE. The survey aimed at a reasonably representative sample of the student body of research-intensive universities and elite colleges. In the combined 2020-21 sample of approximately 57,000 students, 52 percent of respondents are white, 19 percent are Asian, 11 percent Hispanic, 7 percent black, and 7 percent multiracial. With survey weights applied, the white share rises to 61 percent, which is about 10 points whiter than Gen-Z as a whole. The HERI survey, based on a far less exclusive sample of colleges, shows a more racially diverse student population, with 50 percent white, 11 percent Latino, and 10 percent black. However, the Asian share was lower in the HERI data, at 12 percent, and the multiracial component higher, at 16 percent.
In the FIRE data, only six colleges were more than 80 percent white, though all were at least 10 percent minority: BYU, Maine, UNH, Vermont, Wyoming, and Utah State. A larger number of institutions were less than 20 percent white, with three under 10 percent white, including Howard (0 percent), Cal State Los Angeles (6 percent), and UC Riverside (7 percent). These figures approximate to actual reported numbers from the universities themselves.
The share of white students in Ivy League universities averaged 41 percent in the survey data, with Asians at 27 percent, both of which tally with the university figures.4 Asian students comprised 19 percent of the FIRE student sample overall, well above this group’s share of the national population of 18-24-year-olds, which is around 5 percent.5 In the FIRE data, the colleges with the highest Asian share were Carnegie-Mellon, Stony Brook, and the University of Hawaii. These campuses’ official Asian component stands at 33 percent, 27 percent, and 37 percent, respectively. At the other end of the scale, Asians made up under 3 percent of students in the FIRE sample at six institutions (BYU, Kansas, Kent State, New Mexico State, Utah State, and the University of Maine).
The African American share in the dataset was 7 percent, ranging from less than 1 percent at four schools (BYU, Colorado School of Mines, Oregon State, University of Idaho) to 88 percent at Howard University, a historically black institution. Latinos made up nearly 11 percent of students, ranging from over half the student body at four colleges (Cal State Fresno, Cal State Los Angeles, Florida International, and New Mexico State) to between 1 and 2 percent at the University of Vermont, University of Maine, Howard University, and Ohio University. Official figures place the Hispanic share of the student population at around 55 percent at Cal State Fresno and 70 percent in the other three colleges.
Gender and Sexual Orientation
In terms of gender, 61 percent of the unweighted sample are female and 36 percent male, with 3 percent gender nonconforming. With survey weights applied the numbers are 50 percent female, 48 percent male, and 2 percent gender nonconforming. The unweighted figures are not far off the national student figures, in which around 60 percent of students are female. Nine institutions are more than 75 percent female in the data. This is accurate for mainly female colleges, though in some cases the samples overstate a particular university’s actual sex ratio. Clearly there is a certain amount of measurement error at the college level given an average enrollment of 20,000 undergraduate students and a sample size of around 250 students per school. This produces a margin of error of 6 percent for the typical college in the dataset.
Twenty-three percent of students identify as LGBTQ: 16 percent of men, 28 percent of women, and virtually all non-binary respondents. The bisexual and ‘questioning’ sexual orientation categories account for 15 percent of females but only 6 percent of males, while the gay/lesbian share is around twice as high among male students (6.1 percent) as females (2.8 percent). Non-binary students comprise 3.6 percent of the 2021 sample, adjusted to 1.1 percent in the weighted data. In 2022, the question was broadened to 7 categories, leading to 3 percent of the weighted sample identifying as non-binary. In the HERI data, a lower share of students, 15 percent, identify as LGBTQ.
Much of this pattern can be accounted for by the share of LGBTQ respondents among young people, with 21 percent of Gen-Z identifying as other than heterosexual in the most recent Gallup survey. The unweighted Cooperative Congressional Election Study (CCES) finds no difference between students and non-students in LGBTQ share. Regardless, the substantial LGBTQ quotient among the young is a trend that is independent of the effects of college, although LGBTQ individuals appear to be self-selecting into elite higher education institutions in somewhat larger numbers compared to lower-ranked institutions.
Across 159 campuses sampled, three schools contained a weighted majority of students identifying as LGBTQ – Oberlin (51 percent), Wellesley (61 percent), and Smith College (70 percent). Given the 6 percent margin of error in the data for these colleges and possible noise from any sampling biases, these figures should be treated as indicative rather than definitive estimates. On the other hand, the 38 percent share of LGBTQ students among the more than 4,000 students in the 23 liberal arts colleges sampled is accurate to within a 1 percent margin of error. This suggests several liberal arts colleges, such as those listed above, could be majority LGBTQ. At the other end of the scale, LGBTQ students made up no more than 15 percent of students in the weighted sample at BYU (10 percent), Utah State (11 percent), Bucknell (13 percent), University of Miami (14 percent), Notre Dame (14 percent), and Clemson (14 percent). Importantly, no institution had fewer than 10 percent LGBTQ students.
There were minimal differences between Ivy League, R1, R2, and R3 schools on this measure, but, as Figure 1 shows, the LGBTQ share across the 23 liberal arts colleges was substantially higher, at 38 percent. Part of this effect is linked to the strongly left ideology at these colleges, where ‘very left’ students are 37 percent LGBTQ compared to just 5 percent of ‘very conservative’ students. Liberal arts colleges sport a relatively female (56 percent) and left (72 percent) student body, though these factors alone do not fully explain their exceptionalism on this measure.
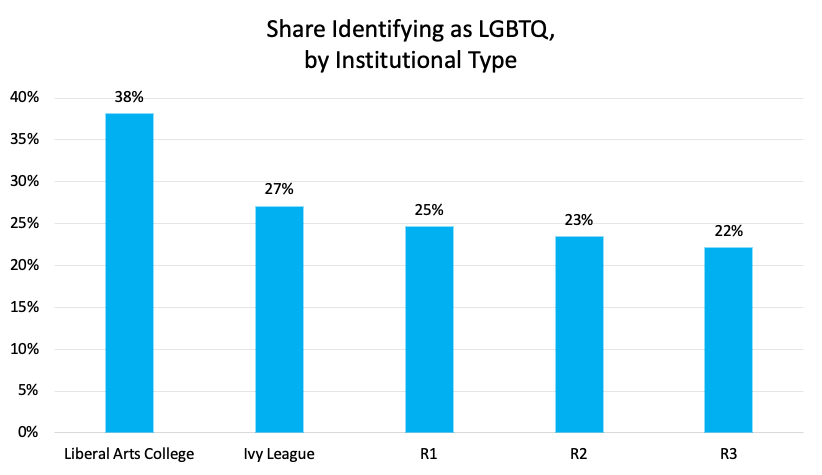
Figure 1. Source: FIRE 2020 and 2021. N= 4,078 Liberal Arts College; 4,515 Ivy League; 27,652 R1; 4,140 R2; 1,122 R3. Survey weights applied.
Religion
Turning to religion, 47 percent of students identify with a Christian denomination, with 38 percent stating they have no religion. Among whites, 48 percent are Christian and 39 percent have no religion. FIRE surveys do not ask about attendance, belief, or fine-grained sect. Students ticking the Protestant, Catholic, or ‘Just Christian’ box may be only nominally religious. It is unclear how many are evangelical or mainline Protestants, or whether Jews are Orthodox, Reform, or Conservative. Those identifying as ‘Just Christian,’ for instance, are no more conservative or Republican than those who ticked Protestant as their denomination.
Twenty-four campuses had students who were majority nonreligious (identifying as atheist, agnostic, or ‘nothing in particular’), many of which are liberal arts colleges or part of the California state system. At the extreme, 6 in 10 students at Colorado College and 57 percent at Smith College reported no religious affiliation. On the other side of the ledger, just seven schools had a student body where at least 70 percent identified with a Christian denomination. These were Pepperdine (71 percent), Auburn (72 percent), Mississippi State (74 percent), Notre Dame (77 percent), Baylor (78 percent), Utah State (79 percent), BYU (89 percent), and Hillsdale (93 percent).
Jews averaged 3 percent of students in the sample, but comprised 15 percent at Tulane University, 18 percent at Barnard College, and 39 percent at Brandeis. All three schools are known to have significant Jewish populations, though these figures suggest the share identifying as Jewish, at least in terms of religious affiliation, is less than some believe. Muslim students made up 2.8 percent of the total but formed around 10 percent of the student body at two campuses: the University of Illinois at Chicago (14 percent) and the University of Texas at Dallas (9 percent). Again, these figures should be treated as indicative rather than point estimates, given the 6 percent margin of error in the sample.
Aggregation by institutional type, which is at a higher level than the college, offers more precision, with a margin of error in the 2 percent range. Figure 2 presents the broad religious patterns by institutional type. Nonreligious students are a near-majority of students in liberal arts colleges and a 43 percent plurality in the Ivy League, where they outnumber Christians 43 percent to 37 percent. In R1 universities, which comprise most of the sample (and include the Ivy League), Christians are only slightly more numerous than those without religion. In R2 and R3 institutions, however, Christians are a majority. In fact, in R3 institutions, the nonreligious share is just half as large as the Christian share. The proportion Protestant (including ‘Just Christians’), though not shown in Figure 2, is also much higher in R3 institutions. Among white students, Protestants outnumber Catholics 4:1 in R3 institutions but only between 1:1 and 2:1 in the more elite R1 and R2 institutions.
Finally, Jews make up a mere 3 percent of R1 students in the sample – little above their share of the population – and only 7 percent in the Ivy League. This figure is, ironically, lower than the discriminatory quota applied by Ivy League universities in the early-to-mid twentieth century.6 The share of Ivy League undergraduates identifying their religious affiliation as Jewish stood at around 20 percent as recently as the early 2000s but has since declined significantly. These figures confirm similar data collected by universities, but reveal just how advanced this trend is.7 It is possible that a larger share of ethnic Jews are choosing to tick ‘no religion’ rather than Jewish, though one would expect ethnic affiliation to prompt them to select the Jewish box more so than ex-Christians. Precisely which combination of secularization, lower entry qualifications, or the overall decline in the white share of students at top institutions accounts for the lower-than-expected share of Jews is a question for future research.
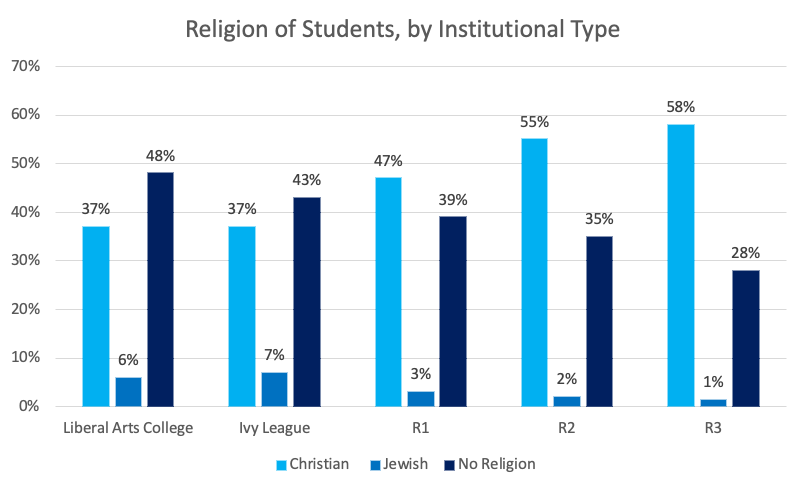
Figure 2. Source: FIRE 2020 and 2021. R1 figures include the Ivy League. N= 4,078 Liberal Arts College; 4,515 Ivy League; 27,652 R1; 4,140 R2; 1,122 R3. Survey weights applied.
Differences by Discipline, and Between Faculty and Students
We also see important distinctions by discipline when we put students’ majors into two broad categories, Social Sciences and Humanities (SSH) and Science, Technology, Engineering, and Mathematics (STEM). Figure 3 compiles data from the FIRE surveys as well as a smaller faculty convenience sample I gathered in 2020. The latter is not a random sample, but its political composition matches that of studies that use complete samples and voter registration data, and is thus a reasonable representation of the demographics and political beliefs of faculty in the leading 100 US universities, and also comparable in scope to the FIRE sample.8
SSH students are about 3 points whiter, 13 points more LGBTQ, 11 points more far-left, and 7 points less conservative than STEM students. The proportion Christian and No Religion is similar between both disciplines. So-called ‘Studies’ majors (Women’s, African American, Native American, Latino, Ethnic) are 75 percent non-white and 58 percent LGBTQ. Interestingly, students in these fields are no less Christian than others, and fewer are nonreligious. They are more far-left (39 percent) than SSH students are (30 percent), while being considerably less conservative (5 percent) than SSH (14 percent) or STEM (21 percent) students.
In line with existing findings, faculty are considerably less racially diverse than students. 85 percent of SSH faculty and 79 percent of STEM faculty are white, according to my faculty sample. This compares to 60 and 57 percent, respectively, among SSH and STEM students. The Jewish share is also substantially higher among faculty – 13 percent in SSH and 10 percent in STEM – than among students (5 percent and 3 percent for SSH students and STEM students, respectively). As with students, the far-left share among faculty is higher among SSH (28 percent) than STEM (12 percent). Conservatives are also more numerous in STEM (10 percent) than SSH (5 percent) among academics. Disciplinary differences are thereby somewhat more pronounced among faculty than students.
Finally, the similarities between staff and students should be noted: conservatives and Christians are greatly underrepresented among both in comparison to the population, while those without religion and far-leftists are heavily overrepresented (except for far-leftism among STEM faculty, which is around the national average). In all cases, the discrepancy between SSH and STEM is more pronounced for faculty than students. In addition, minorities are underrepresented, and Jews overrepresented, among faculty, but both groups come close to their national share among students. Finally, the share of conservatives is 2 to 4 times higher among students compared to their professors. These figures indicate that the culture of the university is more exaggerated among the professoriate than the students, even as both share a distinct religious and political profile in relation to the wider US population.
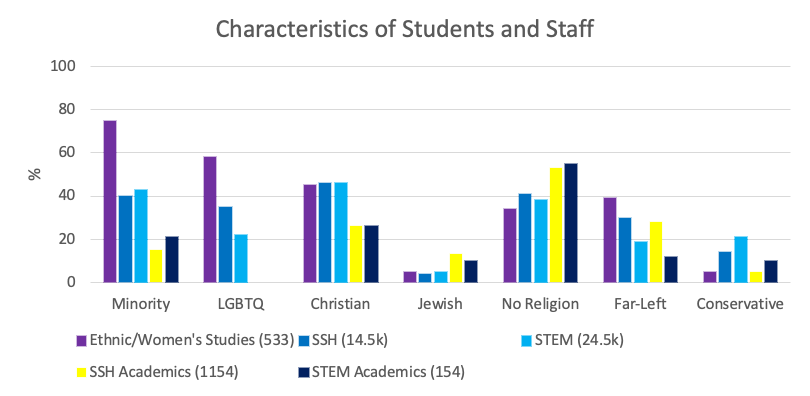
Figure 3. Source: FIRE 2020 and 2021, and Kaufmann 2021, “Academic Freedom in Crisis.” Sample size in brackets. Survey weights applied to FIRE data.
The Politics of Students
American students lean left, but not as heavily as some might believe. Political ideology in the two waves of the FIRE survey revealed 53 percent to be left, 26 percent moderate or unsure, and 21 percent conservative. Party identification is 55 percent Democrat, 22 percent Independent, and 23 percent Republican.9 This means there are about 2.5 leftists or Democrats for every conservative or Republican among students.
This is similar to other surveys and shows that students differ a good deal from the national average. The 2016 American National Election Study (ANES) reports that in the wider population, there is a roughly even Democrat-to-Republican party identification ratio and a 40-33 conservative-to-left lean.10 Among all Americans with degrees in the ANES, the partisan ratio is 44-34 Democratic-to-Republican and 41-38 left-to-conservative. So American students are considerably more left and Democratic than the average college-educated American.
But American students are less exceptional when we take their age into account. In the 2020 presidential election, Gen-Z broke 65-31 for Biden, according to the exit polls.11 For party identification, the large-sample CCES shows that among Americans under 25, the (survey-weighted) partisan split in the US population is 30-19 in favor of the Democrats against the Republicans. For Americans under 25 with a degree, the partisan balance in the CCES tilts to 46-20 in favor of the Democrats. This is within 10 points of what we see in the FIRE student surveys and mirrors the 2020 exit polls. Triangulating with other sources, the FIRE student figures match other estimates and indicate that the student body largely, but not fully, mirrors the wider Gen-Z population from which it is drawn.12 Results from these external election surveys suggest that both age and education skew the D:R ratio from 1:1 in the population to 2:1 in the student population to 2.5:1 in the elite student population, with age a more important influence than education level in explaining students’ Democratic tilt.
Moving from party identification to ideology, the FIRE student sample (53 percent left, 26 percent conservative, 21 percent moderate) is more left than the wider US student average as reported by HERI, which is 37 percent left, 20 percent conservative, and 43 percent ‘middle of the road.’13 Though the moderate share is much larger in the HERI than the FIRE data (43 vs. 26), a 7-point question similar to FIRE’s without the ‘middle of the road’ phrasing may have drawn more leaners to choose one side or the other.
More importantly, the elite nature of the FIRE sample as compared to HERI helps explain the discrepancy. Bracketing differences between the size of the moderate group in both surveys, in HERI the left-to-conservative ratio is a bit less than 2-to-1, and in the FIRE surveys it is 2.5 to 1. The fact that R1 schools in the FIRE sample score over 3 to 1 in favor of leftists while R2 and R3 institutions lean just 2.2 to 1 indicates that the elite nature of the FIRE sample likely accounts for most of the discrepancy. Overall, there is more similarity than difference between the two surveys.
The HERI 2-to-1 ratio reflects the young population more generally. Thus 2020 data from the Survey Center on American Life (SCAL) shows that Gen-Z overall leans 42 percent left, 19 percent conservative, and 39 percent moderate or other – very similar to the HERI data that includes low-ranking colleges.14 The ANES shows more of a difference between well-educated and less-educated Gen-Z respondents: the under-25 population with at least some college is 51 percent left and 29 percent conservative, while the wider under-25 population, including those without any college education, is 40 percent left and 34 percent conservative. SCAL and ANES have small Gen-Z samples, but they suggest that FIRE’s elite sample is somewhat more left than the wider student average and, in addition, that elite university students are somewhat more left than young people who choose not to attend college.
Segregation
A growing literature points to the geographic sorting of the American electorate, with fewer Americans living in politically mixed places and more in ‘landslide counties’ where one party wins each election by a large margin. Educated people in particular, who in today’s political climate lean left, are far more concentrated in major metropolitan areas than in 1970.15 The more urban a locale, the more left-wing and Democratic, with the reverse holding true in rural areas.16 In addition to geographic segregation, partisans are increasingly segregated in their social networks, even if they reside in an area not dominated by their political tribe. Thus, around 55 percent of Republicans and Democrats socialize exclusively with those sharing their partisan inclinations.17 Highly-educated Democrats are least likely to have politically mixed networks compared to the less-educated or highly-educated Republicans.18 This hyper-segregation among well-educated Democrats may be relevant for elite American students, though the FIRE study did not specifically ask about this.
Figure 4 uses a standard measure of segregation known as the Index of Dissimilarity (ID) to assess how segregated groups of students are compared to what would occur if students of various characteristics were randomly allocated across universities. The ID in this case is based on comparing each group to those who are not members of the group. The proportion for each group represents the share of each that would have to move university in order to achieve a uniform distribution of the group across all campuses.
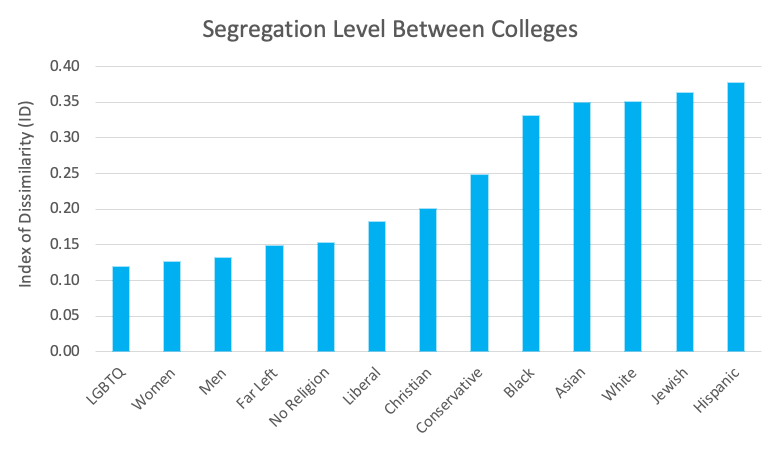
Figure 4. Source: FIRE 2020 and 2021.
The most important form of segregation in the FIRE data is ethnic segregation, with college-level IDs for various groups in the mid-30s. This is followed by political and religious segregation in the .15-.25 range. Conservatives cluster more in certain colleges than left or far-leftists do. Sexual orientation and gender are only weakly segregated, with IDs around .12-.13, exhibiting less variation from one campus to the next than ethnic, religious, or ideological characteristics.
Most ethnic groups have a college-level ID in the mid-30s, from .33 for African Americans to .38 for Hispanics. On the one hand, these figures are a fair bit lower than national levels of residential segregation between racial groups at the level of the census tract (geographic units averaging 1,000 to 8,000 people) and would be considered low-to-medium segregation on the Massey-Denton classification scale.19 For instance, the geographic census tract ID in 2020 is 55 for African Americans, 45 for Hispanics, and 40 for Asians. This means 40 to 55 percent of these groups would have to move census tracts to achieve a random distribution of groups across tracts, eliminating segregation.20 Interestingly, whereas blacks are the most segregated group in residential terms, when it comes to elite colleges, the white segregation level of .35 is slightly above that of blacks (.33), an inversion of the residential pattern. One takeaway from this is that African Americans are much less segregated between research-intensive universities than they are between American neighborhoods.
Whites’ relatively high level of segregation compared to national residential patterns could be the result of whites choosing to attend relatively white schools, but, since they are a large group, may also arise from where they live or the choices made by other groups. For instance, focusing only on the 13 colleges of California in the dataset, where white students are only the third-largest group (23 percent) after Asians (34 percent) and Hispanics (26 percent), shows that the white level of segregation of .20 is considerably lower than that of Asians at .39 or Hispanics at .35. This does not necessarily indicate that whites self-segregate less than other groups, though, because more California whites, compared to other groups, may have opted for colleges outside the state, while more Hispanic students are concentrated in less prestigious large public colleges that are more closely tied to local residential patterns. White students in the state are relatively evenly distributed across the larger public colleges, but the white share is substantially higher in certain smaller institutions like Pepperdine or Claremont, which don’t affect the ID scores much.
While collegiate segregation is lower than residential segregation, IDs in the mid-30s do not necessarily indicate that students self-segregate less when choosing a college than adults do when choosing where to live. After all, neighborhoods often reflect inherited patterns among settled communities while a student’s choice of college represents a fresh start, and student bodies are constantly turning over so they might be expected to be less segregated. We might further assume that the most elite 15 percent of colleges (those comprising the FIRE dataset), many of which are residential, would limit the impact of local residential segregation in shaping the student body. The fact that the racial group ID of leading American universities is in the 30s could thereby be viewed as evidence for a relatively high level of inter-collegiate segregation.
In truth, the figures reflect a mix of residential segregation patterns, educational segregation – as people to some extent choose schools that resemble themselves – and de-segregating forces linked to prestige or, in some cases, affirmative action policies. Thus, as Figure 5 shows, students of various backgrounds are fairly evenly distributed between the eight Ivy League schools, a marked contrast to the national picture among (mainly R1) universities in the survey.
While this could simply mean that all Ivy League universities have similarly high levels of segregation (they are, after all, highly left-wing outliers with few conservatives and Christians), the fact there are few differences among them is telling. It indicates that local residential segregation in Ivy League communities like Ithaca, NY or New Haven, CT has less of an impact on the composition of the student body than is true of less prestigious institutions. Prestige factors and a high share of out-of-state students thereby override the influence of local geographic patterns. Common affirmative action policies may play a role in reducing racial disparities in representation between Ivy League schools but cannot account for the limited ideological and religious clustering that is also observable between Ivy League institutions. These results suggest that segregation among lower-ranked colleges outside the FIRE dataset is greater, reflecting differences in local residential patterns.
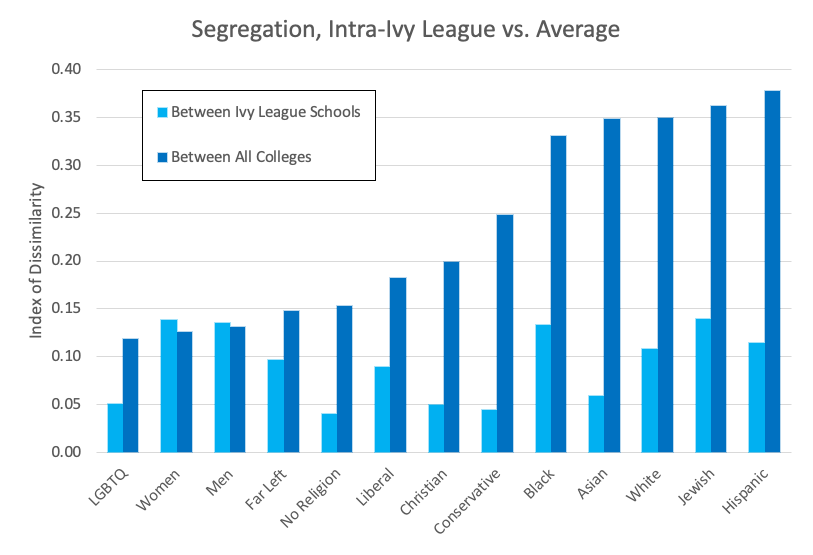
Figure 5. Source: FIRE 2020 and 2021.
How much does geography matter for various forms of inter-collegiate segregation? The degree to which variation in a state’s ethnic, ideological, or religious composition affects that of its colleges differs widely depending on the group in question. For instance, in Figure 6, the dot for each college is labeled with the name of the state in which it is located. While there is as much as 50 points variation in white share between universities within states, some states like West Virginia and Hawaii have only one college in the dataset. Moreover, the racial makeup of a state really matters. No campus in Wisconsin is under, and none in California over, 60 percent white. Sparsely populated, largely white states like Nebraska and Wyoming are represented by one or two flagship universities with more homogeneous university populations. Nearly half (.43) the variation in white share across colleges is explained by the state in which a college is located.21
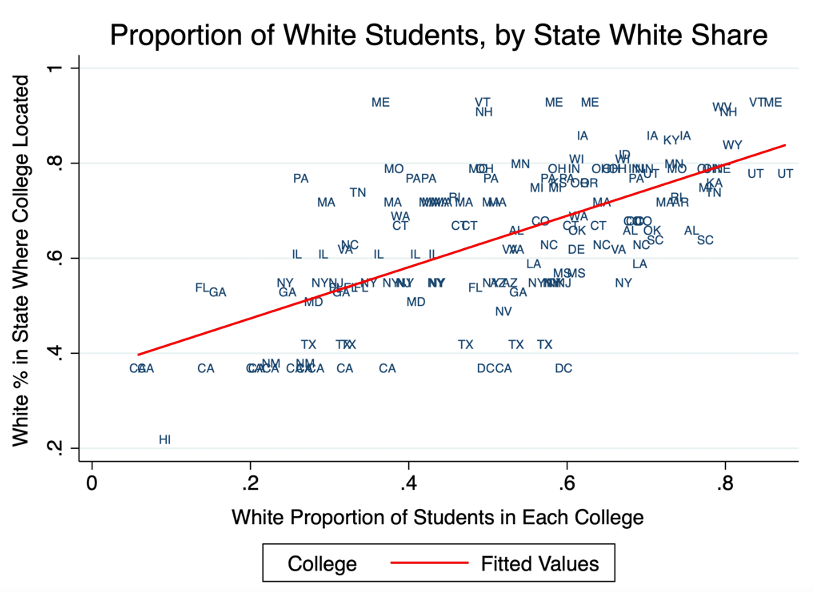
Figure 6. Source: FIRE 2020 and 2021. R2=.39, N=160 for 46 states. State white share based on 2017 American Community Survey data.
Using the same method for other characteristics in Figure 7 shows that geographic variation underlies a great deal of the inter-collegiate segregation we find for Hispanics, Whites, and Christians but explains less about the institutional clustering of Blacks, Asians, and Jews. This suggests institutional choice plays considerably more of a role than geographic location in accounting for the clustering of the latter. Notice as well that state-level variation seems to account for more of the variation in White Christian share from one university to another than it does for variation in the overall Christian share.
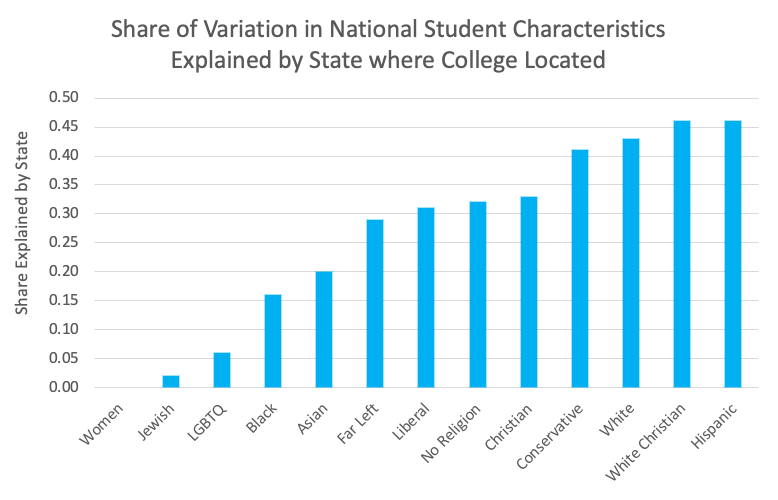
Figure 7. Source: FIRE 2020 and 2021. Based on regression of average proportion of each group across colleges with state dummy variables.
How can this be the case? We might expect that subgroups like minority conservatives would exhibit a level of segregation midway between the larger minority and conservative main groups. Since minorities and whites have a segregation ID of .34 and conservatives are at .25, we should expect something around .29 for both white and minority conservatives. In fact, we see sharp differences compared to what we would expect. Examining subgroups within the main racial, religious, and ideological groups in Figure 8 shows something interesting. Namely, that white Christians, coded in red, are more segregated than non-white Christians, coded in brown, by a margin of .33 to .23, while white conservatives are twice as segregated as minority conservatives, by a .33 to .17 margin.
On the other hand, minority leftits (.29) and far-leftists (.28) are more segregated than white left-wingers (.21) and far-leftists (.22). It seems that ideological and religious attachments, especially being Christian or conservative, reduce the level of segregation for minorities but do not do so for whites who are Christian or conservative. Left progressive idoeology and far-leftism reduce segregation a lot for whites and somewhat for minorities. All of this could be interpreted as indicating that religion and ideology reinforce racial group identity for white conservatives and white Christians but crosscut it for non-white conservatives, non-white Christians, and especially for white left-wing. The result is that white conservatives and white Christians cluster more in certain institutions – often those in less populated states like Wyoming or Utah – than minority conservatives and Christians, or white leftists. They appear less willing to move to colleges in more diverse states than their white leftist co-ethnics.
The net result is that the typical white Christian attends a college that is 34 percent white Christian though the student sample is just 26 percent white Christian. By contrast, 30 percent of white leftits’ classmates are white left-wingers, even as this group forms 27 percent of the elite student total. White conservatives’ fellow students, meanwhile, average 22 percent white conservative though this group comprises only 14 percent of elite students. Here we have evidence that white Christians and white conservatives are behaving in a more self-conscious manner than whites without religion, white leftits, or non-white conservatives and Christians. That is, their ideology and religion do not moderate their ethnic segregation much, if at all.
Figure 8. Source: FIRE 2020 and 2021.
Trends Over Time
The large-scale HERI freshman surveys allow us to track change in the ideological composition of undergraduates across a range of institutions representing all 4-year undergraduates over time. As noted, 37 percent of students in the HERI data in 2019 identify as left and 20 percent as conservative. The figures for the FIRE survey are 53 percent left and 21 percent conservative, reflecting the smaller share of moderates in the R1 institutions which make up the FIRE sample.
HERI survey trend data in Figure 9 reveals that the freshman population was very left-wing in 1970, after the student revolts of the late 1960s. It grew more conservative during the 1970s. By 1981, slightly more students described themselves as conservative or far right than leftist or far left. Since then, the share of letists has increased steadily, albeit with fluctuation, from 20 percent in 1980 to 37 percent in 2019 (not shown in the chart). The proportion of conservatives has, on the other hand, remained flat at around 20 percent during a period in American politics when ideology became more meaningful and aligned with partisanship. Given national trends, we would have expected a rise in conservatism among students as well.22 The lack of such a rise means American students are nearly twice as left-wing as they were in 1980.
A portion of this may be explained by demographic shifts in the student population, from 20 percent minority in 1976 to 27 percent minority in 1997 to 47 percent today.23 The share of women has also risen substantially, from 42 percent in 1970 to 52 percent in 1985 to nearly 60 percent in 2021. I estimate that around one point of the 10-point left shift since the mid-1980s can be accounted for purely by changes in gender composition. The conservative share, assuming women moved against conservatism in proportion to the rate they moved toward left ideology, would be similar.
Estimates are more difficult for minorities as their doubling since the 1980s has been accompanied by a shift from more left-leaning black students to somewhat less left-leaning Hispanic and Asian students. Using the FIRE data, showing that minority students are about 10 percent more left-wing and 50 percent less conservative than whites, indicates that rising racial diversity barely affects the 10-point left increase since the mid-1980s. However, a near-doubling of minority share since 1985 is likely to have reduced the conservative proportion by 1.5 points. Thus, the combined increase in female and minority students may account for 3.5 points of the 15-point increase in the left-over-conservative gap since the mid-1980s, nearly a quarter of the effect. While this is important, demographic shifts are not the main driver of student political change. Instead, a left-wing drift caused by the rising prominence of cultural issues in party politics that have a stronger age, gender, sexual orientation, and education gradient may explain the trend.24
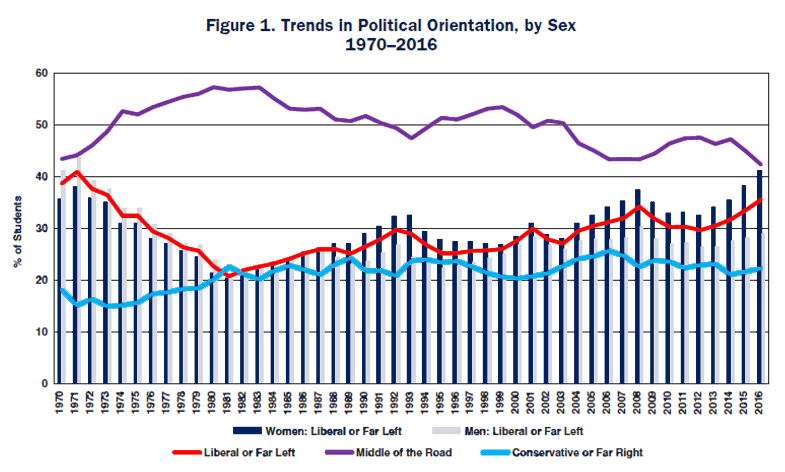
Figure 9. Source: HERI Research Brief, May 2017. For 2016, N=137,456 first-time, full-time freshmen attending 184 colleges, weighted to be representative. Across the entire 1970-2016 series, sample size is over 15 million individuals surveyed.
The Gender Gap
Alongside the trend of greater student leftism over time is a widening gender gap: males have inched up a few points in leftism since the mid-1980s, but females have risen from around 25 percent left in the mid-1980s to 42 percent in 2016. The big increase appears to have begun from when George W. Bush took office in 2004. What has emerged is a large gender gap among students, especially elite college students, that is about twice as large as that in the general population.
Student trends appear to be a more intense variation on wider developments in American politics. The gender gap in presidential voting among those of all ages has steadily increased, from zero in 1976 to 11-13 points during 2016-20.25 However, the gap in self-professed ideology has not widened as much. American National Election Study (ANES) data presented in Figure 10, using the entire under-30 population as my comparator pool to increase sample size, shows only a small increase in the gender gap among young people for ideology over the past few decades.
Between 1988 and 1996, the discrepancy changed from women favoring conservatism over leftism by 5 points to their favoring leftism by 15 points. Thereafter, the difference among women narrowed to just 5 points in favor of leftism, holding steady through 2016.26 The ideological gender gap therefore appears to be three times as large within the student population as it is outside it.
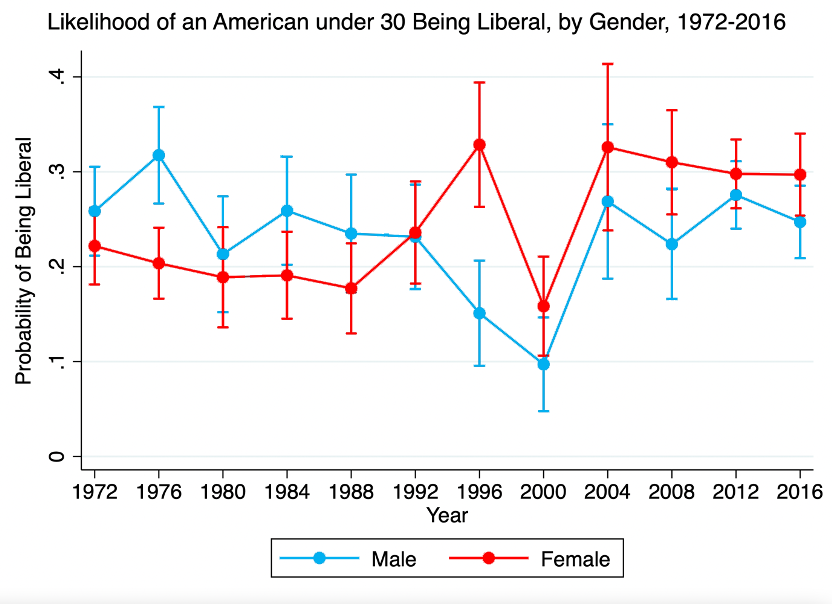
Figure 10. Source: ANES Cumulative File, 1972-2016. Based on all adults under 30, regardless of education level. Models based on logistic regression with year-gender interaction term.
Excluding female colleges and taking the share who identify as left-wing minus the proportion conservative gives an average gender gap in the FIRE data of 29 points between men (who lean left by 44 to 28, or 16 points) and women (who tilt 61-16 left, that is, by 45 points). Democrats likewise have an advantage over Republicans of 42 points among women and 13 points among men, again a 29 point difference. The concentrated effects of the new cultural cleavages in American politics on young educated women (a substantial share of whom are LGBTQ) may explain the large gender gap among students.
Going college-by-college, there is a wide range of gender partisan gaps, from Georgia State, where women lean Republican more than men by 8 points, to the University of Maine, where women are 33 points more Democratic than men. These figures are generally subject to a margin of error of around 6 percent and sampling bias is also a potential issue, so it is difficult to speak precisely about any one institution.
We can have high confidence in the broader patterns, however. Figure 11 plots the gender gap in partisanship by proportion white, since white share appears to be the most important correlate of the gender gap. The gender gap is significantly lower in colleges with fewer white students. This arguably reflects the lower level of political polarization and political mobilization around gender found among minorities.27 The partisan gender gap is not associated with a college’s sex ratio or its political slant.
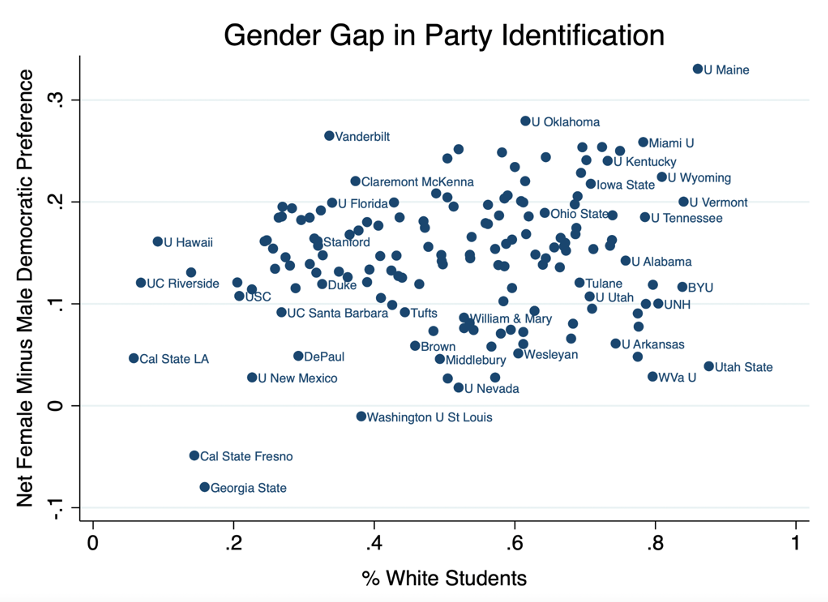
Figure 11. Source: FIRE 2020 and 2021.
The American Student Voter
The large sample size in the FIRE surveys allows us to answer a classic question in electoral studies: which characteristics best predict a student’s partisanship and ideology? In statistical models, race, gender, sexual orientation, and religion account for 24 percent of the variation in students’ 7-point left-conservative ideological identification and 19 percent of the variation in student responses to a 7-point Democrat-to-Republican party identification scale. Logistic regression models using the same parameters have a model fit (pseudo-R2) of .21 for predicting a Republican student and .19 for predicting a conservative. These are strong demographic models for political science: the same specification in the 2020 CCES, with a very similar sample size of around 60,000, predicts 12 to 13 percent of the variation in ideology and partisanship in the general US population. In ANES, albeit with a much smaller national sample, the model predicts just 6 to 10 percent of the variation. Thus race, gender, sexuality, and the religion/nonreligion distinction seem to matter more for the politics of students than the general population.
The most important sociodemographic predictor of a student’s political ideology and party identity is whether they affiliate with a Christian denomination or have no religion. These are two relatively evenly sized groups in the student body at elite colleges, with 44 percent indicating a Christian denominational affiliation (as Catholic, Protestant, Orthodox, Mormon, or ‘Just Christian’) and 38 percent saying that they have no religion. Note that those who identify as Christian may be only nominal Christians who rarely attend church and may not hold religious beliefs. Likewise, some who say they are not religious may hold religious beliefs and even attend a church.28 All else being equal, Christian students are 2.8 times more likely to be Republican than the average. Jewish, Hindu, and Muslim students are, respectively, 2.2, 1.8, and 1.6 times more likely to be Democrats than the typical student.
Race and gender have similar explanatory weight. Whites, who form half the student body, are 2.2 times more likely to be Republican than the typical student, and men are 1.8 times more likely to be so. LGBTQ individuals form a quarter of the student body, an important demographic that renders the heterosexual student population a meaningful category. Straight students are 1.5 times more likely to identify as Republican than the average student.
Seventy-seven percent of students identify as heterosexual, and just 4.6 percent as gay or lesbian. Fully 10.5 percent are bisexual, with the remaining 8 percent roughly spread among pansexual, queer, questioning, or ‘other.’ Heterosexuals and gays/lesbians account for 90 percent of men but only 75 percent of women, showing how prominent the bisexual or other category is among women. When it comes to partisanship, 21 percent of heterosexual females are Republican compared to under 4 percent of lesbian, bisexual, or other women. Among men, the share of Republicans is 32 percent for heterosexuals, 11 percent for bisexual/other, and 8 percent for gay men. This indicates that the sexual orientation gap is 5:1 among women and 3:1 among men, and thus accounts for a larger share of partisan variation among women than men. Together with the fact that nearly 30 percent of women are LGBTQ, this means – in the context of Gen-Z having twice the share of LGBTQ as Millennials, five times that of Gen-X, and eight times that of Boomers29 – that the female sexually-nonconforming group is an important factor that may help explain the leftward drift in the female student population over time.
White Christians are an important subgroup of white students that stand out as especially Republican, considerably more so than either non-white Christians or whites with no religion. Finally, whether a person is in the 62 percent of students receiving financial aid or the 35 percent who are not only matters a little. Those not receiving aid are 1.33 times as likely to be Republican as the average student.30
Figure 12 shows how partisan identity differs by various demographic and social characteristics. Students without religion or who are LGBTQ break around 70-8 in favor of the Democrats. Christians and men are more Republican, but still lean 44-33 to the Democrats. The only Republican-leaning groups are two tiny demographics, those who have been homeschooled (1 percent of students), who lean 44-25 for the GOP, and men in fraternities (3 percent), who are finely balanced at 33-31.
In terms of schooling, results suggest that attending a private or public high school makes little difference for a student’s ideology and party identity, while even among parochial, i.e., religious, high school students (over half of them Catholic), Democrats outnumber Republicans 45-33. Interestingly, around a fifth each of homeschool and parochial school students identified as nonreligious, suggesting considerable religious loss among both groups in young adulthood.31 One further curious finding is that those who attended parochial school or were homeschooled were at least as likely in 2021,and more likely in 2022, to identify as LGBT. In 2022, for instance, female students from a parochial school background were 11 points more likely, and those from a homeschool background 3 points more likely, to identify as non-heterosexual compared to those from public or private school backgrounds. Non-binary and other forms of unconventional gender identity were also higher among homeschooled and parochial schooled undergraduates.
Majors play some role: among white students, social sciences and humanities (SSH) majors lean 59-19 for the Democrats against the Republicans compared to 48-30 for science, technology, engineering, and mathematics (STEM) majors. There is almost no disciplinary gap among minority students, who lean about 64-11 in favor of the Democrats for both sets of majors. The biggest disciplinary difference is the share of those with far-left ideology: overall, 32 percent of SSH majors identify as ‘very left’ the furthest left point on a 7-point ideology scale, compared to 19 percent of STEM majors. There is a smaller difference when it comes to the share of conservatives (20 percent in STEM, 13 percent in SSH). This reflects a similar pattern to what we find among SSH and STEM academics, where the main difference pertains to the share identifying as far left rather than the proportion conservative.32
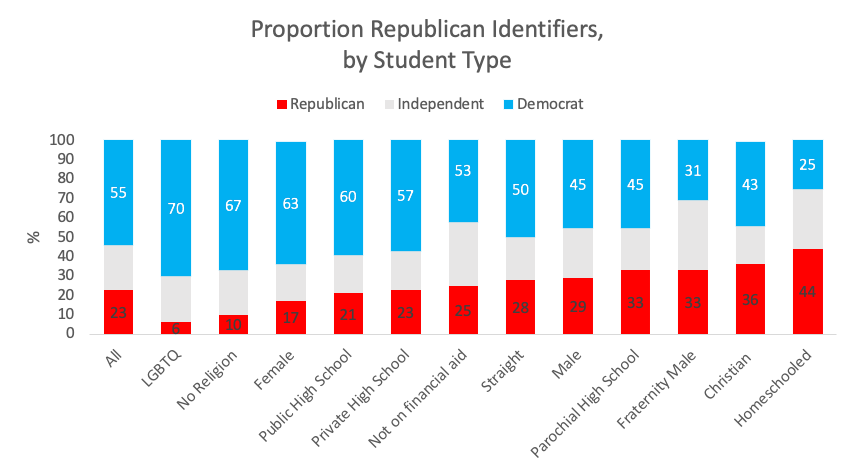
Figure 12. Source: mainly FIRE 2020 and 2021. N=76 fraternity men (sampled only in 2021), 497 parochial schooled, and 778 homeschooled (data from FIRE 2022). N=12,902 for those not on financial aid. Survey weights applied.
Institutions, not just groups of individuals, tend to vary substantially in political composition. Figure 13 reveals that private universities lean more Democratic (62-17) than public ones (51-26). Ivy League campuses are even more left-leaning, with 68 percent of students identifying as Democrats and just 12 percent as Republican. By contrast, the less prestigious R2 colleges are a slightly more balanced 48-27. FIRE’s free speech rankings code those with good free speech policies green and those with censorious policies red, with those in between labeled yellow. This is associated with some differences in viewpoint diversity: green campuses break 52-25 for the Democrats while red ones are a more pronounced 60-17.
Regionally, southern colleges are more conservative, though their students still lean Democratic by a 49-29 margin. Northeastern universities are the least politically diverse, with just 17 percent of students identifying as Republican. While I have focused on differences, it is also worth noting that there is at least some political diversity in each type of institution. Students at Ivy League schools, for example, are 14 percent conservative and 12 percent Republican-leaning. This means that close to 10,000 Republican undergraduate students graduate from Ivy League colleges each year. Alumni include Republican elites such as Josh Hawley, Ted Cruz, Brett Kavanaugh, and Tom Cotton.
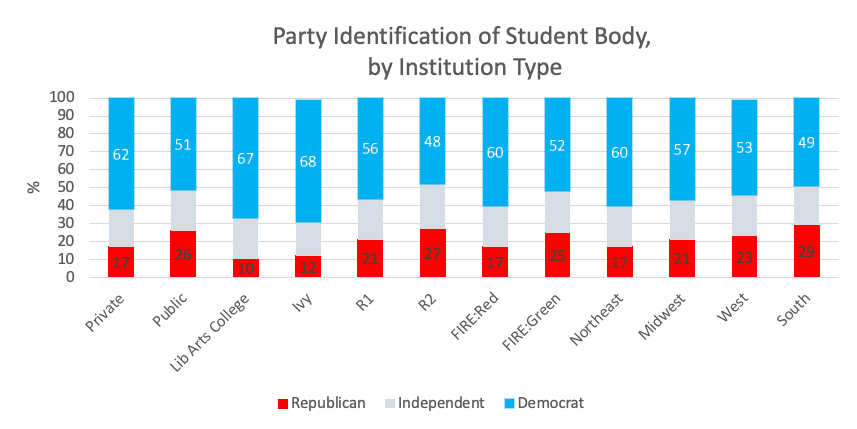
Figure 13. Source: FIRE 2020 and 2021. For smallest categories, N=4,515 Ivy League, 4,078 Liberal Arts College, and 4,140 R2. Data limited to 2021 wave except for figures by region, Ivy League, and public/private which combine 2020 and 2021 data. Survey weights applied.
At the extreme, we can use statistical models to construct subtypes that illustrate the political poles in the student population. For instance, in Figure 14, just 2 percent of the 425 female LGBTQ Ivy League students are Republican, with 85 percent identifying as Democrats. Only 2 percent of 1,586 minority females at Ivy League institutions support the GOP, with 76 percent identifying as Democratic. At the other extreme, nearly 6 in 10 white heterosexual male Christian students are Republicans, and just 21 percent are Democrats. The most finely balanced group is white males, who favor the Democrats over the Republicans by a narrow 40 to 36.
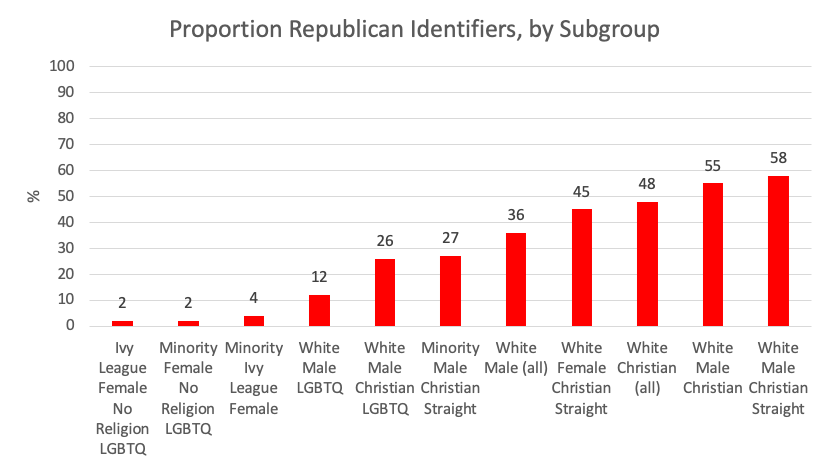
Figure 14. Source: FIRE 2020 and 2021. Note that this is share of 3-party (Rep, Ind, Dem) identity, not 2-party. Smaller sample sizes: N=425 Ivy League female no religion LGBTQ; 1,586 Minority Ivy League female; 450 White male Christian LGBTQ; 1,623 White male LGBTQ. Survey weights applied.
Social Identity Gaps in the Elite Student Population
The pattern that emerges from comparing national election data and FIRE data on elite students is twofold. First, that students are considerably more diverse in terms of sexual orientation and religion than the American public. Second, that gender, and to a lesser degree race, are more important determinants of ideology and party identification among elite students than among the wider public. Religion and sexual orientation have a similar predictive power for both the public and students, but the fact there is a larger share of nonreligious and LGBTQ people among students elevates their importance for predicting the total variation in political attitudes.
In terms of race, what is noticeable when comparing students to the public is how few conservatives there are among minority students compared to the wider minority public. Figure 15 shows that 36 percent of minorities in the CCES (i.e., the public) identify as conservative compared to just 13 percent of minority students in the FIRE sample, a nearly threefold difference. By comparison, 26 percent of white students identify as conservative compared to 47 percent of white adults, less than a twofold discrepancy.
Comparing students with their corresponding 18-25 age group in the wider population shows that minority elite students are markedly more left-leaning (24 points more left and 24 points less conservative) than their non-elite age cohort while white elite students differ less (20 points more left, 10 points less conservative). Moreover, there is only a small difference between white elite students and the white public sample of under-25s in the CCES but a large difference of 13-19 points between elite minority students and young, degree-holding members of the minority public. Minority elite students appear to be distinctively left-wing compared to both their own classmates and their racial peers.
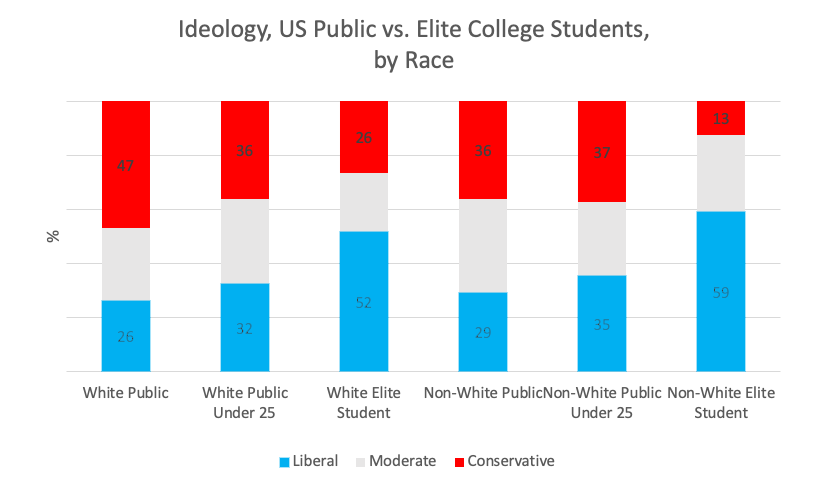
Figure 15. Source: FIRE 2020 and 2021. CCES 2020. Survey weights applied.
Race is also an important variable because sexual orientation, religion, and to some extent gender, tend to split the white population politically more than they do the minority population. Figures 16 and 17 set out the pattern for elite students and the general public respectively. Gaps represent the average of the difference between the conservatism plus the leftism of contrasting identity groups.
In Figure 16, which examines the student population, white men are 16 points more conservative and less left-wing than women, and minority men are 13 points more so than minority women. This is only a modest difference. However, consider the next two sets of bars which show that identity-political dynamics are more intense within the white population. On sexuality, straight whites are 31 points more conservative and less left-wing than LGBTQ whites, while the corresponding gap among minority LGBTQ and heterosexuals is 12 points. On religion, white Christians lean right by 37 points more than whites without religion. For minorities, the difference between Christians and those with no religion is only half as large, at 17 points.
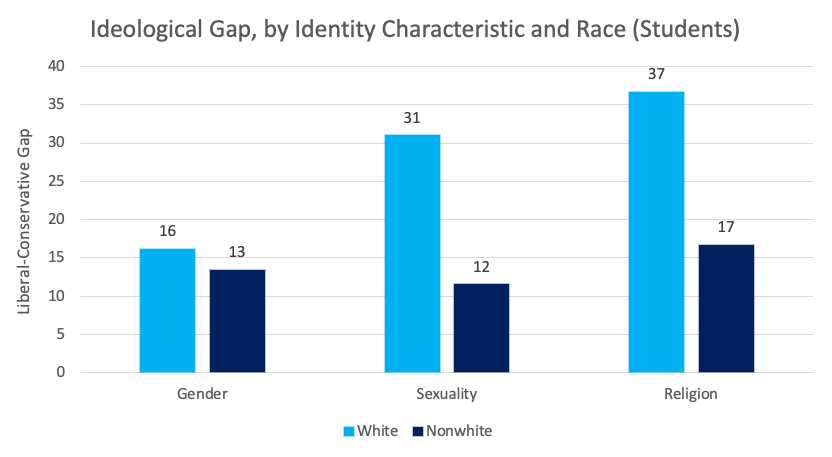
Figure 16. Source: FIRE 2020 and 2021. Survey weights applied. Based on average of conservative and leftist gaps.
Comparing elite students with the wider public in Figure 17 shows one major difference: the gender gap in ideology is a negligible 3 points between men and women, whether white or non-white. Men and women in general do not differ much in their leftism or conservatism in the wider public. This contrasts with the 16-point difference among white students and 13-point gap among non-white students in Figure 16. Clearly gender is a more salient political divide on campus than off it.
By contrast, the other sets of bars look relatively similar between students and the public. Identity divides around sexuality and religion loom much larger among whites than among minorities, as with the student figures. LGBTQ members of the public who are white are 25 points more left than heterosexual whites, and minority LGBTQ citizens are 10 points more left than their heterosexual minority counterparts. On religion we find a 25-point gap between white Christians and whites without religion, and a 9-point gap between minority Christians and minority members of the public without religion. These ideological differences are around 10 points smaller among the public than among elite students, but what really stands out in the public sample in Figure 17, compared to students, is how muted the gender gap is.
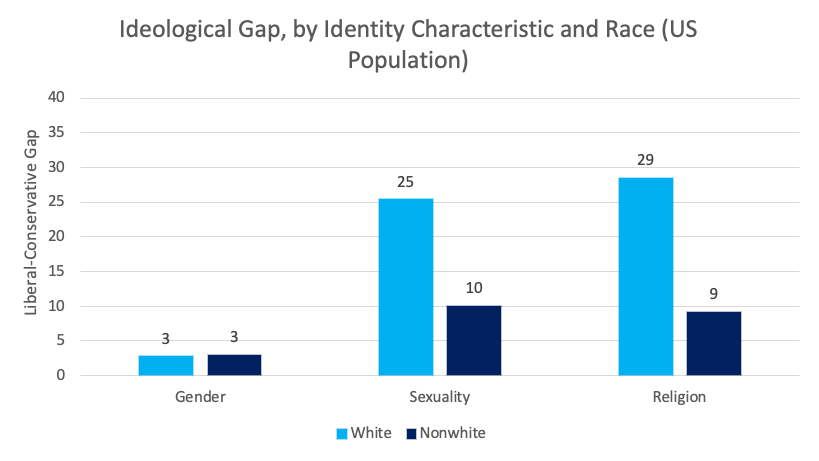
Figure 17. Source: CCES 2020. Survey weights applied. N=61,000.
Could it be that the educated public resembles elite students? Or that things are different with party identification as opposed to ideology? Turning to party identification in Figure 18 and comparing elite students with members of the public that have a degree shows some interesting patterns. First, there is no difference in the partisan race gap between students and the graduate public. In both demographics, whites are around 15 points more Republican and less Democratic than non-whites.
The same is true of religion, the rightmost set of bars, where Christian students and the Christian educated public are around 25 points more Republican and less Democratic than their nonreligious counterparts. LGBTQ citizens differ from straight citizens more among the public (18 points) than among students (13 points), which may reflect the fact that the LGBTQ share is a smaller and perhaps more self-conscious group among the public than among students, where they brook larger. What really stands out, however, is that the 15-point partisan gap between male and female elite students is much larger than the 8-point difference in the educated public. If we compare with the wider public rather than the educated public, the partisan gender gap declines to 4 points. The under-25 public has a gender gap of 6 points. If we compare with the college-educated public under age 25, the partisan gap rises to 10 points.
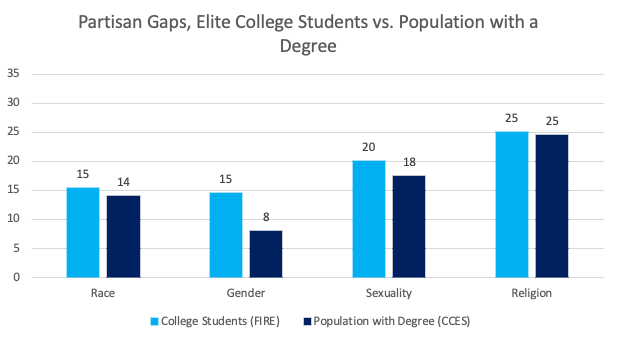
Figure 18. Source: FIRE 2020 and 2021. CCES 2020. Survey weights applied.
Figure 19 shows the same pattern with ideology gaps, though this time students show a larger gap around sexuality and race. So college education and youth are both associated with a larger partisan gender gap, but this appears to be supercharged in elite colleges to produce a student gap of 15 points for both partisanship and ideology. Something about young, elite, educated environments accentuates the importance of gender, and to a lesser degree sexuality and race, for politics in a way less true for older generations of college graduates. This echoes what we saw in the preceding two charts, where the gender gap in ideology was about five times higher among students than the general public.
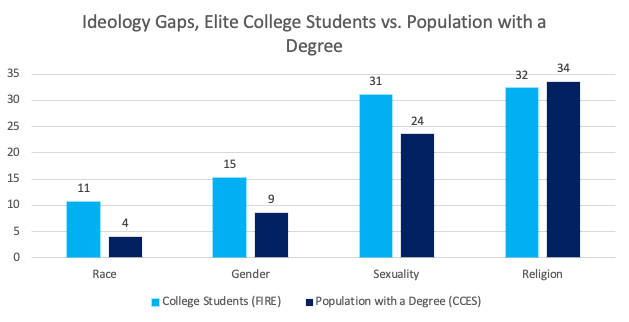
Figure 19. Source: FIRE 2020 and 2021. CCES 2020. Survey weights applied.
Women and minorities are especially likely to lean left on elite campuses compared to their counterparts in the general public. Figure 20 shows that female students are 33 points more left and 27 points less conservative than women in the population. Even minority women under 25 with a degree in the public are almost twice as likely as elite student women to identify as conservative. Powerful selection effects, combined with the possible impact of collegiate socialization in elite networks, seem to result in women and minorities in top universities positioning themselves sharply to the left of the public.
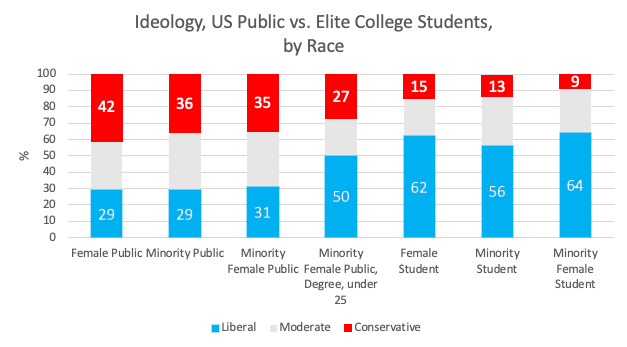
Figure 20. Source: FIRE 2020 and 2021. CCES 2020. Survey weights applied.
The same holds for LGBTQ students, who are 30 points more left than the LGBTQ population and 14 points more left than the LGBTQ under-25 college-educated population. Those without religion are 30 points more left than the nonreligious public, though they are only 8 points more left than the young, college-educated, nonreligious population.
This does not simply represent a blanket effect of elite college status acting uniformly on all groups via selection or socialization effects, for elite university students who are from stereotypically conservative demographics differ less from the public. By way of illustration, Figure 21 shows that the Republican-Democrat partisanship ratio is relatively similar among white and Christian students compared to their counterparts with degrees off-campus. Indeed, White Christian male elite students are slightly more Republican than the college-educated population of white Christian males. Thus, it is only left-leaning demographic groups that seem to exhibit an unusually high left-wing Democrat skew on campus – especially women and, with respect to leftism, minorities.
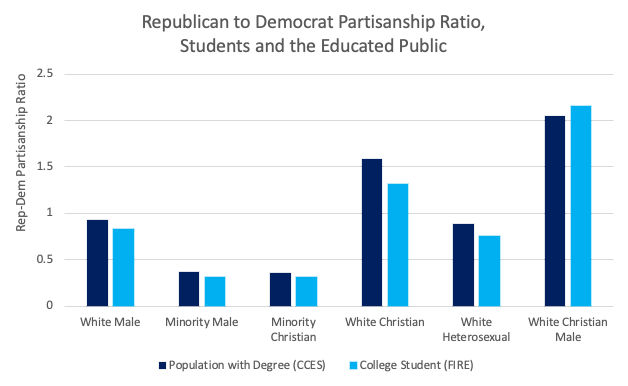
Figure 21. Source: FIRE 2020 and 2021. CCES 2020. Survey weights applied.
Do Economic Factors Matter?
A notable feature of elite student opinion is the relative dominance of group identity in predicting ideology and party affiliation. By contrast, economic factors play a relatively modest role. Figure 22 shows that those not on financial aid (35 percent of the sample) are 5 points more likely than the 62 percent of students on financial aid to be Republican identifiers. Those from a private school background are 2 points more Republican than those from public high schools. Those who describe their family’s financial situation as upper class or upper-middle class are 6 points more Republican than those from a working-class or lower-class background. On the other hand, those attending more expensive private universities are 6 points less likely to identify as Republican than those attending public universities. Regardless of whether there is a consistent effect, these variables explain only about half a percent of the variation in a 7-point scale of party identification. This is about the same-sized effect as family income in predicting party identification among the wider public, suggesting that material factors tell us very little about partisanship and ideology, whether on- or off-campus. Identity, associated more with cultural than economic cleavages, very much dominates sociodemographic models of political belief.
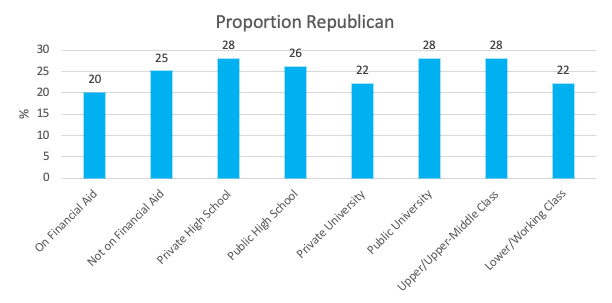
Figure 22. Source: FIRE 2020-2021.
Are Students Influenced by their Peers’ Politics?
Given the substantial left skew among students and professors alike, a substantial literature has emerged seeking to ascertain whether university influences the ideology and politics of students. Some claim a university education makes students more left while others argue it has no effect.33 The FIRE data are purely cross-sectional, derived from single snapshots in time. As such, they do not permit us to see whether individual students’ views change over their time at college. We can look at different graduating classes to see if those that have been at university longer are more left or Democratic. Here the data show no significant difference in leftism or Democratic voting between older and younger students, indicating that the university experience is probably not having much effect on students’ political beliefs. It could be the case that students’ politics are leftized very early in their college experience, or that aging and university socialization counteract each other. Still, these findings seem to reinforce the existing literature that finds little effect of university on students’ political attitudes.34
Even if the average effect appears minimal, it may be that concentrations of left or conservative students exert a peer effect on individual student attitudes. The FIRE data show apparent evidence for a small effect in which conservative students shift rightward in more conservative universities whereas black, Asian, and LGBTQ students resist moving right in such environments. Dividing colleges into four equal-sized quartiles based on students’ average ideology gives three quartiles of left-leaning colleges and a centrist quartile where colleges lean slightly left or right of center. Figure 23 shows that in centrist colleges, net of other key identity variables, political moderates who are heterosexual (left chart) or white (right chart) are around 10-12 points more likely to identify as Republican. By contrast, LGBTQ and black moderates on centrist campuses are about as likely to identify as Republican on leftist and centrist campuses. For Hispanic and Asian moderates, centrist campuses are associated with a slightly higher likelihood of identifying as Republican.
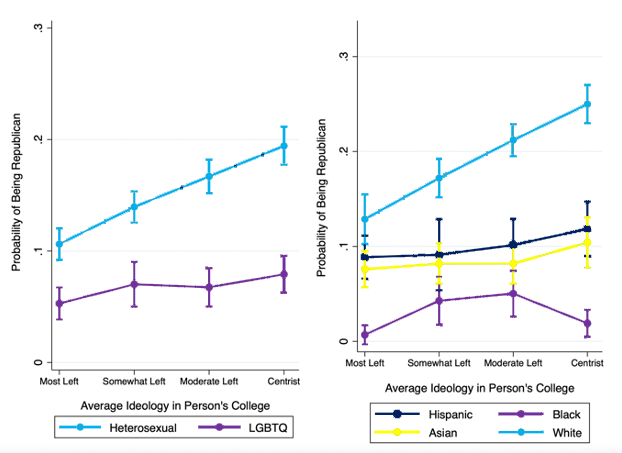
Figure 23. Probability of a moderate student identifying as Republican, based on sexual orientation, gender, and campus ideology. Source: FIRE 2020 and 2021. Left chart N=14,289 moderates with Pseudo-R2=.078. Right chart N=12,336 moderates with Pseudo-R2=.095. Standard errors clustered on school. Controls for gender, year of study, wave, religion, average white share and, where relevant, race or sexuality.
We can similarly observe the relationship between campus political climate and ideology. Figure 24 illustrates how white independents are about 6 points more likely to identify as conservative on a centrist campus than on a highly Democratic one while black independents react to a more right-leaning climate by shifting 4 points away from conservatism. In the right-hand chart, Christian students are about 5 points more likely to be conservatives on centrist campuses than if they attend a college in one of the left-leaning three quartiles. The fact the sample is restricted to independents in this chart and moderates in the previous one, as well as the fact that white, heterosexual, and Christian students display different effects from LGBTQ, nonreligious, and minority students in centrist political environments, suggest that these patterns are more likely to be the result of campus climates than self-selection effects.35
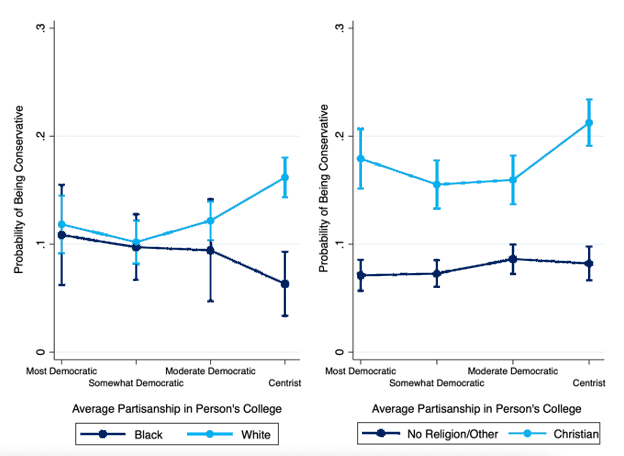
Figure 24. Probability of an independent student identifying as conservative, based on race, religion, and campus ideology. Source: FIRE 2020 and 2021. Left chart N=10,476 Independents with Pseudo-R=.080. Right chart N=12,285 moderates with Pseudo-R2=.069. Standard errors clustered on school. Controls for gender, year of study, wave, sexuality, average white share, and race or religion where relevant.
Attitudes and Partisanship
In the FIRE data, a 7-point left-right scale accounts for 59 percent of the variation in a 7-point Strong Democrat to Strong Republican partisanship scale. Using a 5-point ideology scale by collapsing the 7-point scale still predicts 56 percent of the variation in partisanship. Among the general public, a 5-point left to conservative scale predicts 45 percent of the variation in the same 7-point scale in the CCES overall, but this rises to 55 percent among the university-educated. Among those who are 25 and under with a degree, ideology explains just 42 percent of the variation, 14 points less than among elite students in the FIRE survey. The CCES data shows that young people are less likely than their elders to sort ‘correctly’ by pinning the tail of ideology onto the donkey of partisanship. All of which throws the strong association between ideology and partisanship among elite students into relief and indicates a relatively politicized context.
If I examine both group identities and a suite of attitudes toward no-platforming controversial left- and right-wing speakers, as well as attitudes to obstructing speech, it becomes clear that these are powerful predictors of partisanship. Controversial left speakers included those arguing that “Religious liberty is used as an excuse to discriminate against gays,” “White people are collectively responsible for structural racism and use it to protect their privilege,” “The police should be abolished because they are racist,” and “Looting is a justifiable form of protest.” Controversial right-wing speakers were those claiming “Black Lives Matter is a hate group,” “Transgender people have a mental disorder,” and “All abortion should be illegal.” Responses were combined into separate indices through principal components analysis. On speech obstruction, questions on whether it is acceptable to shout down, block or use violence against a speaker were combined into a similar index.
Figure 25 compares the effects from two models. The first contains identity characteristics and the average partisan lean on an individual’s campus. This accounts for 22 percent of the variation (18 percent without average partisan lean included). The three indices predict 28 percent of the variation, rising to 35 percent when identity characteristics and party lean are added to the model. Support for banning right-wing speakers has by far the strongest predictive power, with a standardized effect size (beta) of over .4 in predicting a Democratic rather than Republican lean. Those who support banning left-wing speakers are significantly more likely to lean toward the GOP, but this parameter is only half as predictive of partisanship as support for banning right-wing speakers. Those who oppose shoutdowns, blocking, and violence lean right, but this is less predictive than the no-platforming variables. This indicates that those on the right have an element of bipartisan free speech consistency while those on the left are somewhat bipartisan in their relatively restrictive stance on speech, even for controversial left-wing speakers.
Comparing the identity and attitudes models shows that adding attitudes to speech restriction to the model greatly erodes the impact of gender. This is largely because women are substantially more restrictive than men on the left no-platforming scales, though much less so on the obstruction of speakers scale. LGBTQ students, by contrast, are much more restrictive than heterosexuals in terms of speech obstruction but less so on no-platforming. The net effect, however, is that the effect size on the sexual minority parameter drops considerably once the speech attitudes are added to the model. White Christians are the most important pro-Republican group, and this is the most important identity variable for predicting partisanship. It retains much of its predictive power even when speech attitudes are included in the groups plus attitudes model.
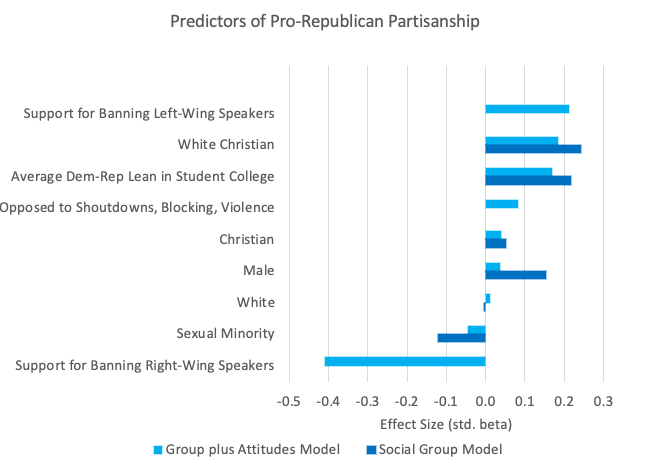
Figure 25. Source: FIRE 2020 and 2021.
Viewpoint Diversity
The foregoing discussion of the political composition of colleges showed that three of four quartiles of elite universities lean left and Democratic. Only the fourth quartile of colleges has a relatively even balance of left-wingers and conservatives, Democrats and Republicans. Figure 26 plots all 159 colleges by average ideology on a 7-point scale, noting their share of leftists in blue and conservatives in red. Each college has two vertically aligned dots. Were it not for variation in the average share of moderates per college, the two lines would be perfect mirror images of each other.
The first point to note is the strong left tilt of most colleges. At the extreme, Wesleyan is less than 1 percent conservative and 86 percent left. A number of liberal arts colleges are in this extreme range of political homogeneity, with nine institutions containing fewer than 5 percent conservatives. At the other extreme, Hillsdale College is the only clearly conservative university in the data, at 76 percent conservative and 11 percent left.
Only 14 institutions contain more conservative than left-wing students, a similar number to the colleges in the dataset that contain less than 5 percent conservatives. Moving from left to right, we encounter a number of Ivy League schools, with Brown the most left-leaning and Princeton the least – though even Princeton is 64 percent left and just 15 percent conservative. Despite stereotypes, the University of Kentucky has 2.5 leftists for every conservative student while Arizona State leans left by almost a 2-to-1 margin. Only when we arrive at a number of flagship universities in the South or inland West do we encounter politically balanced schools like Texas Tech, the University of Arkansas, Baylor, or the University of Mississippi. Finally, at the right of the chart, we see the only two colleges with anything close to a conservative majority, Utah State (49 percent conservative), Brigham Young University (BYU) (48 percent), and Hillsdale College (76 percent). Plots by party identification show a very similar pattern: thus, only two colleges have a Republican majority: Utah State (51 percent) and Hillsdale (72 percent).
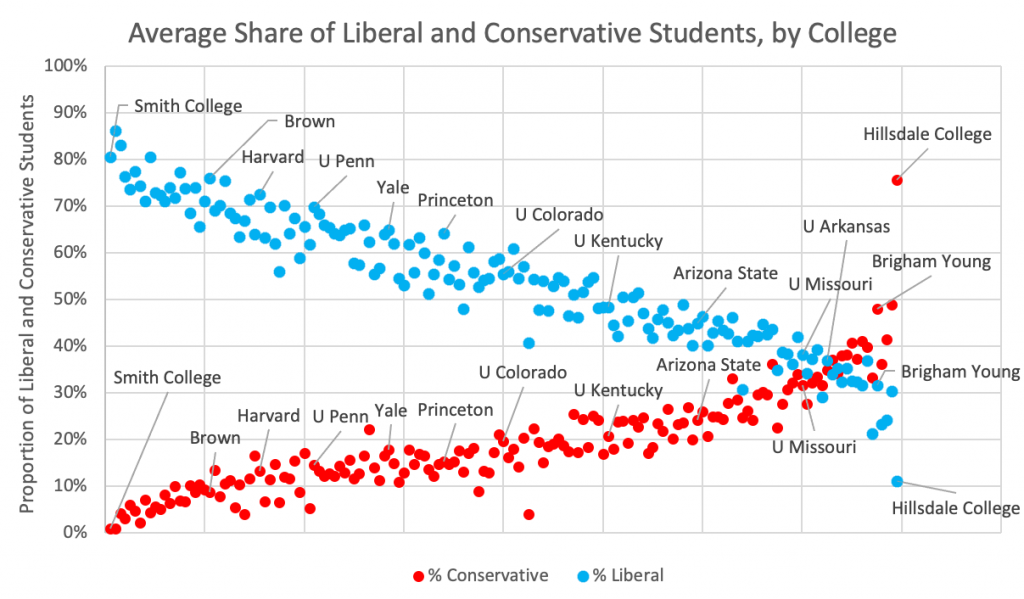
Figure 26. Source: FIRE 2020 and 2021. Survey weights applied.
A list of the ten most right-leaning and left-leaning student bodies appears in figures 27 and 28. The dominance of mainly New England liberal arts colleges among the most left-wing institutions at the left of the chart, and of universities in the South and inland West on the right, is evident.
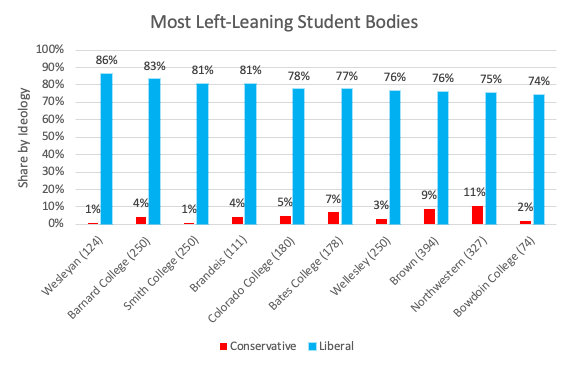
Figure 27. Source: FIRE 2020 and 2021. Survey weights applied. Sample size in brackets, excludes moderates.
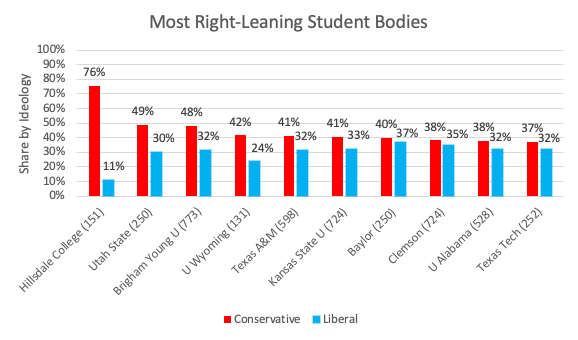
Figure 28. Source: FIRE 2020 and 2021. Survey weights applied. Sample size in brackets, excludes moderates.
To derive a measure of viewpoint diversity, I draw on two questions in the FIRE survey data. First, the 7-point ‘very left’ to ‘very conservative’ ideology question. Second, the 7-point ‘Strong Democrat’ to ‘Strong Republican’ party identification question. The mid-point in both is 4 (moderate, Independent). My Index of Viewpoint Diversity (IVD) is calculated by adding together the two indices, then subtracting the sum from 8, which represents a sum of the mid-points of the two scales. The absolute value of this figure yields a range from 0 to 6, where the most diverse institutions score a 0, the least diverse a 6. The results, plotted in Figure 29, show that most colleges have at least some viewpoint diversity insofar as their students are not 100 percent clustered at either the ‘very liberal’/Strong Democrat or ‘very conservative’/Strong Republican pole.
However, it is also evident that high viewpoint diversity scores are generally found in institutions in the highest quartile of conservative students, with those at the optimum score tending to have 3 in 10 students conservative, 3 in 10 left, and 4 in 10 moderate. An index score above 2 indicates that students are, on average, more doctrinaire than party leaners or the ‘slightly’ ideological. Using this cutoff point, Hillsdale is the only low viewpoint diversity institution that leans right. Among the 14 right-leaning institutions, all but Hillsdale have high viewpoint diversity: an IVD of 1 or below.
At the other end of the index, 63 left-leaning colleges have low viewpoint diversity (IVD above 2), with quite a few liberal arts colleges in the extreme 3 to 4 range. Twenty-nine colleges with more left- than right-leaning students have a low IVD below 1, but fully 116 have an IVD above 1 – compared to just one of the 14 right-leaning colleges. Importantly, one-third of low viewpoint diversity colleges are lower-ranked R2 or R3 schools and none are left arts colleges. By contrast, 83 percent of very low viewpoint diversity schools (IVD above 3) are liberal arts colleges, and none are R2 or R3 schools. In fact, all but one (Trinity College) of the 23 liberal arts colleges in the survey data have an IVD above 2, indicating low viewpoint diversity.
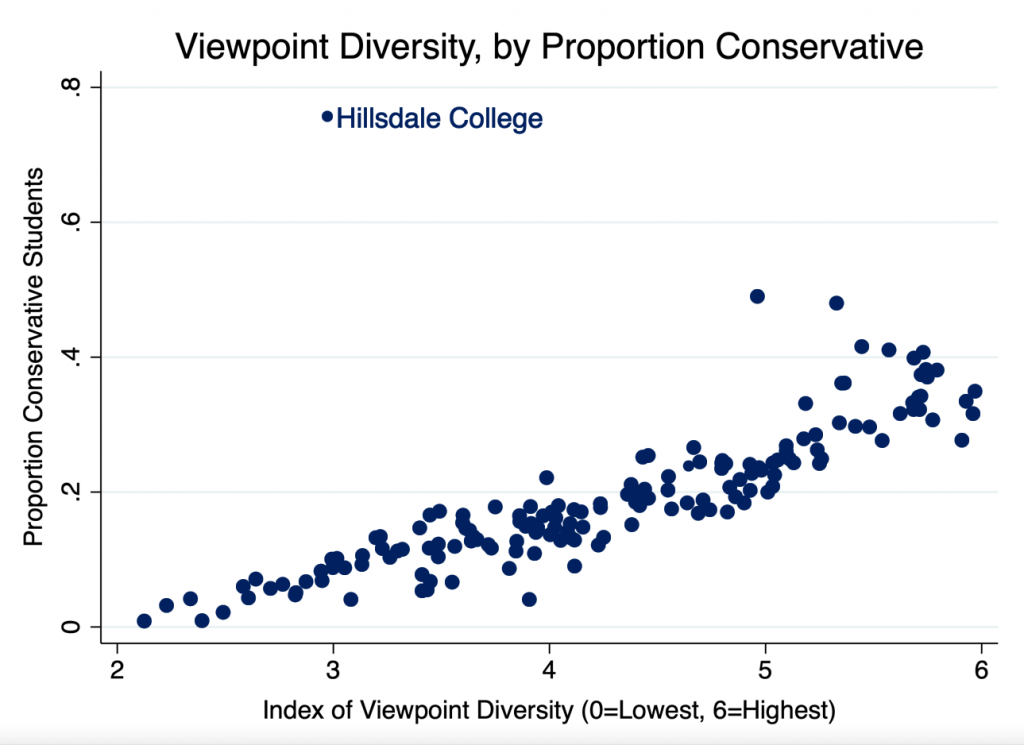
Figure 29. Source: FIRE 2020 and 2021. Survey weights applied. Sample size in brackets, excludes moderates.
Based on the index, the top 10 institutions for viewpoint diversity are given in table 1, and the bottom 10 in table 2. Flagship state universities in the South dominate the top rankings while the bottom 10 consist entirely of liberal arts colleges. The full set of rankings appears in the appendix.
Table 1. Top 10 Colleges for Highest Viewpoint Diversity
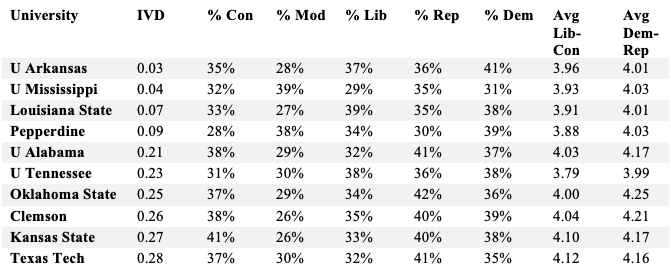
Source: FIRE 2020 and 2021. Survey weights applied.
Table 2. Bottom 10 Colleges for Viewpoint Diversity
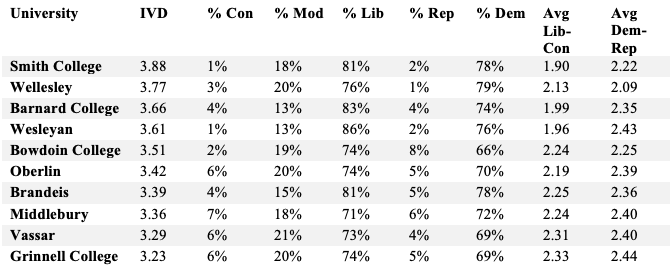
Source: FIRE 2020 and 2021. Survey weights applied.
As of writing, the 2022 data has just been released. The rankings look very similar, even as modest sampling error would be expected to result in some shuffling between institutions. The University of Alabama, Texas Tech, University of Tennessee, University of Arkansas, Texas A&M, Montana State, Bowling Green, Purdue, Penn State and Boise State form the top ten for viewpoint diversity in 2022. Grinnell, Wheaton, Georgia State, Colorado College, Bard College, Hillsdale, NYU, Vassar, Knox and Colorado College score lowest. The data weights make it difficult to achieve pinpoint accuracy in the rankings because the raw partisanship and ideology percentages are adjusted to account for a college’s race, gender, voter registration and financial aid composition.
Regardless, the broad patterns by college type are crystal clear. These rankings suggest that those seeking to experience a wide range of political opinions are best advised to attend a flagship state university, R2 or R3 school, and avoid liberal arts colleges. Ivy League schools lean heavily left-leaning but, in contrast to liberal arts colleges, contain a 10-15 percent conservative minority – many of whom do not have conservative parents. In a future report, I will examine the important link between viewpoint diversity and expressive freedom on campus.36
Conclusion
This report has examined the demographic and political composition of 159 leading universities based on surveys of 57,000 undergraduate students. It shows that elite students lean left and Democratic by a margin of 2.5 to 1. This places them to the left of the median voter, the young and college-educated public, and students attending lower-ranked colleges.
Today’s elite students are substantially more diverse in terms of race, sexuality, and religiosity than elite students of the 1980s and 90s. A quarter identify as LGBTQ, and the share with no religion is nearly as large as the proportion who are Christian. In addition, these identity characteristics matter more for students’ political opinions than they do for the public. Consequently, women, minorities, and LGBTQ students at leading universities lean considerably further left than members of their identity groups in the wider population, even compared to those that are young and college-educated.
Only a quarter of students are white, heterosexual, and identify as Christian. White straight Christian men make up little more than 10 percent of the total. White Christians, white conservatives, and white males, therefore, appear to be increasingly self-conscious minorities on today’s leftists and secular elite campuses. The level of segregation of white conservatives and Christians within the elite college system is notably higher than the clustering of white left-wingers, minority conservatives, and minority Christians among elite universities. In contrast, white Christian, white male, and white heterosexual elite students differ much less from members of their group in the wider public than female, minority, and LGBTQ elite students. Young leftists, especially minority left-wingers, seem to cluster towards elite universities but are not institutionally segregated among them. Conservatives, especially white conservatives, do not cluster toward elite schools but are relatively institutionally segregated among them.
In the leftist-dominated elite college system, viewpoint diversity is strongly associated with colleges that recruit more conservative students. State flagship universities in the South or inland West have the highest levels of viewpoint diversity. Liberal arts colleges, many in New England, have the lowest levels of viewpoint diversity. Whether the former can capitalize on their political diversity, and the latter take steps to improve theirs, turns on whether university leaders consider viewpoint diversity as important as more conventional forms of diversity.
Far from being a monolithic bloc, students in today’s leading universities are diverse and divided. That is, there is more sexual, religious, racial, and gender diversity among elite students than in the past, and these identities are more strongly connected to ideology and partisanship. The gap in party identification between male and female students, for instance, has risen steadily since the early 2000s to the point where female elite students are 18 points more likely to be Democrats and 12 points less likely to be Republicans than their male classmates.
Elite students will supply many of the leaders of tomorrow’s America, so it is vital to understand trends among them. The country has polarized substantially since the 1980s, and the profile of cultural issues around identity – race, gender, and sexuality – has risen in the media and national politics. All this as the decline of religion among young people reconfigures society and elevates religious ‘nones’ to prominence as a political constituency. Elite students furnish leading indicators of what may be emerging and present a more intense, magnified version of national political trends. This portends a politics in which elite women, minorities, gays, and the nonreligious are more left-leaning while elite whites, males, and Christians remain relatively conservative.
Appendix
One can find an interactive version of the table below at http://www.sneps.net/viewpoint-diversity-ranking-of-leading-us-colleges.
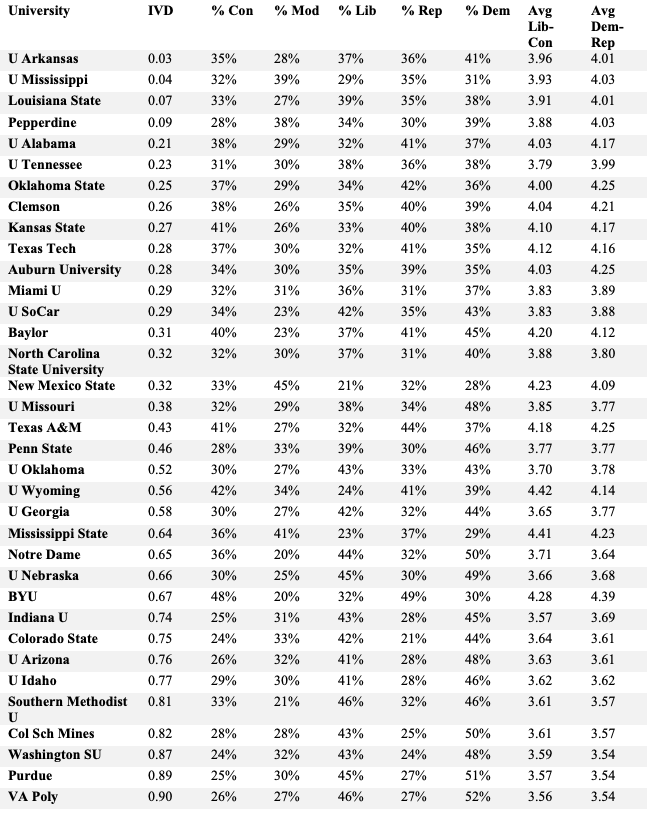
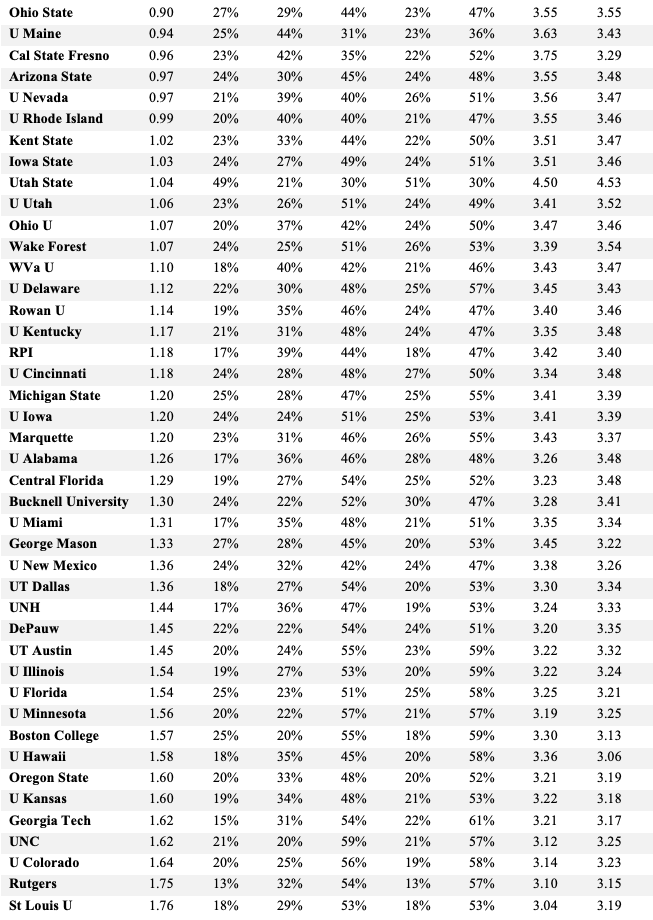
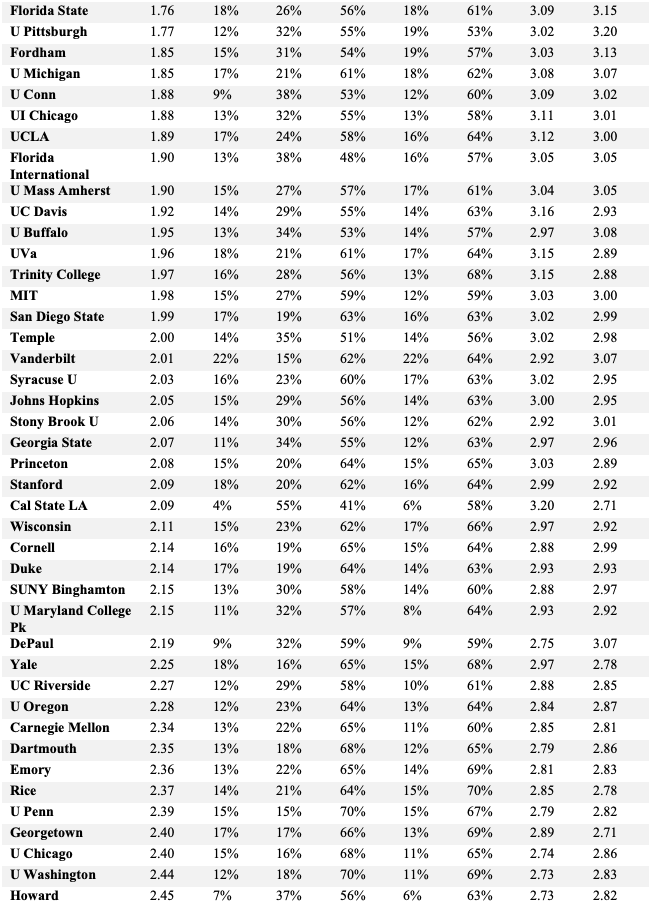
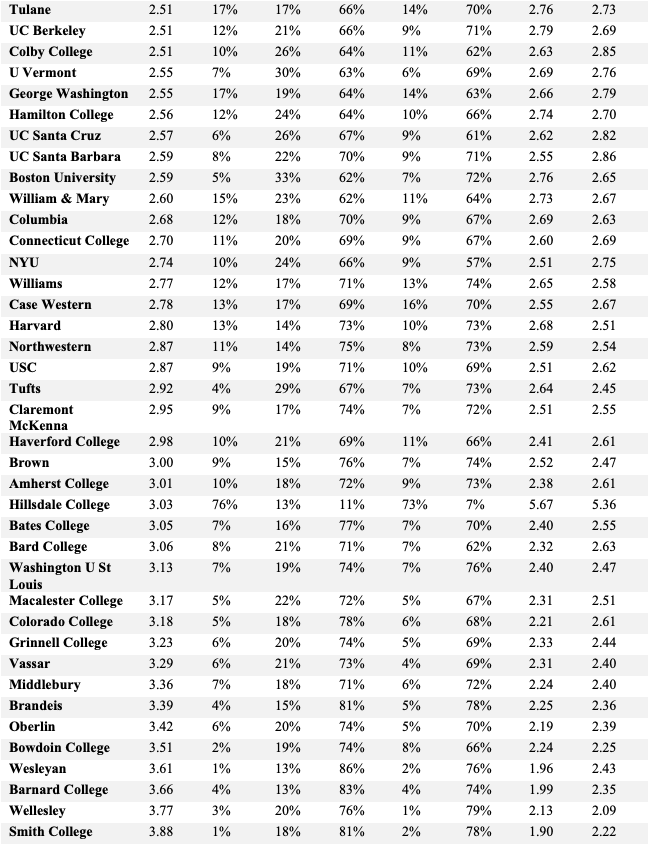
References
1 “2020 College Free Speech Rankings.” 2020. FIRE. https://www.thefire.org/research/publications/student-surveys/2020-college-free-speech-rankings/; “2021 College Free Speech Rankings.” 2021. FIRE. https://www.thefire.org/research/publications/student-surveys/2021-college-free-speech-rankings/.
2 Stolzenberg, Ellen Bara, Melissa C. Aragon, Edgar Romo, Victoria Couch, Destiny McLennan, M. Kevin Eagan and Nathaniel Kang. 2020. “The American Freshmen: National Norms, Fall 2019.” Higher Education Research Institute (HERI). https://www.heri.ucla.edu/monographs/TheAmericanFreshman2019.pdf.
3 For further details on the FIRE survey methodology, see https://www.thefire.org/research/publications/student-surveys/2021-college-free-speech-rankings/.
4 TCM Staff, 2020. “The Demographics of the Ivy League.” The College Monk. https://www.thecollegemonk.com/blog/ivy-league-demographics.
5 Frey, William H. 2020. “Less than Half of US Children Under 15 are White, Census Shows.” The Brookings Institution. https://www.brookings.edu/research/less-than-half-of-us-children-under-15-are-white-census-shows/.
6 Johnson, Dirk. 1986. “Yale’s Limit on Jewish Enrollment Lasted Until Early 1960’s, Book Says.” New York Times. https://www.nytimes.com/1986/03/04/nyregion/yale-s-limit-on-jewish-enrollment-lasted-until-early-1960-s-book-says.html.
7 Telushkin, Shira. 2018. “The Vanishing Ivy League Jew.” Tablet Magazine. https://www.tabletmag.com/sections/news/articles/the-vanishing-ivy-league-jew.
8 Langbert, M. 2018 “Homogenous: The Political Affiliations of Elite Liberal Arts College Faculty.” Academic Questions 31(2): 186-197.
9 Those giving uncertain or ‘none of the above’ responses were coded as moderate (for ideology) or Independent (for partisanship).
10 American National Election Studies (ANES). 2020. https://electionstudies.org.
11 Hess, Abigail Johnson. “The 2020 Election Shows Gen Z’s Voting Power for Years to Come.” CNBC Make It. https://www.cnbc.com/2020/11/18/the-2020-election-shows-gen-zs-voting-power-for-years-to-come.html.
12 Abrams, Sam and Amna Khalid. 2020. “Are Colleges and Universities Too Liberal? What the Research Says About the Political Composition of Campuses and Campus Climate.” Heterodox Academy. https://heterodoxacademy.org/blog/are-colleges-and-universities-too-liberal-what-the-research-says-about-the-political-composition-of-campuses-and-campus-climate/.
13 Stolzenberg et al. 2020.
14 Cox, Daniel A., Ryan Streeter, Samuel J. Abrams and Jacqueline Clemence. 2020. “Socially Distant: How our Divided Social Networks Explain our Politics: Findings from the American National Social Network Survey.” Survey Center on American Life. https://www.americansurveycenter.org/research/socially-distant-how-our-divided-social-networks-explain-our-politics/.
15 Bishop, B. and R. G. Cushing. 2008. “The Big Sort: Why the Clustering of Like-Minded America is Tearing Us Apart.” Houghton Mifflin.
16 Wilkinson, Will. 2019. “The Density Divide: Urbanization, Polarization, and Populist Backlash.” Niskanen Center. https://www.niskanencenter.org/the-density-divide-urbanization-polarization-and-populist-backlash/.
17 Cox et al. 2020.
18 Yudkin, Daniel, Stephen Hawkins and Tim Dixon. “The Perception Gap: How False Impressions are Pulling Americans Apart.” More in Common. https://psyarxiv.com/r3h5q/download?format=pdf.
19 Peuquet, Steven W. N.D. “Using the ‘Index of Dissimilarity’ to Measure Residential Racial Segregation.” Center for Community Research & Service, University of Delaware. https://www1.udel.edu/uapp800/Lecture percent20Material/Index percent20of percent20Dissimilarity percent20Example.htm.
20 Logan, John R. and Brian J. Stults. 2021. “Metropolitan Segregation: No Breakthrough in Sight.” Brown.edu. https://s4.ad.brown.edu/Projects/Diversity/Data/Report/report08122021.pdf.
21 Based on a state fixed-effects model of average white share across colleges.
22 Abramowitz, A. I. 2018. “The Great Alignment: Race, Party Transformation, and the Rise of Donald Trump.” Yale University Press.
23 “Number of Undergraduate Students Enrolled in the United States from 1976 to 2019, by Ethnicity.” 2021. Statista. https://www.statista.com/statistics/236489/undergraduate-enrollment-by-ethnicity-in-the-us/; “Higher Education Enrollment Trends by Gender, 1970 to 2025.” 2019. Educational Policy Institute. https://educationalpolicy.org/hello-world/; “Indicator 20: Undergraduate Enrollment.” 2019. National Center for Education Statistics. https://nces.ed.gov/programs/raceindicators/indicator_reb.asp.
24 Brint, Steven, Michaela Curran and Matthew C. Mahutga. 2022. “Are US Professionals and Managers More Left Than Blue-Collar Workers? An Analysis of the General Social Survey, 1974 to 2018.” Socius; Chong, Dennis, Morris Levy and Jack Citrin, “Tolerance of Controversial Political and Social Expression in the United States” Paper presented at 2021 American Political Science Association meetings, Seattle.
25 Burden, Barry C., Evan Crawford and Michael G. DeCrescenzo. 2017. “The Unexpected Gender Gap of 2016.” De Gruyter. https://www.degruyter.com/document/doi/10.1515/for-2016-0039/html; “National Exit Polls: How Different Groups Voted.” 2020. The New York Times. https://www.nytimes.com/interactive/2020/11/03/us/elections/exit-polls-president.html.
26 Controlling for income. The university-educated ANES sample shows an even smaller gap but is likely too small to base estimates on.
27 Philpot, T. S. 2017. “Conservative but Not Republican.” Cambridge University Press; Kaufmann, Eric, “Black Moderation: Why African-Americans are Less Polarized.” Paper for 2021 American Political Science Association conference, Seattle.
28 Putnam, R. D. and D. Campbell. 2010. “American Grace: How Religion Unites and Divides Us.” Simon and Schuster.
29 Jones 2022.
30 The financial aid measure is not strictly an indicator of wealth. Attendance at private school, for instance, does not predict Republican identity, and is only partially associated with not receiving financial aid. Self-described socioeconomic class (5-point scale from upper to lower) based on the question “thinking about your family’s financial situation… how would you describe your social class” also did not predict party identity. Only just over a quarter of those who are not receiving financial aid attended private high school, though this is nearly twice as high a share compared to those receiving financial aid in the form of grants or loans. Exactly why those who are not receiving aid are more Republican while those who attended private school or are upper class are not is a puzzle that merits further investigation.
31 Jews only make up 1 percent of the parochial school sample.
32 Kaufmann, Eric. 2021. “Academic Freedom in Crisis: Punishment, Political Discrimination, and Self-Censorship.” Center for the Study of Partisanship and Ideology. https://www.cspicenter.com/p/academic-freedom-in-crisis-punishment.
33 Woessner, M. and A. Kelly-Woessner. 2009. “I Think My Professor is a Democrat: Considering Whether Students Recognize and React to Faculty Politics.” PS: Political Science and Politics 42(2): 343-352; Surridge, P. 2016. “Education and Liberalism: Pursuing the Link.” Oxford Review of Education 42(2): 146-164; Lancee, B. and O. Sarrasin. 2015. “Educated Preferences or Selection Effects? A Longitudinal Analysis of the Impact of Educational Attainment on Attitudes Towards Immigrants.” European Sociological Review 31(4): 490-501.
34 See Woessner and Woessner and Lancee and Sarrasin papers in previous footnote.
35 It is of course possible that what these show is a rising Republican or conservative effect arising from unenumerated factors not in the FIRE dataset, with a reactive effect among minorities rather than among whites, heterosexuals, and Christians.
36 One finding from the 2021 FIRE Campus Expression Survey was that self-censorship was high in heavily leftist schools like the University of Chicago, despite its top ranking on free speech policies.
* Rebublished with kind permission by the author from: Kaufmann E. (2022). Diverse and Divided: A Political Demography of American Elite Students. CSPI Report No. 7. CSPI. URL: https://www.cspicenter.com/p/diverse-and-divided-a-political-demography
** In the MIWI publication the original US-American terminology “liberal”, “libleralism” and so on was replaced with the European synonym “left”, “leftism”, etc. in order not to confuse the European readers of the MIWI Institute.
“How do the attitudes and beliefs of the most elite undergraduates reflect or influence future social and political trends in the country?”