_ Thilo Albers, postdoctoral researcher Humboldt University of Berlin; Charlotte Bartels, post-doctoral researcher German Institute for Economic Research (DIW); Moritz Schularick, University of Bonn. CEPR, VoxEU. 28. October 2022.*
German history provides unique insights into how country-specific shocks can shape long-run wealth dynamics. This analytical note presents the first comprehensive study of wealth and its distribution in Germany since the 19th century. The authors find the concentration of wealth in the hands of the German top 1 percent has fallen by almost half over the long run. The main contributors were the collapsing asset prices and the destruction and taxation of capital. The findings underscore the importance of common political and technological shocks and trends shaping wealth distribution in other advanced economies.
***
German history over the past 125 years has been turbulent. Marked by two world wars, revolutions and major regime changes, as well as hyperinflation and three currency reforms, expropriations and territorial divisions, it provides unique insights into the role of country-specific shocks in shaping long-run wealth dynamics. Long-run series for France 1914-2014 (Piketty et al. 2006, Garbinti et al. 2021), for Sweden 1873-2012 (Roine and Waldenström 2009, Lundberg and Waldenström 2018), for the UK 1895-2013 (Alvaredo et al. 2018), and the US 1913-2020 (Saez and Zucman 2016, 2020) show a secular decline in wealth concentration after the two world wars and a moderate increase since the 1980s. How does Germany fit into the picture?
In a new paper (Albers, Bartels and Schularick 2022), we contribute to the economic history of wealth and its distribution in Germany. We construct new long-run series for German marketable household wealth and its distribution since 1895. We combine tax and archival data, household surveys, national accounts, and rich lists to analyse the evolution of German wealth distribution over the long run. Wealth is defined as the value of assets net of debt owned by households. In line with international standards, we exclude consumer durables, hard-to-assess items like works of art, as well as non-tradable future claims on public and employer-based pension systems.
Our new series for aggregate wealth and its distribution improve on existing work and provide significant revisions to the official balance sheets. We draw on a wider range of sources and improve upon the aggregate household wealth series by Piketty and Zucman (2014) and previous work by Baron (1988) and Dell (2008). For instance, we correct the valuation of Germany’s large number of private limited companies and quasi-corporations, as well as the valuation of housing. Our corrected wealth-income ratio is about 120 percent of GDP higher than the official balance sheets imply. Germany is considerably richer than official statistics show. Our top 1 percent series is consistently estimated in market prices and shows substantially higher levels of wealth concentration than earlier work by Baron (1988, covering 1935-1980) and Dell (2008, covering 1894-1995).
The secular decline of wealth concentration at the top
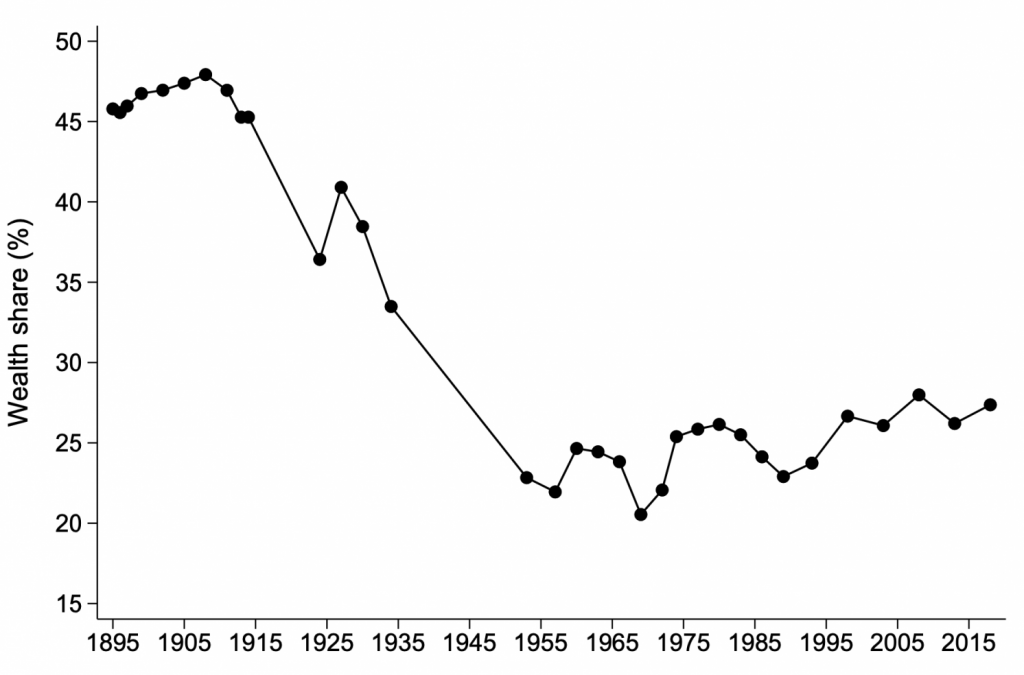
We find that over the long run, the concentration of wealth in the hands of the German top 1 percent has fallen by almost half, from close to 50 percent in 1895 to 27 percent today. Almost all of the decline in the top 1 percent wealth share occurred in less than 40 years, between WWI and the early years of the Federal Republic after WWII. In the post-war boom period, the wealth distribution remained, by and large, stable with housing wealth accumulation playing an important role outside the very top.
Figure 1. Top 1 percent wealth share in Germany, 1895-2018

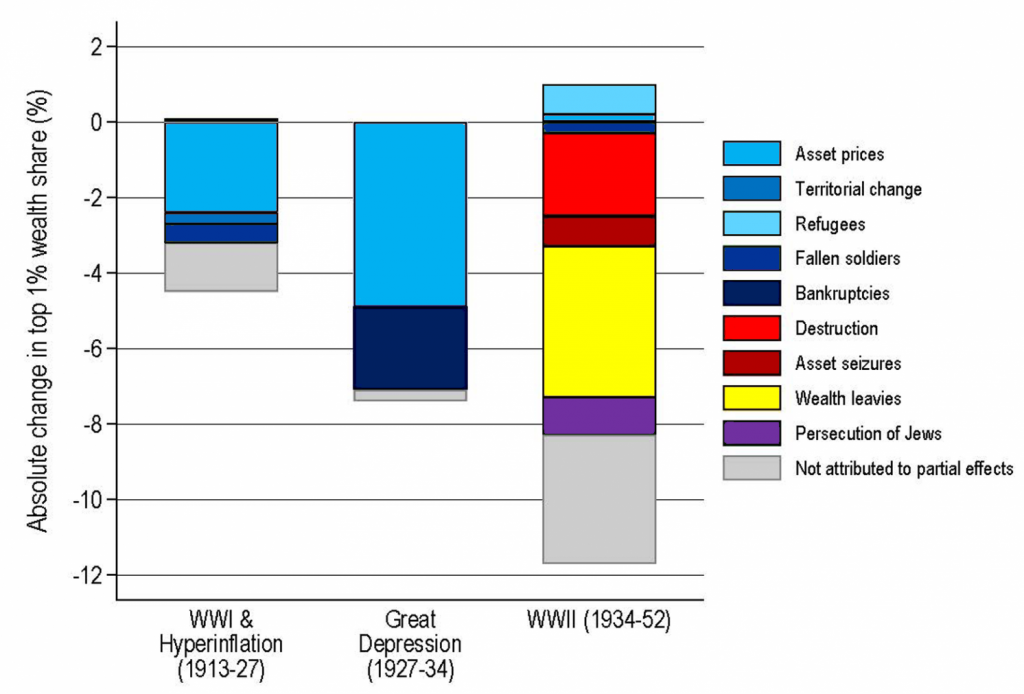
To identify the key forces behind the largest observed changes in the wealth distribution, we decompose the major historical shifts in the German wealth distribution. Figure 2 documents that collapsing asset prices played a central role in equalising wealth distribution during WWI, the hyperinflation, and the Great Depression. These events compressed the market value of business wealth holdings at the top while the capital stock remained largely intact. By contrast, the destruction and taxation of capital explain most of the decline in inequality in and after WWII. The “Lastenausgleich” taxed German households whose wealth had survived the war and those that had profited from the eradication of debts in the currency reform of 1948. Apart from a small allowance, the wealth levy constituted a quasi-flat 50 percent tax on the net wealth of households in 1948. Our estimates suggest that the wealth tax alone reduced the top 1 percent wealth share by about 3pp., while war destruction and the dismantling of plants accounted for another 3pp. of the drop in the top 1 percent wealth share during and after WWII. These findings mesh nicely with recent studies that underscore the importance of asset returns and portfolio structure for wealth inequality dynamics (Garbinti et al. 2018, Fagereng et al. 2019, 2020, Bach et al. 2020, Kuhn et al. 2020).
Figure 2. Explaining major shifts of the top 1 percent wealth share in Germany

The bottom 50 percent falling behind
Three processes shaped the evolution of wealth inequality in Germany since its unification in 1990. First, the income share of the bottom 50 percent had dropped from more than 30 percent in the 1960s to less than 25 percent in the 1980s. This limited the bottom group’s ability to keep up with the savings accumulation of the middle 40 percent (P50-90). The income share of the middle class remained stable, while that of the top decile continued to grow (Bartels 2019). Second, the homeownership rate barely grew and remained at ca. 40 percent. Third, the gap between capital returns and GDP per capita income growth, which had remained relatively small over the post-war decades, started to widen (Jordà et al. 2019). These developments meant that the bottom 50 percent increasingly lost out in relative terms while the middle and the top benefited from increasing capital returns and rising asset prices. As a result, we observe an increase in wealth inequality in Germany since the 1990s.
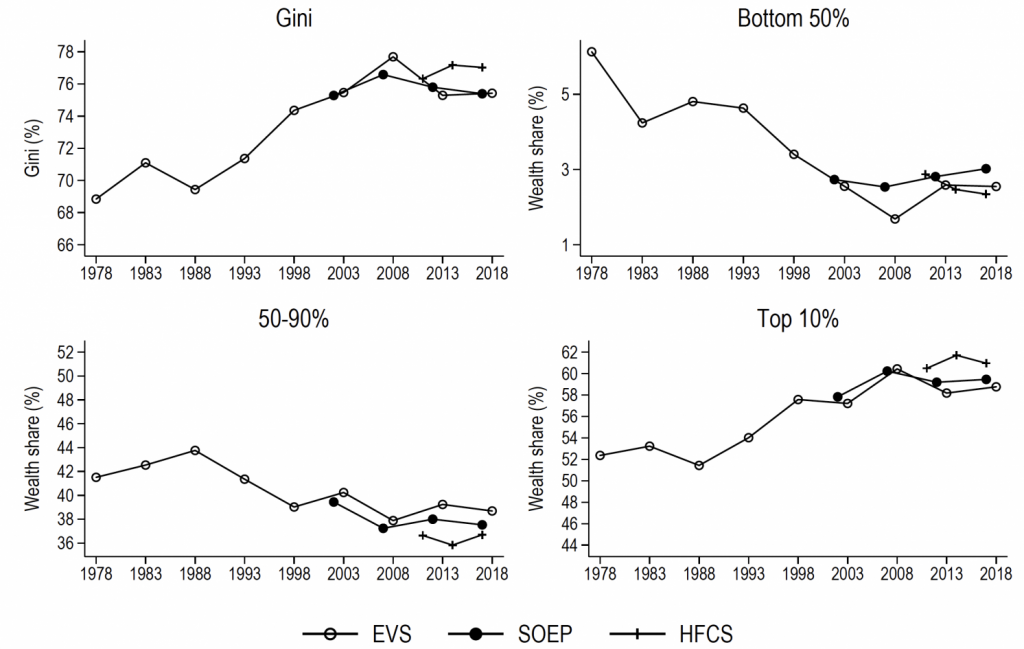
Figure 3 shows the Gini coefficient as well as the wealth share of the bottom 50 percent, the middle 40 percent, and the top 10 percent from 1993 to 2018. The Gini coefficient increased moderately from ca. 71 percent in 1993 to ca. 75 percent in 2018. During this period, the upper half of the wealth distribution effectively doubled its wealth. Asset valuations have played an important role. While top wealth holders made substantial capital gains from rising business equity, middle-class households witnessed large capital gains from rising house prices since 2010. At the same time, the real wealth of the average household in the bottom 50 percent stagnated. As a consequence, the bottom 50 percent share in total wealth nearly halved from nearly 5 percent in 1993 to 2.8 percent in 2018.
Figure 3. Wealth inequality in Germany, 1993-2018

Common shocks shape wealth distributions in advanced economies
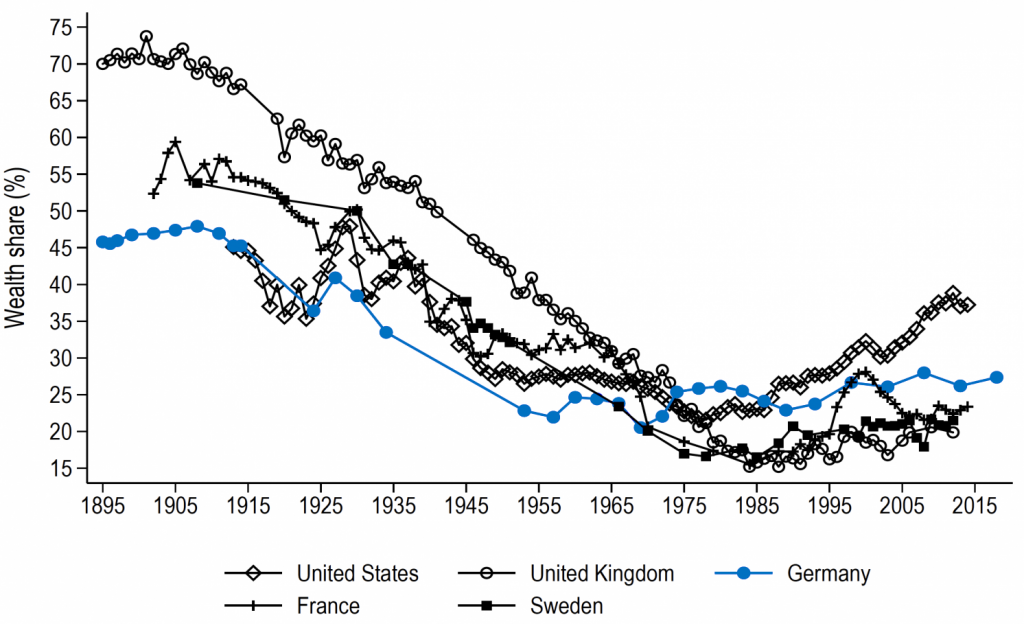
Despite its uniquely turbulent history, Germany’s trajectory looks strikingly similar to other countries in Europe and the US. Figure 4 shows the evolution of the top 1 percent wealth share in France, Germany, Sweden, the UK and the US from the turn of the century until today. These advanced economies also saw sharp reductions in top wealth shares around the mid of 20th century and a substantial reduction of top wealth shares relative to the levels around the year 1900. This finding underscores the importance of common political and technological shocks and trends shaping wealth distribution in advanced economies over the long run. Germany is a case in point, but other countries made similar experiences. For instance, the Great Depression was a global event that depressed business asset valuations in all economies for decades to come. Governments responded to the world wars in similar ways by raising taxes and increasing redistribution. In that sense, our study of the extreme case of Germany points to a greater theme of correlated shocks and policy responses across the major economies that have aligned cross-country wealth histories to a surprising degree over the past century.
Figure 4 . Top 1 percent wealth share in international comparison

Conclusion
By drawing on a wide range of data, this study provides the first comprehensive analysis of the evolution of wealth and its distribution in Germany from 1895 to 2018. A central insight is that in Germany, as in other countries, changes in the valuation of existing assets played a major role in changes in wealth distribution over extended periods. Yet, German history also offers important insights into how policies can affect wealth distribution. In particular, the substantial wealth tax associated with the ‘Lastenausgleich‘ after WWII played a large role in equalising the wealth distribution. Owing to this wealth tax, Germany became one of the most equal countries before her post-war economic miracle took off. Since unification, the concentration of wealth at the very top has risen only moderately. The main reason for the stability is that the middle class made substantial gains in real estate wealth, thus mitigating concentration at the very top. However, a substantial part of the population does not own assets, and, hence, did not profit from rising stock or house prices altogether.
References
Albers, T, C Bartels and M Schularick (2022), “Wealth and its Distribution in Germany, 1895-2018”, CEPR Discussion Paper No. 17269.
Alvaredo, A, A B Atkinson and S Morelli (2018), “Top wealth shares in the UK over more than a century”, Journal of Public Economics 162: 26–47.
Bach, L, L E Calvet and P Sodini (2020), “Rich pickings? Risk, return, and skill in household wealth”, American Economic Review 110(9): 2703–47.
Baron, D (1988), Die personelle Vermögensverteilung in der Bundesrepublik Deutschland und ihre Bestimmungsgründe, Peter Lang. Frankfurt.
Bartels, C (2019), “Top incomes in Germany, 1871-2014”, Journal of Economic History 79(3): 669–707.
Dell, F (2008), “L’Allemagne inégale: inégalités de revenus et de patrimoine en Allemagne, dynamique d’accumulation du capital et taxation de Bismarck à Schröder 1870-2005”, PhD thesis, Paris, EHESS.
Fagereng, A, M Blomhoff Holm, B Moll and G Natvik (2019), “Saving behavior across the wealth distribution: The importance of capital gains”, NBER Working Paper No. 26588.
Fagereng, A, L Guiso, D Malacrino and L Pistaferri (2020), “Heterogeneity and persistence in returns to wealth”, Econometrica 88(1): 115–170.
Garbinti, B, J Goupille-Lebret and T Piketty (2018), “Income inequality in France, 1900 – 2014: Evidence from Distributional National Accounts (DINA)”, Journal of Public Economics 162: 63–77.
Garbinti, B, J Goupille-Lebret and T Piketty (2021), “Accounting for wealth inequality dynamics: Methods, estimates and simulations for France”, Journal of the European Economic Association 19(1): 620–663.
Jordà, O, K Knoll, D Kuvshinov, M Schularick and A M Taylor (2019), “The rate of return on everything, 1870-2015”, The Quarterly Journal of Economics 134(3): 1225–1298.
Kuhn, M, M Schularick and U Steins (2020), “Income and wealth inequality in America, 1949–2016”, Journal of Political Economy 128(9): 3469–3519.
Lundberg, J and D Waldenström (2018), “Wealth Inequality in Sweden: What can we learn from capitalized income tax data?”, Review of Income and Wealth 64(3): 517–541.
Piketty, T, G Postel-Vinay and J Rosenthal (2006), “Wealth concentration in a developing economy: Paris and France, 1807-1994”, American Economic Review 96(1): 236–256.
Piketty, T and G Zucman (2014), “Capital is back: Wealth-income ratios in rich countries, 1700-2010”, Quarterly Journal of Economics 129(3): 1255–1310.
Roine, J and D Waldenström (2009), “Wealth concentration over the path of development: Sweden, 1873–2006”, The Scandinavian Journal of Economics 111(1): 151–187.
Saez, E and G Zucman (2016), “Wealth inequality in the United States since 1913: Evidence from capitalized income tax data”, Quarterly Journal of Economics 131(2): 519–578.
Saez, E and G Zucman (2020), “The rise of income and wealth inequality in America: Evidence from distributional macroeconomic accounts”, Journal of Economic Perspectives 34(4): 3–26.
* Republished from the original publication on VoxEU in accordance with their copyright rules.
