_ Yuri Kofner, junior economist, MIWI – Institute for Market Integration and Economic Policy. Munich, 12 January 2021.
One of the main causes of the Ukrainian crisis in 2014 was the contradictory views between various groups, both within Ukraine and abroad, regarding the country’s possible future geopolitical and geoeconomics trajectory towards either closer integration with Russia as part of the EurasEC customs union (from 01.01.2015 the Eurasian Economic Union, EAEU) or integration with Europe in the framework an Association Agreement and a Deep and Comprehensive Free Trade Agreement (DCFTA) with the European Union.
Effects of the Ukraine – EU DCFTA
So far, what have been the net economic effects for Ukraine of the Deep and Comprehensive Free Trade Agreement with the European Union?
According to World Bank Data, between 2014 and 2019 Ukraine’s GDP per capita measured in constant 2010 USD grew on average annually by 0.5 percent. In 2019 it was 2.1 percent higher (USD 3225) as compared to 2013 (USD 3160). This might lead to the conclusion that the Deep and Comprehensive Free Trade Agreement with the European Union was beneficial for the Ukrainian economy.
However, this rise in GDP per capita might be explained by demographics. Between 2014 and 2019 the country’s population shrank by 0.4 percent on average each year or by 1 mln people in total. In 2019 as compared to 2013 it was 2.4 percent (44.4. vs. 45.5 mln people).
In fact, Ukraine’s gross domestic product measured in constant 2010 USD shrank by 0.8 percent on average each year between 2014 and 2019. In 2019 it was almost 6 percent lower than in 2013, a year before the Ukrainian crisis and the signing of the EU DCFTA.
The dream of Euromaidan supporters that cutting all ties with Russia would reduce the power of the oligarchs did not come true either. On the contrary, between 2013 and 2018 social inequality increased: the country’s Gini index moved up from 24.6 to 26.1.
Between 2013 and 2018 the share of manufactures exports in Ukraine’s total goods exports fell from 57.4 to 47.2 percent. The share of high-technology exports went down from almost 7 to 5.6 percent.
The picture becomes even more striking if we compare the change of export structure sophistication between the EAEU and the EU (Chart 1). In 2013 the share of medium to high tech goods in Ukraine’s exports to the EurasEC customs union amounted to 71 percent, whereas they made up only half of the goods exports to the EU. Interestingly, in 2018 the share of medium to high-tech goods was not only higher in exports to the EAEU but their share also slightly decreased in exports to the EU: i.e. 65 and 49 percent, respectively. Moreover between 2013 and 2018 the share of basic resources in goods exports to the EU actually increased by 2 p.p. (Chart 9). This suggests that contrary to initial hopes, the reorientation to the European market away from Russia and the adoption of the terms of the EU DCFTA led to the simplification of the country‘s export structure.
To be fair it has to be said that this economic decline is not entirely due to the negative effects of the UKR-EU DCFTA and the trade war with Russia, but also due to the civil war in the Donbas region. A recent wiiw study estimates the minimum costs of reconstruction at USD 21.7 bln or 16 percent of the country’s GDP. The direct damage caused by violent actions is not the most significant cost driver in the long run. 42% of the restoration costs can be attributed to the disruption of business continuity and the degradation of state capacity that accumulated over years of inaction.
Chart 1. Sophistication of goods exports from Ukraine to the EAEU and EU (2013 and 2018, share of respective goods exports)
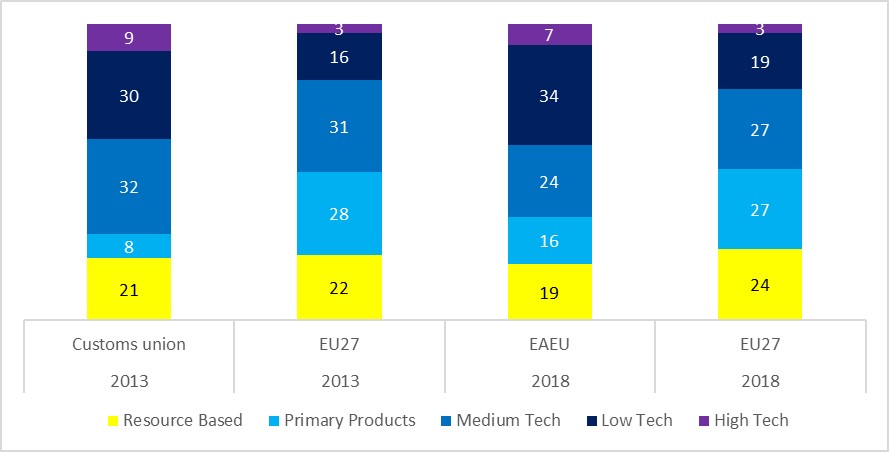
Source: WITS (UN Comtrade) and author’s visualization.
Alternative effects of Eurasian economic integration
How would the Ukrainian economy have developed if Kiev, instead of signing the EU DCFTA, had chosen to join the EurasEC customs union in 2010 and the Eurasian Economic Union in 2015? An indication to this question my by given using the synthetic control method, developed by (Abadie, Diamond, and Hainmueller, 2010).
The synthetic control method allows for effect estimation in settings where a single unit, e.g., a country, is exposed to an event or policy intervention. It provides a data-driven procedure to construct synthetic control units based on a convex combination of comparison units that approximates the characteristics of the unit that is exposed to the intervention. A combination of comparison units often provides a better comparison for the unit exposed to the intervention than any comparison unit alone. Thus, the synthetic control method combines elements from matching and difference-in-differences techniques.
For this model, the author stipulated the following conditionals: Ukraine was the treated country and the five EAEU member states were given as the comparison countries. The dependent variable was GDP per capita in constant USD dollars. The predictor variables were consumer price inflation, gross fixed investment in relation to GDP, the share of manufacturing and construction in GDP, the share of exports in relation to GDP. The treatment periods were 2010 and 2015. Accordingly, the predictor or common period was from 1992 to 2009 and 2014. The result or prediction period was from 2010 to 2019.
According to the simulation results, Ukraine’s economy could have faired much better, if it had joined the EurasEC customs union and the EAEU (Charts 2 and 3). In 2019, its GDP, measured in 2010 USD, could have amounted to USD 153.9 bln, which would have been 13.7 percent or USD 18.5 bln higher than Ukraine’s de-facto GDP in 2019 of USD 135.4 bln. Each Ukrainian citizen could have been 441 USD richer in GDP per capita terms: USD 3666 vs. USD 3225. On average Ukrainian GDP per capita could have been USD 400 each year from 2010 onwards.
Chart 2. Alternative economic development of Ukraine in the Eurasian CU/EAEU (1992-2019, in GDP per capita, constant 2010 USD)
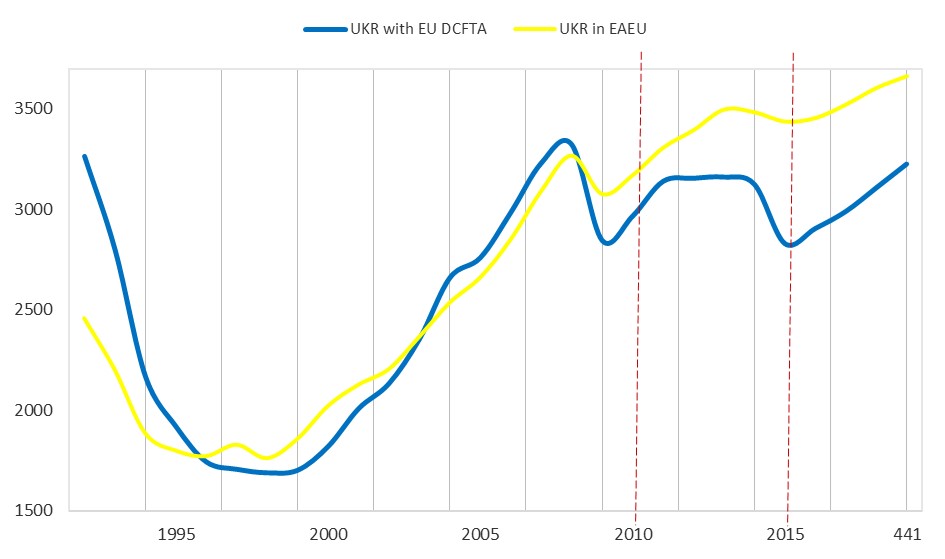
Source: World Bank Data and author’s estimations.
Chart 3. Welfare difference, if Ukraine had joined the Eurasian CU/EAEU (1992-2019, in GDP per capita, constant 2010 USD)
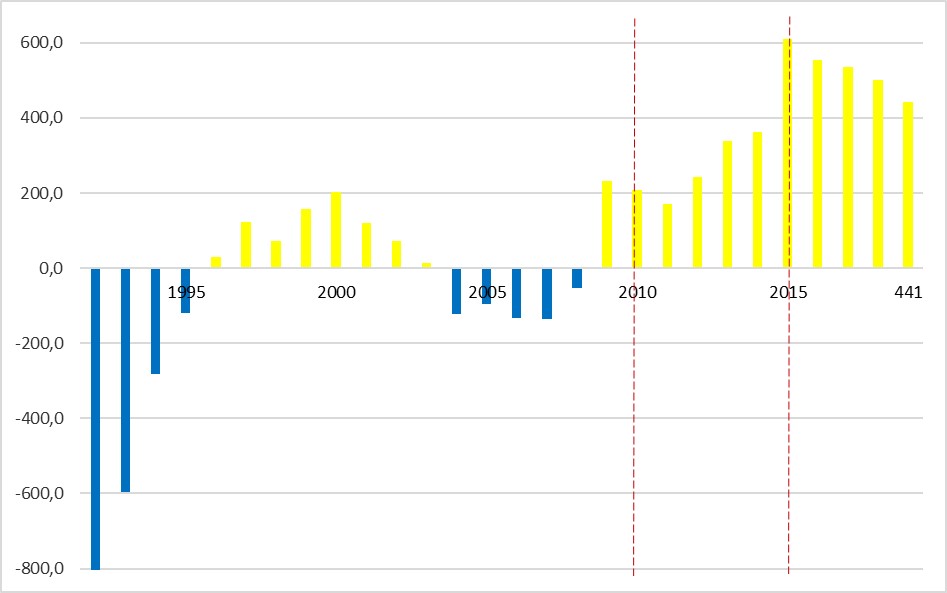
Source: World Bank Data and author’s estimations.
One comment