_ Yuri Kofner, economist, MIWI Institute for Market Integration and Economic Policy. Munich, January 2021.
Introduction
One of the main causes of the Ukrainian crisis in 2014 were the contradictory views between various groups, both within Ukraine and abroad, regarding the country’s possible membership in the Eurasian Economic Union (EAEU).
Half a dozen years have passed since then. Although the frozen conflict persists (politically, economically and ideologically), tensions between Ukraine, Europe and Russia have somewhat abated since then, especially after Vladimir Zelensky’s election as Ukrainian president.
Thus, maybe the time has come to think about the possibilities of starting (resuming) trade and economic cooperation between Ukraine and the EAEU, but in a new format and quality.
Subsequently, this research report aims to assess the feasibility of a potential strengthening trade and economic relations between Ukraine and the Eurasian Economic Union.
In this regard, in the first chapter, the author will consider the evolution in 2011/12 – 2018/19 of trade and economic relations between Ukraine and the EAEU, as well as Kiev’s attitude towards the prospect of Eurasian integration. The second chapter analyzes the feasibility of a hypothetical return of Ukraine towards deeper trade and economic relations with the Eurasian Economic Union. The third part presents the results of in-house and out-house research on the potential welfare effects of such a scenario. Finally, the author summarizes the main conclusions of the report and gives the appropriate policy recommendations.
Ukraine – EAEU relations
Competition of integration projects
Before the Ukrainian crisis of 2014, Kiev was intent on strengthening trade and economic cooperation with the Eurasian Economic Union (EAEU), – then the Eurasian Economic Community’s (EurAsEC) customs union (2010-2012) and single economic space (2013-2014).
Map 1. EU – EAEU shared neighborhood (January 2020)
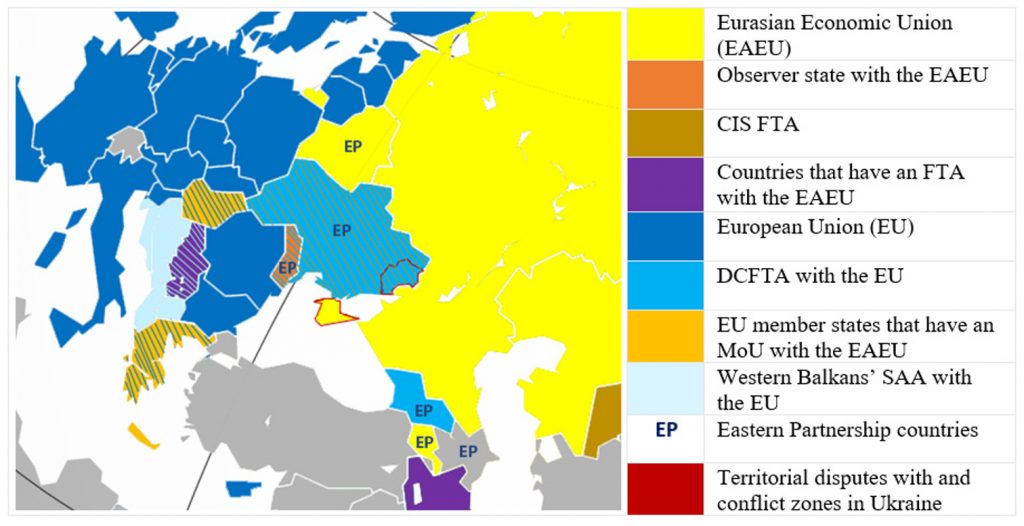
Source: Illustration by the author.
Indicating this intent is the fact that Ukraine was an observer state with EurAsEC from 2002 until 2014. In 2003 Leonid Kuchma, then president of Ukraine, together with his vis-à-vis from Belarus, Kazakhstan and Russia signed the “Agreement of Intent to Form a Single Economic Space”. At that time Kiev was interested in integration within the framework of a single economic space to ensure the unhindered movement of factors of production, considering this a potentially useful mechanism to reduce barriers for Ukrainian goods, services, labor and capital on the Eurasian market. Unfortunately, due to the pro-Western “Orange revolution” of 2005, this initiative did not receive further development. Thus, the three remaining countries founded the EurAsEC customs union in 2011 without Ukraine.
In August 2012 official Kiev, represented by then Ukrainian Minister of Economic Development and Trade Petro Poroshenko, signed an MoU with the Eurasian Economic Commission, which led to the creation of a “Dialogue on trade issues” led by the trade ministers of the four countries and held twice a year “to increase the transparency and predictability of existing administrative and regulatory systems”, as well as to “find mutually acceptable resolutions of problematic issues”. And in September 2012, Ukraine’s participation in the free trade are of the Commonwealth of Independent States (CIS) entered into force.
According to Ukrainian media reports of that time, it was planned that in April 2013 the presidents of Ukraine, Belarus, Kazakhstan and Russia would discuss the issue of Ukraine joining the provisions of the EurAsEC single economic space and customs union. However, in the country there were different views on the right foreign economic (political) priority – European or Eurasian, and, accordingly, on the ideal integration depth with the Eurasian project. Allegedly, Moscow offered Ukraine to join the EurAsEC single economic space and customs union in exchange for loans and lower prices on natural gas purchased from the Russian Federation (Box 1). On the other hand, Kiev, which then already planned to sign the “Association Agreement” and “Deep and Comprehensive Free Trade Area Agreement” with the European Union, promoted its “3 + 1” formula, according to which Ukraine and the four member states of the EurAsEC single economic space would stipulate areas for sectorial cooperation.
|
Box 1. Ukraine’s choice and Eastern concerns The Western press holds the opinion that the Kremlin allegedly put official Kiev before a choice between the EU DCFTA or accession to the EurAsEC single economic space and customs union, and that the Moscow allegedly put pressure on Ukrainian President Viktor Yanukovych in favor of the latter. However, this is not so. Both Russian President Vladimir Putin and then chairman of the Eurasian Economic Commission Victor Khristenko have always stated that the foreign political and economic choice is the national sovereign prerogative of Ukraine and of the Ukrainian peoples. By the way, in 2014-2015, “Ukrainian Choice” – a prominent public organization led by Viktor Medvechuk and the (now banned) Communist Party of Ukraine repeatedly called for a nationwide referendum on this issue. At the same time, the Russian and Belarusian sides had concerns that the mutual opening of the EU-Ukraine DCFTA would create the possibility of massive re-selling of European goods to the Eurasian market under the CIS FTA, as well as create new barriers for Eurasian exporters on the Ukrainian market, primarily in terms of higher European product conformity requirements, sanitary and phytosanitary measures, as well as customs procedures. The experience of Serbia shows that one country can simultaneously be in free trade zones with two different economic blocks – the EU and the EAEU. However, the difference lies in the fact that Ukraine directly borders with the Russian Federation and the Republic of Belarus, has a long border with them (Map 1), was (then) a much more important market (in 2013 Serbia accounted for 0.2 percent of extra-EAEU exports, while Ukraine for 5.1 percent), and had a close industrial and technological corporation with them since Soviet times. The fact that fears about re-selling of European goods were justified shows the experience of reexport through Belarus, which appeared due to the Russian ban on food imports from 2014. The estimated total cost of embargoed food reexported to Russia through Belarus from August 2014 to the end of 2016 was USD 2.7 bln. Since November 2013, 23 trilateral talks between the EU, Ukraine and Russia were held to discuss the potential concerns on the EU-Ukraine DCFTA. These talks broke down in December 2015 after which the European Commission stated that the demands of the Russian side were either unfounded or not here prerogative as a third party to the agreement. |
After the coup d’état in Kiev in February 2014 and the start of the Ukrainian crisis, which solidified the country’s foreign political and economic Westward-orientation, as well as the entry into force of Ukraine’s DCFTA with the EU in 2016, at first glance it seems to be pointless to talk about any possible further Eurasian integration of Ukraine.
Public opinion
Firstly, this seems to be confirmed by public opinion polls. While in 2012 almost 60 percent of Ukrainians supported deeper trade and economic cooperation with the EAEU (then the EurAsEC customs union), or even joining it, only 13 percent would do so in 2019.
However, according to research from 2019 by the Ukrainian Ilko Kucheriv Democratic Initiatives Foundation, in the country’s southern and eastern regions 24 percent to 27 percent of respondents preferred orientation towards the Eurasian Economic Union. Among the political forces, the opposition “Platform for Life” party stands out, with a clear majority of 60 percent of voters saying that Ukraine should join the EAEU. In the parliamentary elections in July 2019, it received over 13 percent of the votes and became the second largest party after Vladimir Zelensky’s “Peoples’ Servant” party (43.2 percent). Moreover, a study conducted in 2018 by the Analytical Center of the Russian Government found out that almost 40 percent of Ukrainian citizens and over half of the country’s business community would welcome deeper trade and economic cooperation with the EAEU (Chart 1, Table 1).
Of course, this would need the approval of both sides, in particular that of the Russian population. Here we see, that although Russian positive attitudes towards Ukraine dropped from 70.8 percent in 2013 to 28.3 percent in 2015, they gradually improved again reaching 42.3 percent in 2019 (Chart 2, Tables 1 and 2).
Chart 1. Popular support in Ukraine for joining the EAEU (2013-2019, affirmative answer in percent of total)
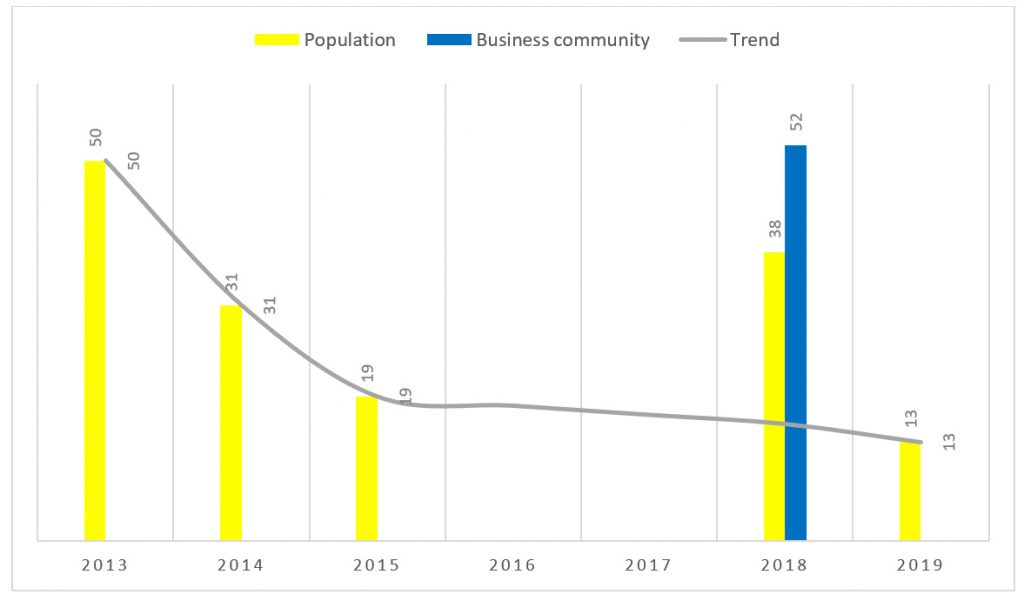
Source: aEDB Integration Barometer (2013-2015). bAnalytical Center of the Government of Russia (2018, deepening of trade and economic cooperation). cIlko Kucheriv Democratic Initiatives Foundation (2019).
Chart 2. Positive attitudes of Ukrainians towards joining the EAEU and of Russians towards Ukraine (2013-2019, affirmative answer in percent of total)
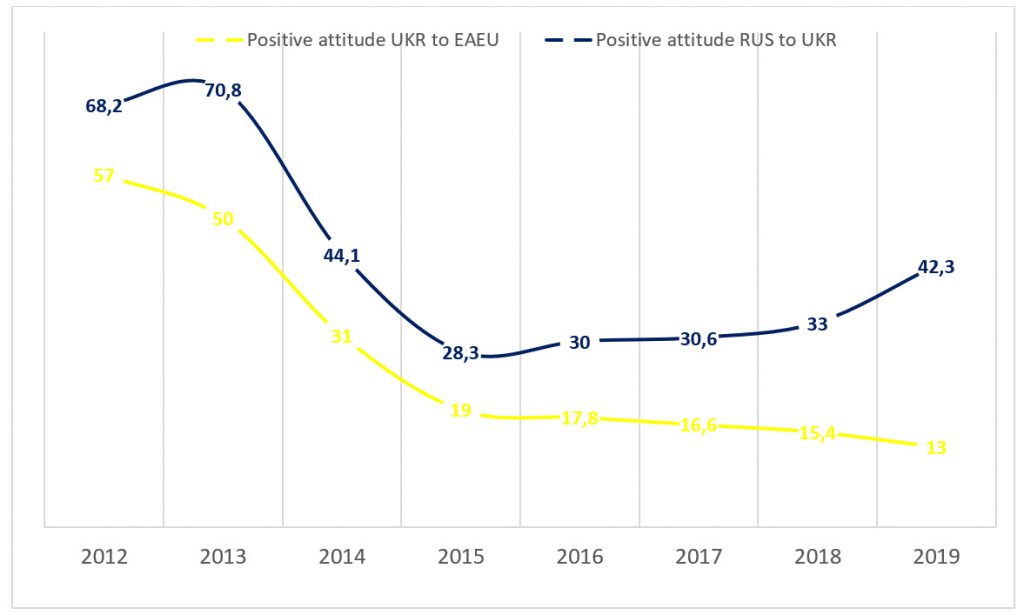
Source: Chart 1 and polls from the Yuri Levada Centre.
Ukraine – EAEU trade relations
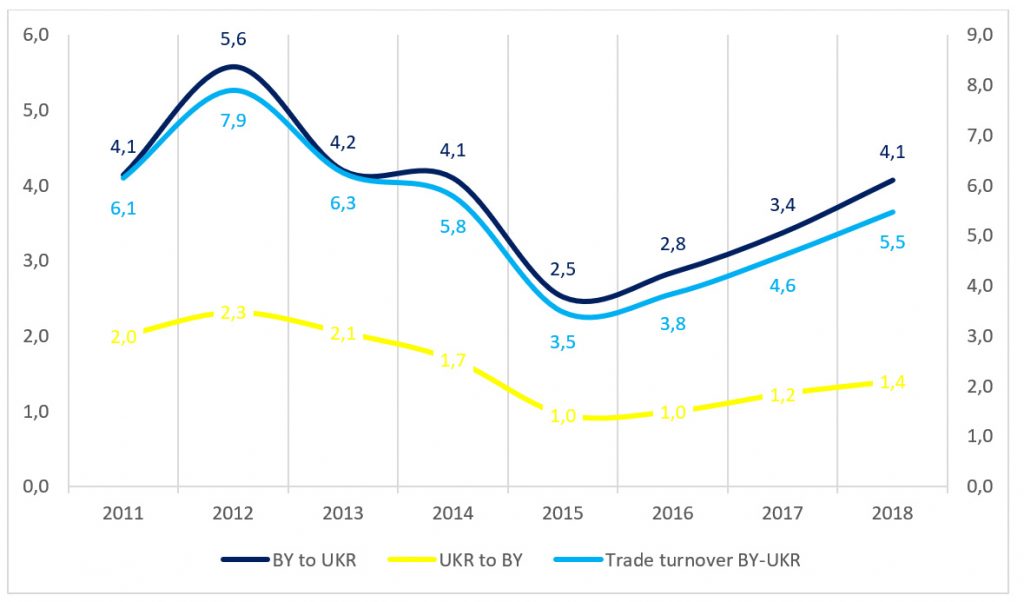
Secondly, merchandise trade flows between Ukraine and the EAEU decreased: the total trade turnover measured in current prices amounted to USD 61.2 bln in 2011, and only USD 15.6 bln in 2016. This is a reduction of almost 3/4. However, two peculiarities can be observed here. Firstly, trade in goods began to decline even before the Ukrainian crisis – by almost 20 percent between 2011 and 2013. Secondly, trade between Ukraine and the EAEU began to grow again after 2016 – by almost 30 percent, which, however, is still almost 3 times less than the 2011 level. For the entire study period Ukraine had a trade deficit with the Eurasian Economic Union of about USD 8.5 bln on average (Chart 3, Table 3).
Chart 3. EAEU – Ukraine trade (in current USD bln, 2011-2018)
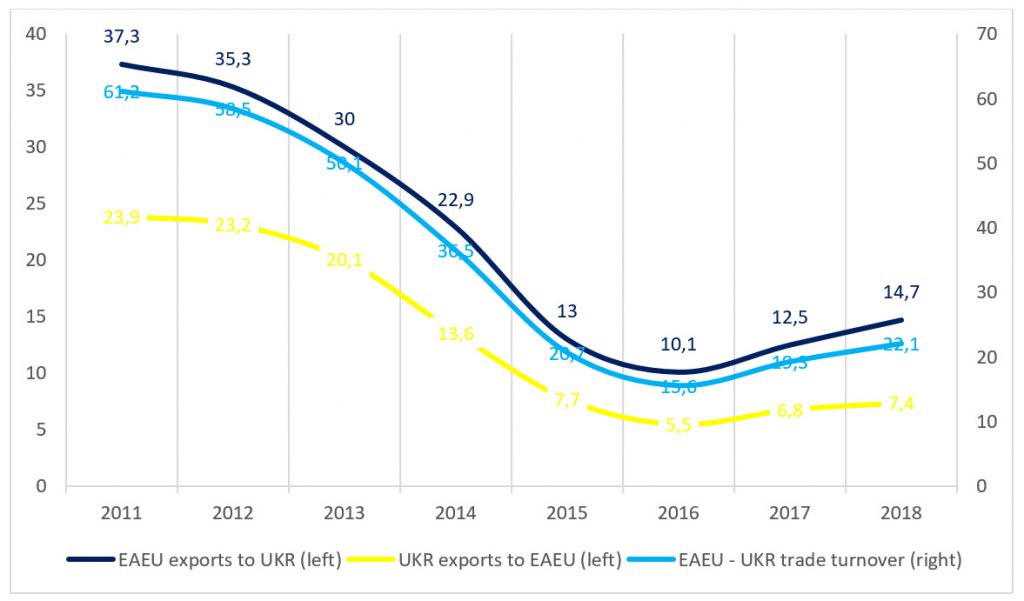
Source: EEC Statistics Department.
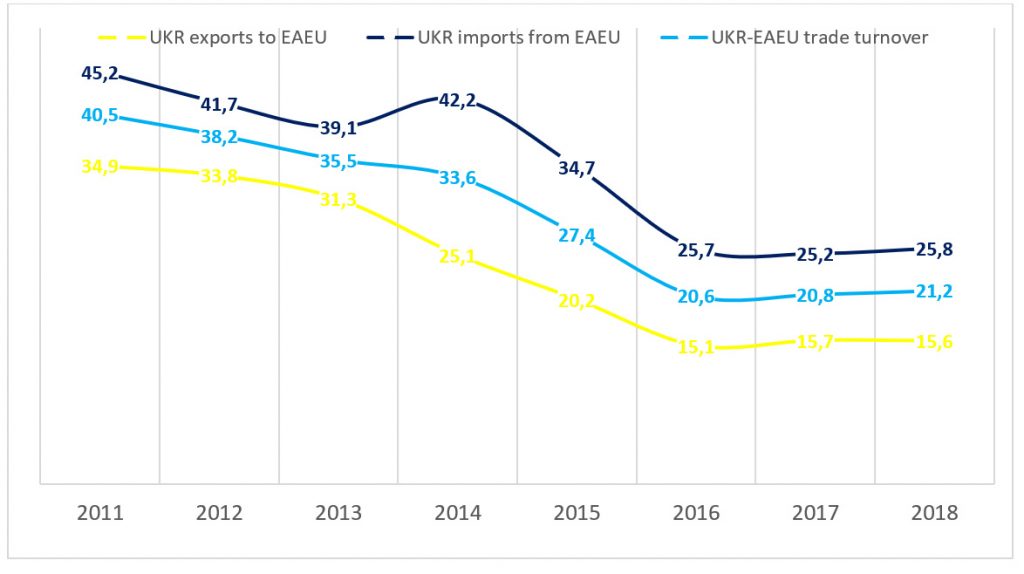
Using data from the ITC Trade Map, the EAEU’s share in Ukraine’s geographic trade structure decreased by almost 20 p.p. from over 40 percent in 2011 to 21.2 percent in 2018. Here again we see that the decline started even before the Ukrainian crisis and UKR-EU DCFTA, and that the EAEU’s share in Ukraine’s foreign trade stabilized between 2016 and 2018 at just about 21 percent. During the whole study period the Eurasian Economic Union was more important as a supplier of goods to Ukraine, rather than a market for Ukrainian exports with a difference of about 10 p.p. on average (Chart 4, Table 3).
Chart 4. EAEU’s share in total Ukrainian merchandise export, import and trade turnover ( percent share of total, 2011-2018)
Source: EEC Statistics Department, ITC Trade Map and author’s calculations.
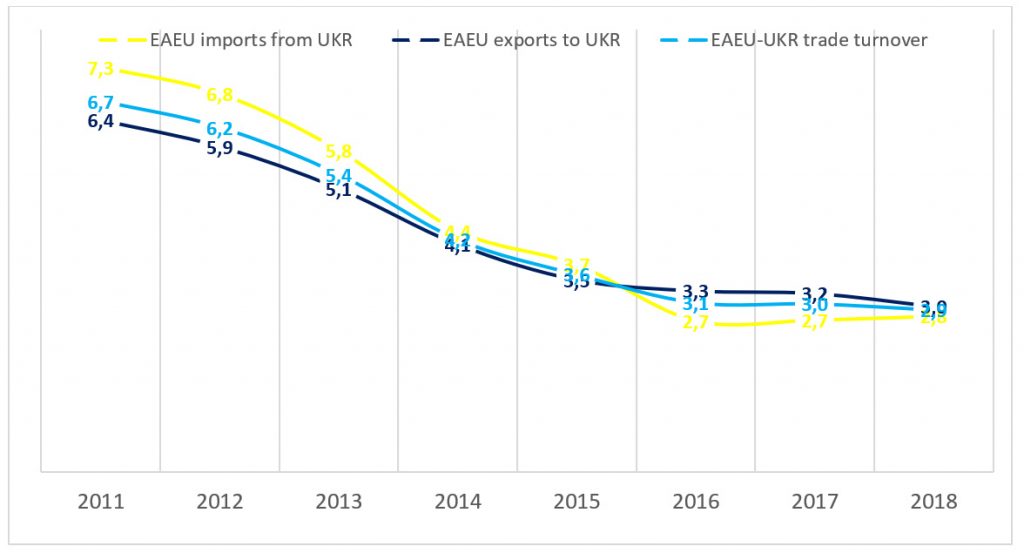
Ukraine’s share in the EAEU’s trade geography decreased from almost 7 percent in 2011 to almost 3 percent in 2018. Here, similarly, the decline started before the country’s turn to the West and its conflict with the Russian Federation. Potentially due to the mutual trade war between Russia and Ukraine, which began in earnest in 2014 (Box 2), exports from the EAEU to Ukraine became slightly more important than imports from it to the Union (Chart 5, Table 3).
Despite the shrinking trade flows, the EAEU remains an almost 7 times more important trade partner for Ukraine then vise-versa.
Chart 5. Ukraine’s share in total EAEU merchandise export, import and trade turnover ( percent share of total, 2011-2018)
Source: EEC Statistics Department and author’s calculations.
|
Box 2. Russia-Ukraine trade war chronology Ukrainian economic restrictions and sanctions against Russia March 2014 – Ukraine barred all exports of weaponry and military equipment to Russia. Jane’s Information Group believed (on 31 March 2014) that while supply may be slowed by the Ukrainian embargo, it was unlikely to do any real damage to Russia’s military.[217] August 2014 – Ukraine refused to cooperate with Russia in the construction of the third and fourth blocks of the Khmelnitsky nuclear power station October 2014 – January 2015 – Ukraine joined the EU sanctions against the companies “Chernomorneftegaz”, “Feodosiya” and other state enterprises confiscated by Russia after the takeover of Crimea, against the 6 largest Russian banks, the 3 largest Russian energy companies, against 12 Russian military-industrial complex concerns, and “Dobrolet Airlines”. Ukraine also joined the G7 sanctions on trade and investment against the Crimea and Sevastopol; the embargo on the export of weapons and similar materials to Russia; the ban on the export of dual-use goods and technologies for military use to Russia or to Russian end military users; the ban on the supply to Russia of high-tech equipment for oil production in the Arctic, offshore and shale oil extraction. November 2014 – Ukraine banned lending and deposit operations in Russian rubles, as well as investments in the Crimea. February 2015 – Ukraine imposed sanctions against 160 Russian enterprises. September 2015 – Ukraine introduced further sanctions against more than 400 individuals and 90 legal entities. October 2015 – Air traffic between Russia and Ukraine was completely discontinued. At present, only “Ukrzaliznitsy” (Ukrainian Railways) trains run between the two countries. “RZHD” (Russian Railways) stopped trains to Ukraine, with the exception of the Moscow-Chisinau transit train that passes through Kiev. November 2015 – Ukraine stopped purchasing Russian gas directly, replacing it with reverse Russian gas from Europe. Consequently, according to “Gasprom”, the country overpaid more than 10 percent for gas from Europe compared to Russian gas. Kiev also stopped importing electricity from Russia. Late January 2016 – Kiev commenced its ban on food imports from Russia. By April 2019 it included dairy and alcohol products, chocolate, tea, coffee, baby food, chemical products for agriculture, as well as personal hygiene products. October 2016 – Kiev banned Russian payment systems in Ukraine. April-May 2019 – Ukraine banned the import from Russia of glass containers, formalin, urea-formaldehyde concentrate, conductors for electric currents with a voltage of more than a thousand volts, electrical equipment for railway infrastructure, springs for freight cars, cement, clinker and plywood and imposed an additional special duty on all Russian goods, with the exception of coal, coke, gasoline, liquefied gas and pharmaceutical production. September-December 2019 – Ukraine allowed the supply of electricity under bilateral agreements from Russia and Belarus, after which “Naftogaz” began purchasing from “Belenergo”. In October, electricity supplies from the Russian Federation were resumed, but in December a ban was introduced on the import of electricity from Russia under bilateral agreements. It is worth noting that Ukraine never left the CIS FTA. Russian economic restrictions and sanctions against Ukraine Early January 2016 – Following the entry into force of the Ukraine-EU DCFTA Agreement, Moscow included Ukraine in its ban on food imports, which it imposed in August 2015 as a retaliatory measure against a number of Western countries (the United States, the EU, Canada, Australia, Norway and various Balkan states) that imposed sanctions against the Russian Federation. More importantly, Russia made the unilateral decision to suspend its obligations under the CIS FTA and to apply the “most favored nation” (MFN) treatment towards Ukraine. Furthermore, Moscow banned the transit of Ukrainian goods to Kazakhstan and Kyrgyzstan through the territory of the Russian Federation, March 2017 – In response to the ban of Russian payment systems in Ukraine, Russia prohibited money transfers to Ukraine through foreign payment systems. November-December 2018 – The Russian Federation imposed sanctions against 65 Ukrainian legal entities, including against “Ukroboronprom”. Late April 2019 – In response to the sanctions imposed by Ukraine earlier that month, Moscow imposed a ban on the export of oil and oil products to Ukraine, as well as a ban on imports from Ukraine of bulldozers, light industry and metal processing goods totaling USD 250 bln. At the same time, gasoline and diesel fuel can be exported to Ukraine only with the special permission of the Ministry of Economic Development of the Russian Federation. Similar restrictions apply to propane, butane and “other liquefied petroleum gases”, as well as coal and coke. At the same time, though having won the relevant WTO case, Moscow decided to allow transit through its territory to and from Kazakhstan and Kyrgyzstan of a list of priority industrial goods from and to Ukraine. However, Russia continues quoting Kazakh and Kyrgyz coal exports to Ukraine. On the whole, it can be said that Russian sanctions and restrictions against Ukraine were most often a retaliatory measure against prior Ukrainian restrictions, were generally adopted less often and were of a lesser magnitude. |
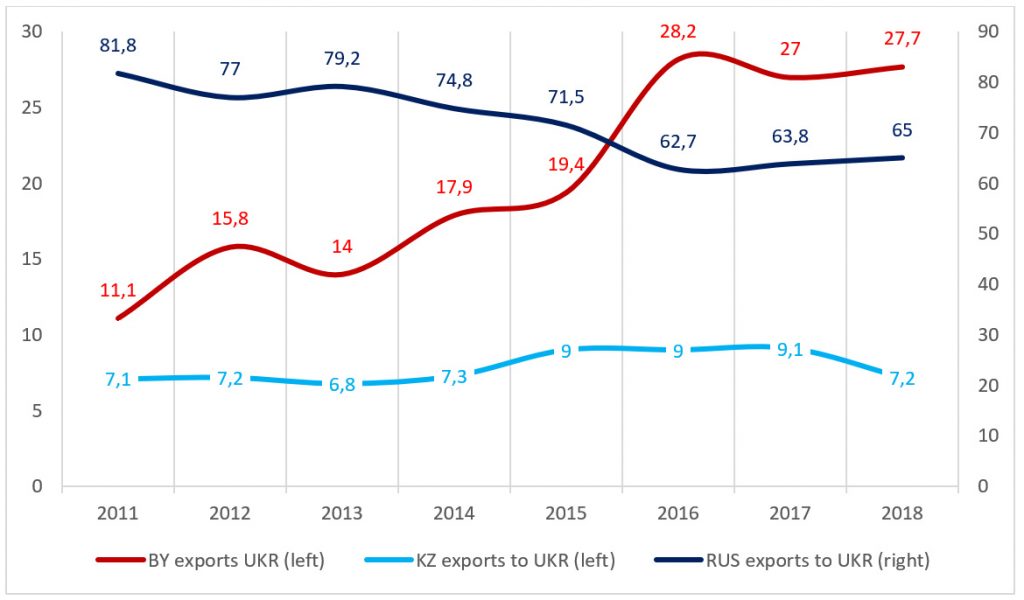
At first glance, it seems that Belarus has benefited from the Russo-Ukrainian trade war. From 2013 to 2016-2018, its share in the structure of EAEU exports to Ukraine increased from 14 percent to approx. 28 percent, i.e. by 15 p.p. Simultaneously, Russia’s share decreased from almost 80 percent to 65 percent during the same period (Chart 6, Table 4). The reasons for this could be: 1. that Belarusian enterprises took advantage of the niche that appeared due to the departure of their Russian colleagues from the Ukrainian market. 2. Perhaps they used the overlapping CIS FTA and Ukraine-EU DCFTA to reexport their goods to the European market. 3. And potentially, companies from other EAEU member states, including Russian enterprises, used Belarus as a transit country for the release of their goods in Ukraine.
Chart 6. BY-KZ-RUS exports to Ukraine (country composition in percent of total EAEU, 2011-2018)
Source: EEC Statistics Department and author’s calculations.
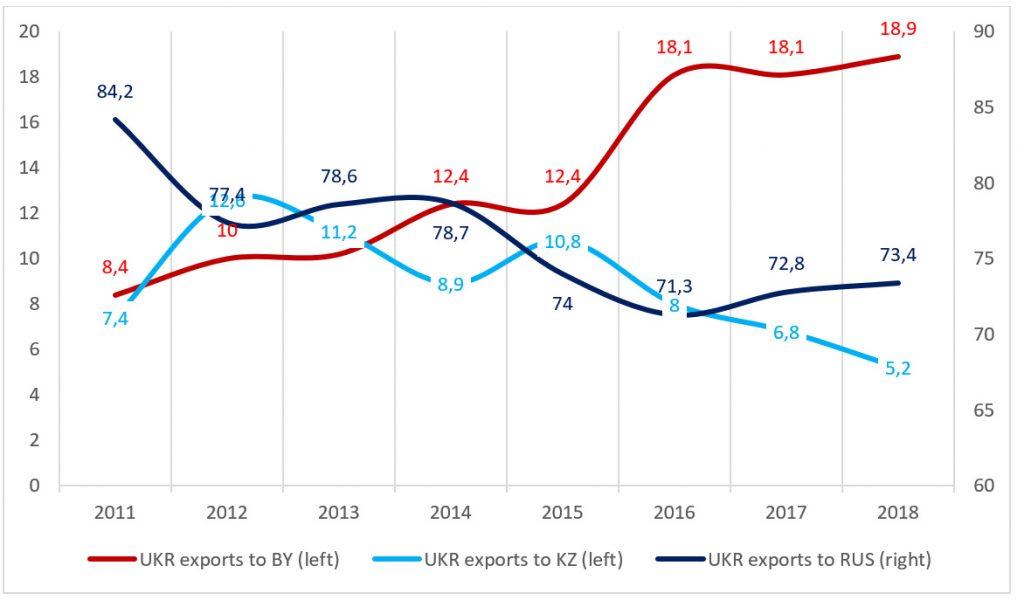
The same can be seen from the other side. Ukrainian exports to the EAEU through and to Belarus increased from 10.2 percent in 2013 to almost 19 percent in 2018. Over the same period, the share of Russia in Ukraine’s export structure to the Eurasian Economic Union decreased from almost 79 percent to 73.4 percent, and the share of Kazakhstan – from 11.2 percent to 5.2 percent (Chart 7, Table 4).
Chart 7. BY-KZ-RUS imports from Ukraine (country composition share percent of total EAEU, 2011-2018)
Source: EEC Statistics Department and author’s calculations.
However, if one looks at trade flows between Belarus and Ukraine in absolute terms, i.e. in current USD, it seems that Minsk and Kiev not only failed to increase mutual trade, but that it is even lower than the ante quo level: from USD 6.1 bln in 2011 to USD 5.5 bln in 2018. By the end of the period Belarusian exports reached the same level of USD 4.1 bln, while Ukrainian exports fell by USD 0.6 bln (Chart 8, Table 4).
Chart 8. Belarus – Ukraine trade (in USD current bln, 2011-2018)
Source: EEC Statistics Department and author’s calculations.
Feasibility of Ukraine – EAEU trade and economic cooperation
As already mentioned, in the current extremely tense relations between Kiev and Moscow, when the former decisively took the path towards European integration and officially declared Russia an “aggressor country”, it would seem that it makes no sense to analyze the feasibility of any potentially (deeper) trade and economic cooperation between Ukraine and the Eurasian Economic Union.
However, firstly, the author has already pointed out that despite the reduced trade flows, sanctions and restrictions between Ukraine and the EAEU, since 2016 we have seen a small, but gradual increase in mutual trade. Secondly, social polls show that despite the conflict, there is still a small part of Ukrainian citizens who would prefer Ukraine’s membership in the EAEU. Kiev’s political leadership ought not completely ignore the interests of this population and voter group. Thirdly, the EAEU is not only Russia, but an economic, democratic and supranational integration organization (Box 3). Finally, unlike historians, economists are sometimes allowed to ask the “what if” question.
| Box 3. The Eurasian Economic Union (EAEU)
The EAEU is a trade and economic bloc that aims to create a common internal market based on the free movement of goods and services, labour, capital, and enterprise. Founded on 1 January 2015, it comprises five former Soviet states: Armenia, Belarus, Kazakhstan, Kyrgyzstan, and Russia. In 2018 its GDP by purchasing power parity was USD 4.7 trln with a population of 182 mln. Modern Eurasian integration is strongly influenced by and modeled after the European institutions and experience. In terms of supranational powers, the EAEU is the world’s second most integrated bloc after the EU. The governing bodies of the Eurasian Union are democratic. All decisions between member states must be made by consensus and each member state has only one vote, regardless of economic power or population. Bodies of the EAEU and the EU in comparison
In contrast to the EU, the EAEU integration agenda and the powers of the EEC are restricted to economic issues. The Eurasian Economic Union does not pursue a policy of values and does not interfere in the domestic political systems of its member states. Core powers of the EAEU
Main successes and prospects of the EAEU
|
Therefore, in the second part of this report, the author would like to consider the trade and economic compatibility between Ukraine and the EAEU, the feasibility of Eurasian integration for Ukraine, as well as possible welfare and industrial effects for the country.
Naturally, in reality this would become possible only after: 1. finding a mutually acceptable solution to the political conflict between Ukraine and Russia; 2. lifting all mutual sanctions and restrictions; 3. the corresponding will of the Ukrainian peoples (and of course the peoples of the EAEU member states as well). All of this seems extremely unlikely in the current situation. And even after that, there would remain the Ukraine-EU DCFTA, which narrows the possibilities for enhanced trade and economic cooperation of the country with the Eurasian Economic Union, and completely excludes its membership in it.
Trade complementarity
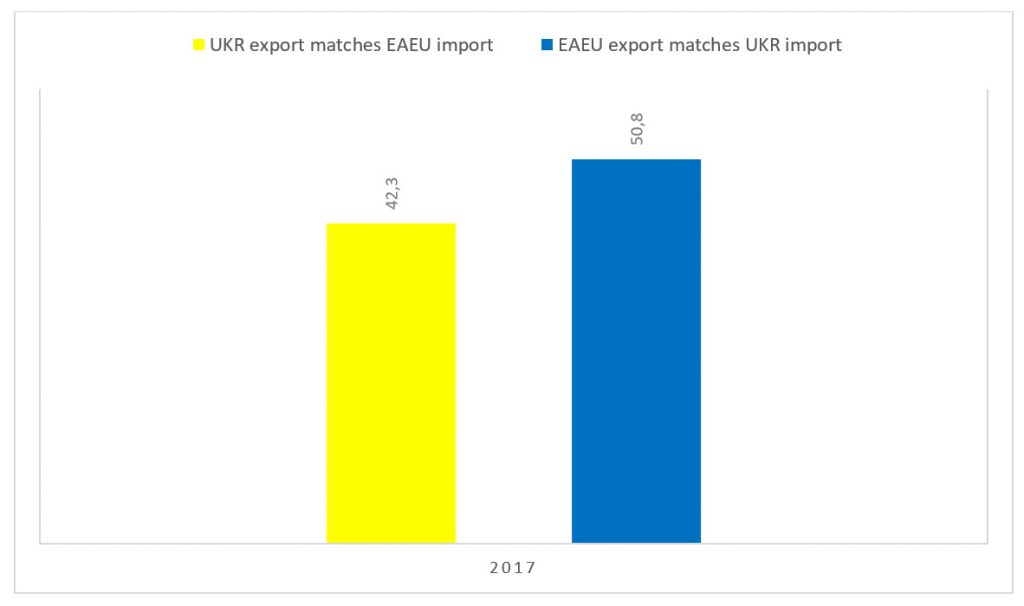
Using a simple HS data set on product trade aggregated at the 2-digit depth for 2017, we see a relatively high trade complementarity between Ukraine and the EAEU. Ukrainian gross foreign exports match total extra-EAEU imports by 42.3 percent. For comparison, this index is lower than for Moldova (almost 55 percent), but higher than for Tajikistan (over 25 percent) and Uzbekistan (36 percent). Eurasian exports to the world match Ukrainian imports from abroad by 50.8 percent. This is higher than for all other non-EAEU CIS countries (Charts 9, 10 and 11, Tables 5 and 6). The higher the trade complementarity (measured cij = 100 [1 – ∑mk=1 │mik – xjk│/ 2]) between two parties, the more sensible trade liberalization and economic integration between them becomes.
Chart 9. Trade complementarity index for EAEU trade with Ukraine (2017, in percent)
Source: EEC Statistics Department, OEC database and author’s calculations.
Chart 10. Commodity structure of external trade of the EAEU (export) and Ukraine (import) with third parties (2017, HS2, in percent)
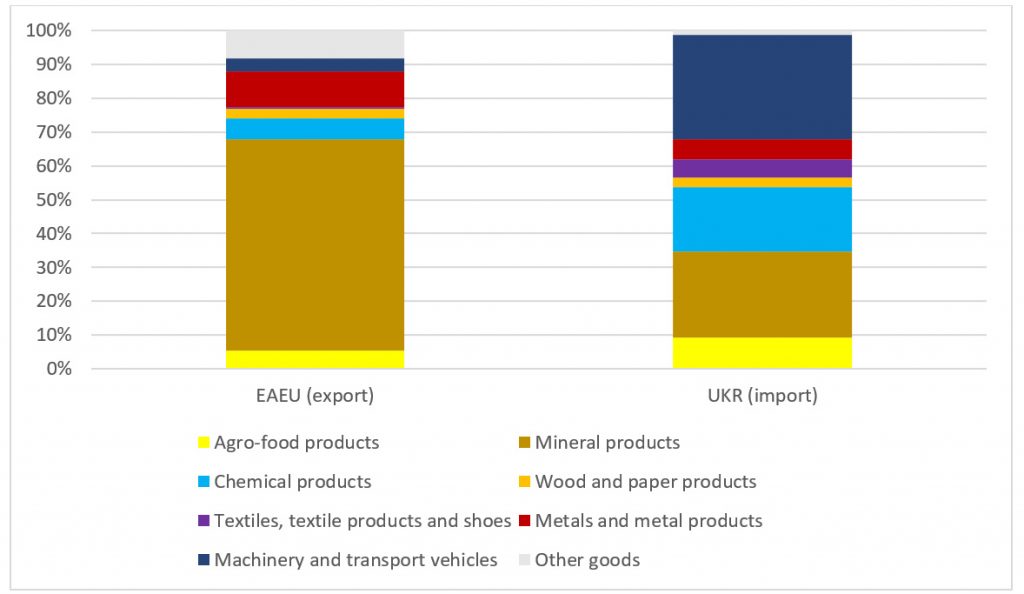
Source: EEC Statistics Department, OEC database and author’s calculations.
Chart 11. Commodity structure of external trade of the EAEU (import) and Ukraine (export) with third parties (2017, HS2, in percent)
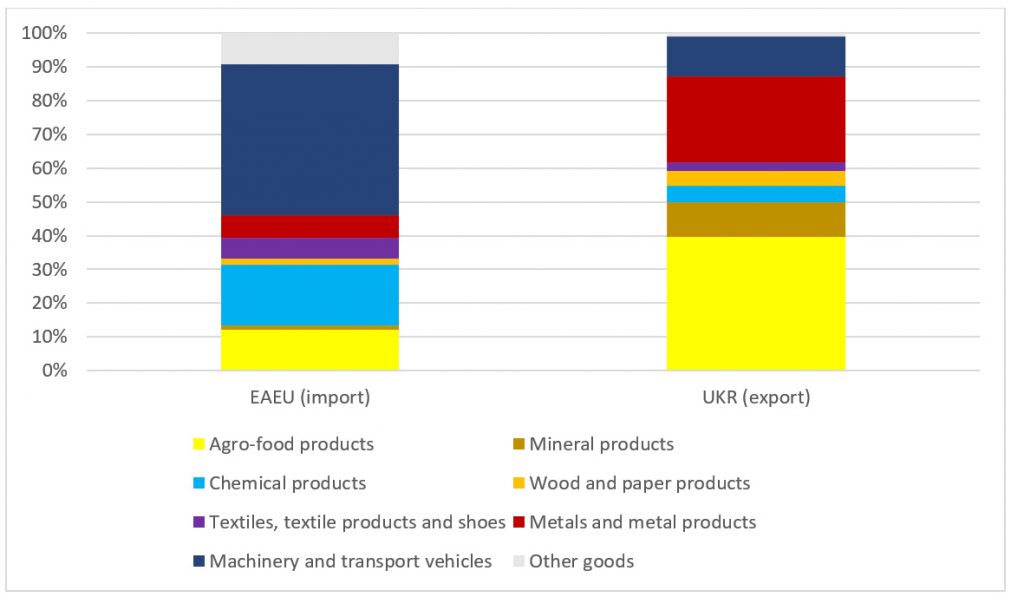
Source: EEC Statistics Department, OEC database and author’s calculations.
Level of processing
For all countries, and especially for emerging economies like Ukraine, it is important to develop trade and economic ties with those markets where it can sell more goods with higher added value and more technologically sophisticated ones. Comparing the commodity structure of Ukraine’s exports to the EAEU and the EU, we see that the Eurasian market is still better suited in this regard.
Despite the fact that between 2013 and 2018, the country managed to increase the share of deliveries of machinery, equipment and vehicles to the European Union by 4.5 percentage points. (from 11.5 percent to 15 percent), this share is even higher for the EAEU – 22.1 percent. For that, Kiev sells a larger share of products to the EU with a relatively lower level of processing as to the EAEU: food products – over 30 percent versus 16.5 percent; mineral products – 14.5 percent versus 7.3 percent and approximately the same proportion of metals – 22 percent and 21.8 percent, respectively. Moreover, the share of exports of chemical products is higher to the EAEU than to the EU – 26.4 percent versus 17.2 percent (Chart 12, Table 6).
Chart 12. Commodity structure of Ukraine’s exports to the EAEU and EU in comparison (2018, HS2, percent share)
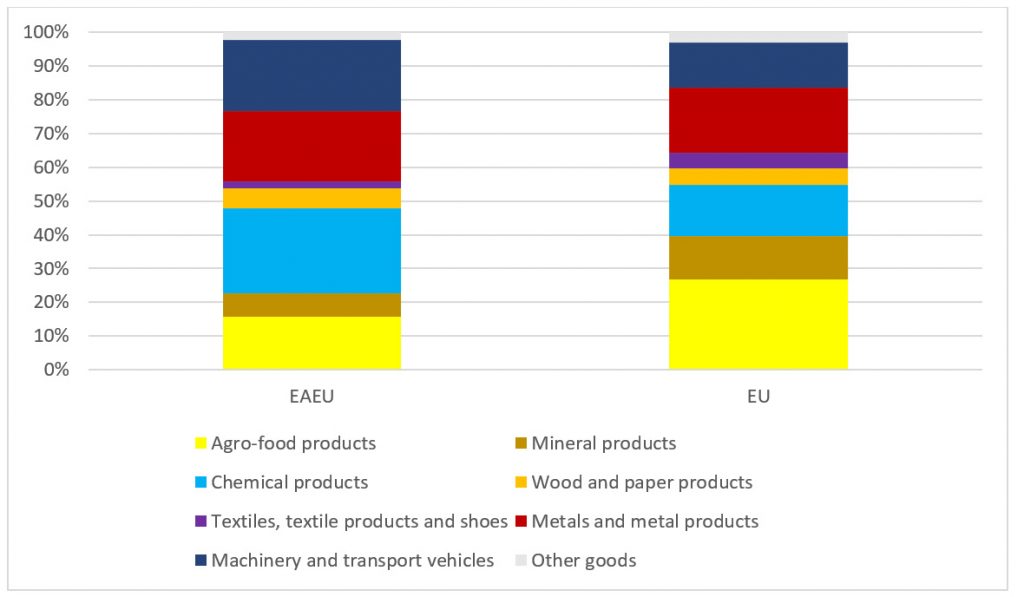
Source: ITC Trade Map and author’s calculations.
Conducting a comparative analysis of Ukraine’s merchandise exports to the EAEU and the EU in terms of the level of processing for 2018, we see that the share of deliveries of semi-processed and finished products to the Eurasian Union is two times higher than to the European Union: 32.4 percent versus 13.5 percent (Chart 13, Table 6).
Chart 13. Ukraine’s export level of processing to the EAEU and the EU in comparison ( percent share of total, 2013 and 2018)
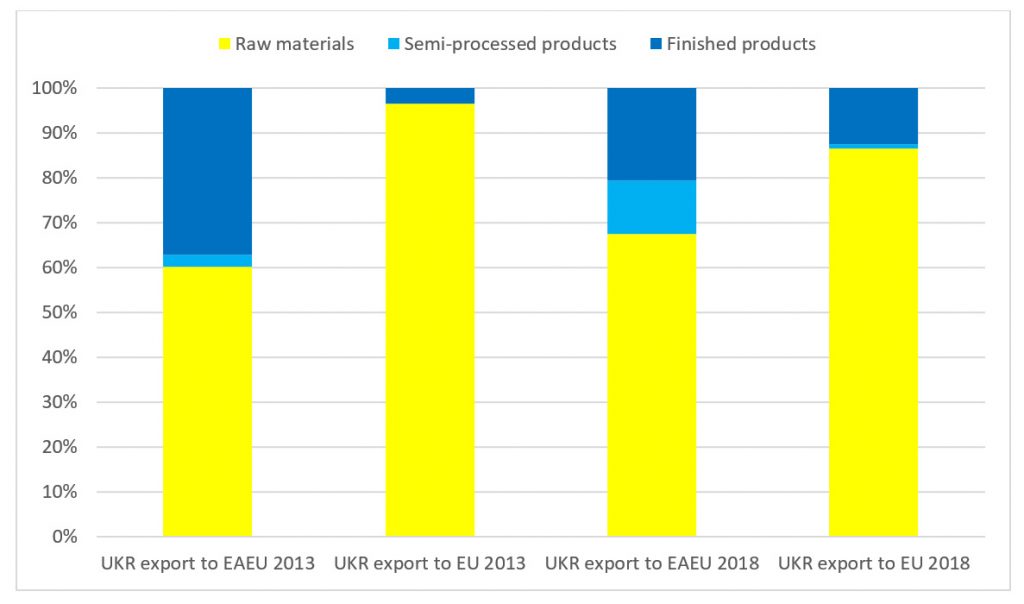
Source: Author’s calculations using WITS and MTN classification.
Trade diversification
Despite the fact that between 2013 and 2018, Kiev managed to diversify its export structure to the European Union, it is still more diversified towards the EAEU, where the Herfindahl-Hirschman index (HHI) is only 0.067, as opposed to 0.082 for the EU (Chart 14, Table 6). The HHI (measured hi = ∑k (sik)2) can range from 1 to 0. The lower the index, the higher the level of diversification.
Chart 14. Ukraine’s export diversification to the EAEU and the EU in comparison (HHI, 2013 and 2018)
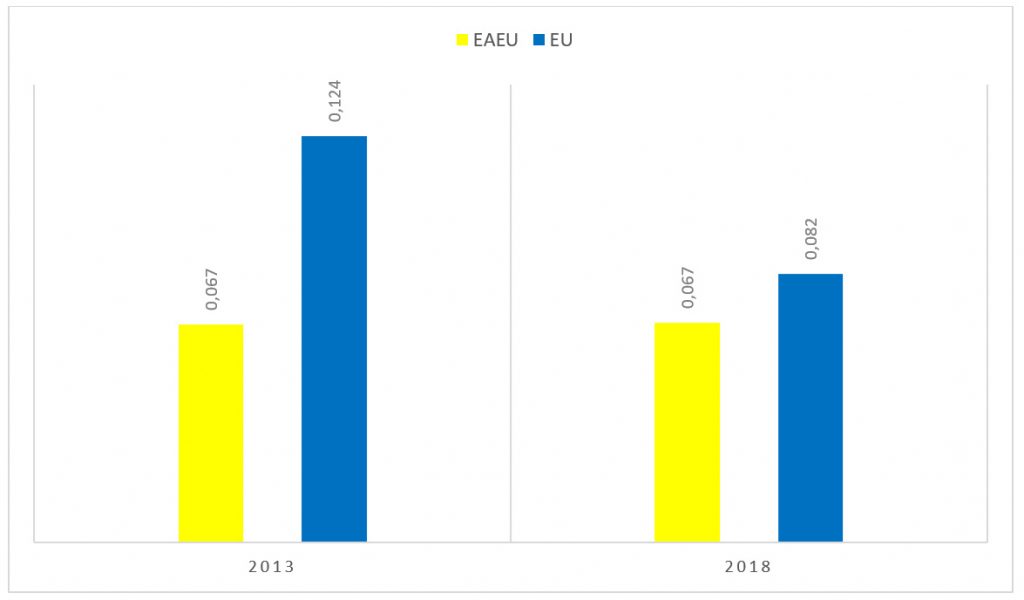
Source: ITC Trade Map and author’s calculations.
Geographic structure of trade
The Eurasian Economic Union is the second most important trading partner for Ukraine after the European Union. In 2017, export deliveries there accounted for 13 percent of the country’s export structure, and imports from the EAEU amounted to almost 24 percent of all foreign shipments to Ukraine. The EU accounted for over 36 percent of all exports from and almost 40 percent of all imports to Ukraine (Chart 15, Table 7). Incidentally, orientation towards the European market is also characteristic for the Eurasian Union. In 2018, intra-union trade made up only 13.5 percent of all EAEU trade, and in 2017 the European Union accounted for almost half of foreign exports and over 40 percent of the EAEU’s imports from abroad. Interestingly enough, according to the Observatory of Economic Complicity (OEC), Russia remains Ukraine’s single most import trade partner country, accounting for 9.2 percent of the country’s exports and 15 percent of its imports in 2017.
Chart 15. Ukraine’s geographic trade structure (in percent of total, 2017)
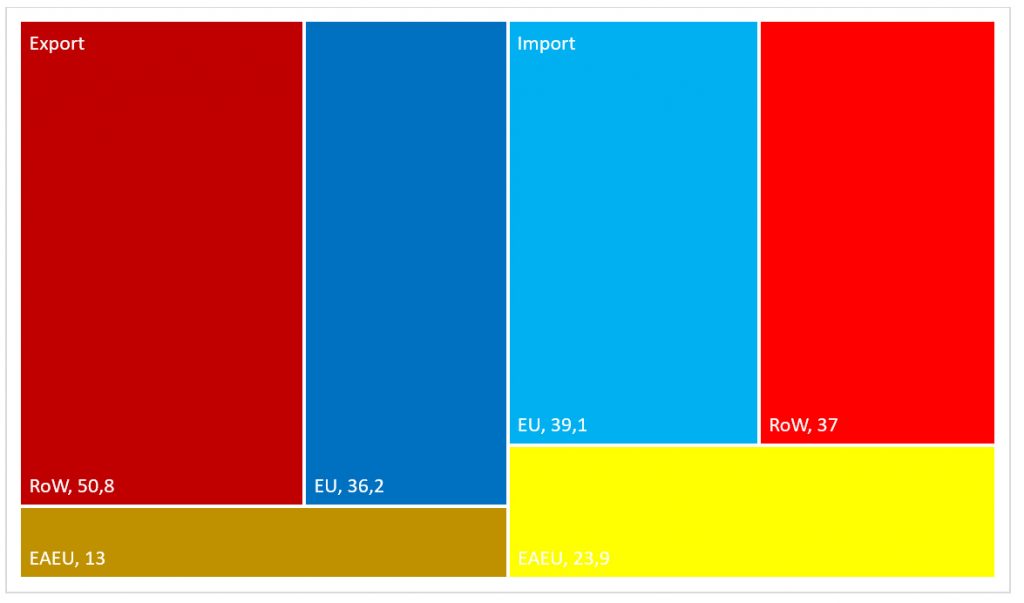
Source: OEC, EEC Statistics Department, Eurostat and author’s calculations.
As mentioned above, Ukraine is a much less important trading partner for the EAEU than vice versa. So, in 2017, the country amounted to 3.2 percent of external supplies of the EAEU and 2.8 percent of its foreign imports. This indicator is higher than for Azerbaijan, Moldova, Tajikistan and Uzbekistan taken together (2.3 percent in EAEU exports and 1.4 percent of its imports).
Economy and population
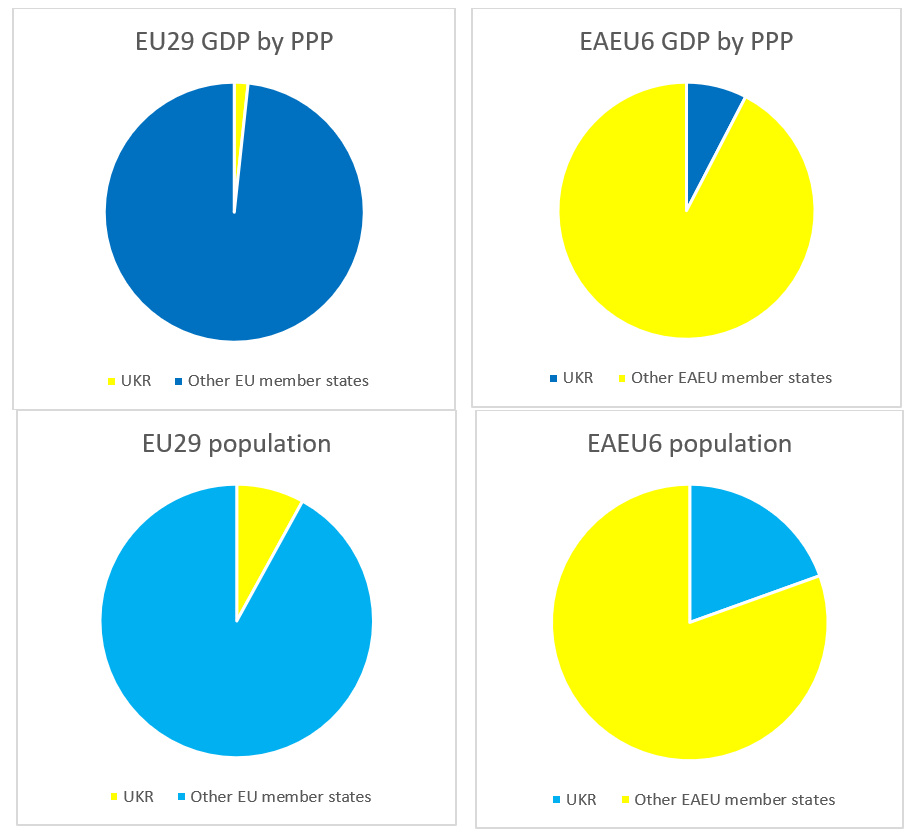
Comparing economic and demographic size, upon a hypothetical accession to the EAEU, Ukraine would have a much larger weight in the integration bloc, than if it would join the European Union. If Ukraine would have become a member state of the EU in 2018, it would have accounted for less than 2 percent of the enlarged European Union’s GDP and only 8 percent of its population. Instead, if it would have joined the EAEU, it would have become the third largest economy in the Eurasian Union, after Russia and Kazakhstan, and would make up almost 8 percent of the expanded EAEU’s GDP. It would have become the second most populous EAEU member state, accounting for almost 20 percent of the larger union’s total population (Chart 16, Table 8),
Chart 16. Ukraine’s economic and geographic share in an enlarged EAEU or EU (percent share of total, 2018)
Source: EEC Statistics Department, World Bank Data and author’s calculations.
Despite the fact that Ukraine is geographically closer to the EAEU than to the EU (measured by train travel distance between their respective administrative centers), the country’s “trade attraction” is higher towards the European market than to the Eurasian one, because of the former’s larger weight, i.e. size. The Ukraine-EU Isard gravity index is 2 times higher than the Ukraine-EAEU Isard index (measured Fij = G * Yi * Yj / Dij): 2117,1 vs 4769,3 (Table 9).
Tariff regimes
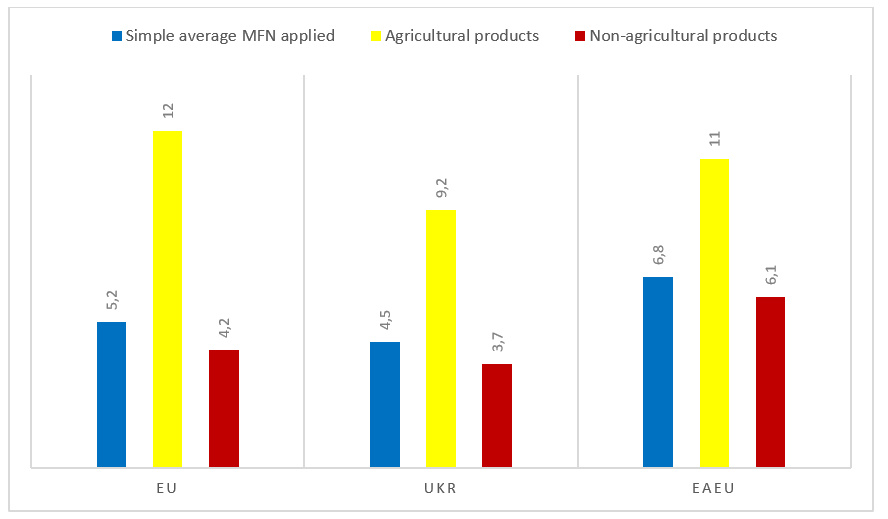
Compared to both the EAEU and the EU, Ukraine has a rather liberal tariff regime. Kiev’s simple average MFN regime applied is 4.5 percent, that for agricultural products – 9.2 percent, for non-agricultural products – 3.7 percent. By the way, the country had approximately the same tariff regime in 2013, i.e. even before its DCFTA with Europe. Thus, in a hypothetical scenario were Ukraine would join the European Union, it would have to raise its tariff protection by 0.7 p.p. on average, for agro-food products by 2.8 p.p. and for all non-agricultural goods by 0.5 p.p. If Kiev were to join the Eurasian Economic Union, it would have to increase its simple average MFN regime applied by 2.3 p.p., for agricultural products by 1.8 percent, for non-agricultural products by 2.4 percent (Chart 17, Table 10).
Chart 17. Comparison of average tariff regimes between the EAEU, the EU and Ukraine (2018)
Source: World Tariff Profiles 2019 and author’s calculations.
Technical regulations
Since 2014, Ukraine has embarked on the path of adopting the European system of technical regulation, standardization, certification and accreditation. The final goal of this process of administrative and institutional reforms is to implement the Agreement on “Conformity Assessment and Acceptance of Industrial Products” (ACAA). By 2018 of a total of 27 acts of the European sectorial legislation outlined in the DCFTA and Ukraine-EU Association Agreement, Kiev has approved 24 technical regulations, of which 23 have already been enacted. On the whole, Ukraine has approved 56 technical regulations, 52 of which were drafted on the basis of the EU legislative acts. At the same time, 54 technical regulations have already been enacted and declared binding.
In this regard, it would seem that a substantial technical barrier has arisen for any potential trade and economic cooperation with the Eurasian Union, where the CIS GOST product conformity system operates. However, this is actually not the case. The fact is that the Eurasian Economic Commission autonomously has been working towards maximal approximation of the EAEU’s technical regulation system to that of the European Union. Most of the 47 adopted technical regulations and 11,000 standards them are “identical” in text and content to the EU’s technical regulations and European standards, as well as to international standards which also coincide with the European ones. Thus, 31 technical regulations of the EAEU, which entered into force in the period from 2012 to 2015, were developed on the basis of EU sectoral directives and horizontal regulations. 60 percent to 95 percent of the EAEU’s product standards are identical to European/international standards, depending, of course, from regulation to regulation. For example, the EAEU technical regulation “On the safety of low-voltage equipment” practically coincides with the corresponding EU directive. This forms the “technical framework”, not only for potentially smoother Ukraine-EAEU trade, but also for a potential “common economic space from Lisbon to Vladivostok”.
Potential trade and welfare effects
EDB: interindustry macroeconomic models
The potential advantages if Ukraine would have joined the EAEU (then the EurAsEC customs union and single economic space), were simulated in a report by the Eurasian Development Bank (EDB) published in 2012, using a set of interindustry macroeconomic models.
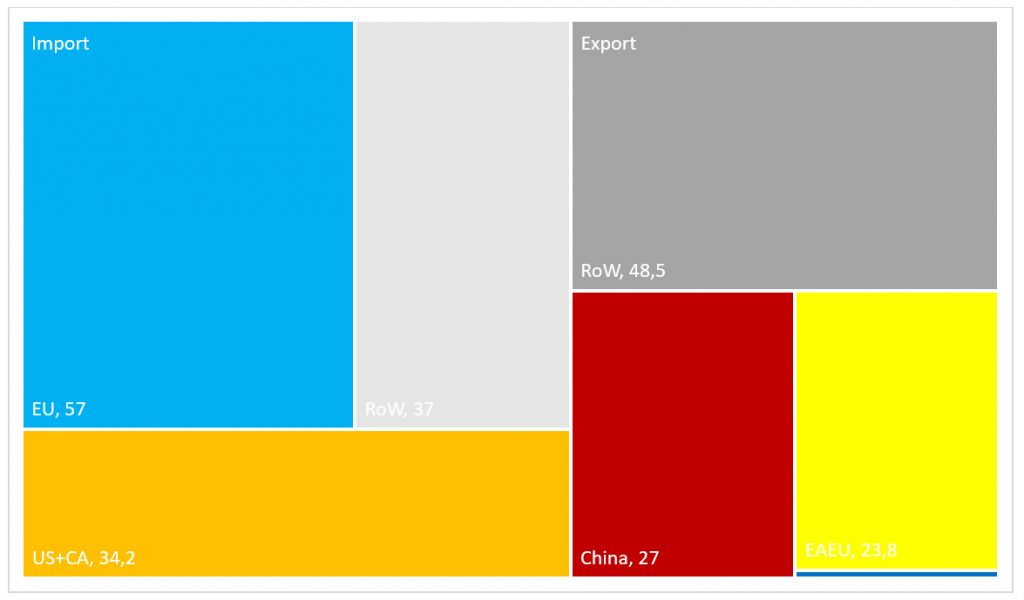
Before the crisis, Ukrainian and Russian arms and aviation manufacturing sectors remained deeply integrated following the break-up of the Soviet Union. According to the Stockholm International Peace Research Institute (SIPRI), in 2018 Ukraine was the world’s 14th largest exporter of armaments. Surprisingly, despite the de-facto state of the war between Ukraine and Russia, in 2014 – 2018 the EAEU member states (BY, KZ, RUS) were the second most important destination for Ukrainian arms exports (almost 24 percent) after China, with Russia alone, the so-called “aggressor country”, accounting for over 23 percent. Interestingly, at the same time, all of arms imports into Ukraine came from Western countries (EU, US, CA) and the UAE, whereas for the entire study period Russia did not sell a single unit of arms to Ukraine (Chart 18, Table 11). This shows that despite of the conflict, there still a large dependence of Ukrainian armament and high-tech manufacturing on the Eurasian market, and, consequently, an urgent potential for renewed cooperation.
Chart 18. Geographic structure of Ukraine’s arms trade (in percent of total, 2014-2018)
Source: SIPRI Arms Transfers Database and author’s calculations.
According to the Eurasian Development Bank, if Ukraine would had joined the EAEU in 2013, the share of aviation equipment Ukraine’s export structure to the EAEU could have increased to 4.7 percent by 2020 and to 6.3 percent by 2030. De facto it was 0.4 percent in 2013 and 0 percent in 2018. That of shipbuilding products could have reached 0.9 percent by 2020 and 1.2 percent by 2030. Interestingly, its share in reality indeed doubled between 2013 and 2018, from 0.3 percent to 0.7 percent, however its current USD value actually shrank by over 20 percent.
According to the EDB report, if Ukraine in 2013 would have become a member state of the Eurasian Economic Union, its total exports could have been 3.7 percent higher by 2025 and 3.1 percent higher in 2030 than in the baseline scenario without accession. As a member country of the EAEU its total GDP volume could have been 6.7 percent higher by 2025 and 6.6 percent by 2030 as in the baseline scenario without accession. Total positive effect of Kiev’s hypothetical Eurasian integration option on the Ukrainian economy was assessed at above USD 100 by 2025 bln (in 2010 prices) and at USD 219 bln by 2030 (in 2010 prices), i.e. at an annual average of USD 12.2 bln.
ifo Institute: gravity model
In 2017 the Munich-based ifo Institute for Economic Research published a study using the gravity model, which evaluated the trade and welfare effects of a potential EU-EAEU FTA. It also included estimations for Ukraine. Accordingly, under such a scenario, given the country would be a member state of either the EU or the EAEU, its GDP growth rate would by 5 percent higher, than without the FTA. Each Ukrainian citizen would be EUR 90 richer. The main beneficiary sectors would be electricity production, metallurgy, trade services and public administration. And since the UKR-EU DCFTA agreement had already entered into force during this study, it can be assumed that the larger part of these effects would be caused the mutual (re-)opening of the Eurasian and Ukrainian markets.
MIWI Institute: synthetic control model
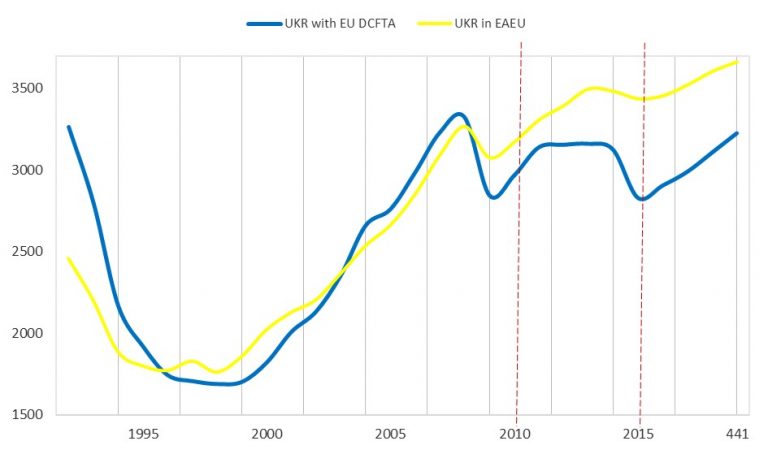
How would the Ukrainian economy have developed if Kiev, instead of signing the EU DCFTA, had chosen to join the EurasEC customs union in 2010 and the Eurasian Economic Union in 2015? An indication to this question can be given by using the synthetic control method, developed by (Abadie, Diamond, and Hainmueller, 2010).
For this model, the author stipulated the following conditionals: Ukraine was the treated country and the five EAEU member states were given as the comparison countries. The dependent variable was GDP per capita in constant USD dollars. The predictor variables were consumer price inflation, gross fixed investment in relation to GDP, the share of manufacturing and construction in GDP, the share of exports in relation to GDP. The treatment periods were 2010 and 2015. Accordingly, the predictor or common period was from 1992 to 2009 and 2014. The result or prediction period was from 2010 to 2019.
According to the simulation results, Ukraine’s economy could have fared much better, if it had joined the EurasEC customs union and the EAEU (Charts 19 and 20). In 2019, its GDP, measured in 2010 USD, could have amounted to USD 153.9 bln, which would have been 13.7 percent or USD 18.5 bln higher than Ukraine’s de-facto GDP in 2019 of USD 135.4 bln. Each Ukrainian citizen could have been 441 USD richer in GDP per capita terms: USD 3666 vs. USD 3225. On average Ukrainian GDP per capita could have been USD 400 each year from 2010 onwards.
Chart 19. Alternative economic development of Ukraine in the Eurasian CU/EAEU (1992-2019, in GDP per capita, constant 2010 USD)
Source: World Bank Data and author’s estimations.
Chart 20. Welfare difference, if Ukraine had joined the Eurasian CU/EAEU (1992-2019, in GDP per capita, constant 2010 USD)
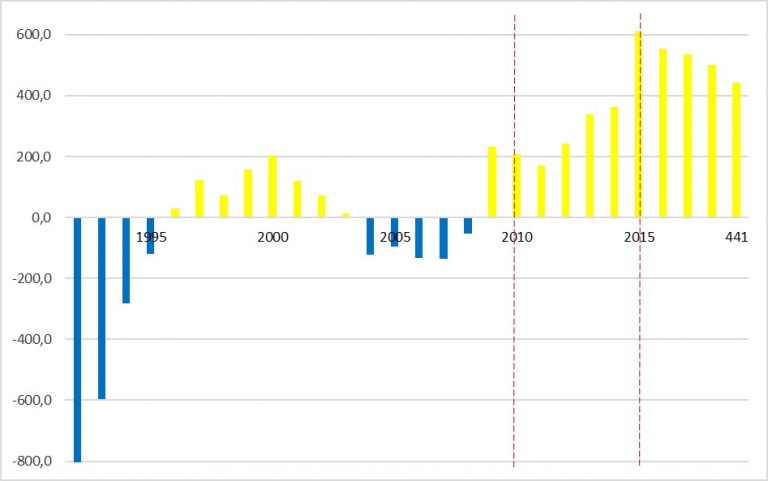
Source: World Bank Data and author’s estimations.
MIWI Institute: gravity model
In order to estimate the trade and welfare effects of Ukraine and Russia mutually lifting their sanctions the author employed a gravity trade model.
The simulation methodology was first developed by Anderson (1979), and further augmented by Santos, Silva et Tenrenyo (2006) on consistency with heteroskedasticity and accounting for zero trade flows; by Fally (2015) on using fixed effects to match multilateral resistances consistent with structural terms; and by Anderson, Larch et Yotov (2015) on using Poisson pseudo-maximum likelihood estimation (PPML). The latter also introduced a three-step estimation procedure with a baseline scenario, a counterfactual scenario, and a full endowment general equilibrium, – all of which will be applied in this simulation.
For the purposes of this model, the author constructed a new database, which includes data on bilateral manufactured goods trade flows for 169 countries in the year 2015, on bilateral population-weighted distance, a contiguity dummy, a common currency dummy, a dummy for being in a free trade area, and a dummy for being in a customs union based on four different datasets provided by the WTO, the CEPII, the United States International Trade Commission, and De Sousa (2014), as well as the Global Sanctions Data Base (2021) (Formula 1):
| (1) | Xij = exp(b1lnDISTij + b2CNTGij + b3BRDRij + b4_COMCURij + b5_FTAplusij + b6_CUplusij + b7_MILSANCTij + b8_TRADESANCTij + b9_FINSANCTij + b10_TRAVSANCTij + pi + cj) + eij |
Where Xij is merchandise trade flow trade flow from exporter i to importer j; DISTij is the population-weighted distance between i and j; CNTGij is a contiguity dummy; BRDRij is a border / international trade dummy; COMCURij is a dummy if the exporter i and importer j share a common currency; FTAplusij is a dummy if the exporter i and importer j are part of a deep free trade agreement; CUplusij is a dummy if the exporter i and importer j are part of a customs and economic union; MILSANCTij is a dummy for a military assistance sanction from the exporter i on the importer j; TRADESANCTij is a dummy for a trade sanction from the exporter i on the importer j; FINSANCTij is a dummy for a financial sanction from the exporter i on the importer j; TRAVSANCTij is a dummy for a travel sanction from the exporter i on the importer j; pi is the exporter fixed effects; cj is the importer fixed effects; eij is the error term.
The counterfactual scenarios are implemented by setting the respective sanctions dummies for between Ukraine and Russia from one to zero.
As a result of mutually lifting their sanctions, total gross exports of Ukraine would increase by 8.2 percent, of Russia by almost 9 percent. But also, Germany and Poland would even benefit, with their total goods exports increasing slightly.
Subsequently, mutually lifting sanctions would increase the GDP of Ukraine by 1.4 percent, that of Russia by 0.4 percent. The economies of the surrounding countries would also benefit very slightly.
MIWI Institute: partial equilibrium model
Finally, the author used a partial equilibrium model developed by (Francois et al. 2002) in order to estimate the potential effects of three counterfactual scenarios: a. Ukraine and Russia mutually lift their sanctions; b. Ukraine becomes a member state of the EAEU but has to annul its deep and comprehensive free trade agreement with the European Union; c. Ukraine becomes a member state of the EAEU but stays in the free trade area with the EU.
For the simulation, the author used the following input data: 1. Bilateral data on trade in goods for 2018 for four parties (Ukraine, EAEU, EU and the “rest of the world”), taken from the (WITS UN Comtrade) databases using the 2012 GTAP classification. Wherever possible, the author preferred CIF data from the importer. 2. Ad valorem equivalents of non-tariff barriers (AVE-NTB) for the EAEU were taken from (Knobel et al. 2019), for Ukraine, EU and the “rest of the world” from (Niu et al. 2018). 3. The average ad valorem MFN applied import tariffs for 2018 for all parties were taken from the (WTO World Tariff Profiles 2019). 4. Import elasticities were taken from (Ghodsi et al. 2016). The elasticity of export supply and substitution were taken as constant values in all regions (Table 12).
As a result of mutually lifting sanctions, goods exports from the EAEU to Ukraine would increase 1.85 times, from Ukraine to the EAEU over 3 times. If Ukraine were to exit the EU DCFTA become a new member state of the Eurasian Economic Union, their mutual goods trade flows would increase 3 and over 4 times respectively. In such a scenario Kiev’s goods exports to the EU would decrease 1.6 times, and vice versa European exports to Ukraine would decrease 2 times. Both in the mutual sanctions scenario and the scenario, where Ukraine becomes a member state of the EAEU but still keeps its DCFTA with the EU, the trade diversion effects would remain, albeit being considerably lower.
Subsequently, according to the partial equilibrium model, mutually lifting the sanctions between Ukraine and Russia would increase Ukraine’s GDP by 7.8 percent, that of the Eurasian Economic Union – by 0.4 percent. The EU’s GDP would decrease only very slightly by 0.02 percent.
Leaving the EU DCFTA in favour of joining the Eurasian Economic Union would not harm the Ukrainian economy, but actually boost Ukraine’s gross domestic product by over 18 percent. The EAEU’s GDP would be 0.6 percent higher. Europe’s economy would be almost unaffected.
Interestingly enough, if Kiev were to join the EAEU, yet keep its deep and comprehensive free trade agreement with the European Union, then this would increase its GDP by almost a quarter (24.7 percent). The EAEU’s gross domestic product would increase by 0.7 percent and that of the EU only slightly by 0.02 percent.
Conclusion
Summary
Despite the ongoing conflict between Kiev and Moscow, there are convincing arguments in favor of resuming (initiating) trade and economic cooperation between Ukraine and the EAEU.
A small but still relevant share of the Ukrainian population continues to favor integration with the Eurasian Economic Union: from 38 percent (2018) according to Russian estimates to 13 percent (2019) according to Ukrainian polls, and especially in the south-eastern region of the country – from 24 percent to 27 percent of the local population, according to the same Ukrainian survey. The main opposition and at the same time the second largest party in the country stands for cooperation with the EAEU. In addition, in the Russian Federation itself, a positive attitude towards Ukraine has been restored: from a minimum of 28.3 percent in 2016 to 42.3 percent in 2019.
In fact, it is surprising that despite the trade war between Kiev and Moscow, their mutual restrictions and sanctions, Ukraine and the Eurasian Economic Union have managed to increase mutual trade by 30 percent since 2016, including Ukrainian exports to the EAEU by almost 26 percent.
The EAEU remains Ukraine’s second most important trading partner, accounting for over 1/5 its foreign trade, for almost 26 percent of its imports and for 15.6 percent of its total exports. Likewise, Russia as a single country remains Ukraine’s most important trade partner.
Ukraine and the EAEU have a high trade complementarity index: at 42.3 percent for exports from Ukraine and at 50.8 percent for imports to it. Thus, its trade complementarity with the EAEU is higher than for all other CIS countries (excluding Moldova’s for exports).
The share of exports from higher value-added Ukrainian industries to the EAEU is higher than to the EU: for machinery, equipment and transport vehicles, as well as for chemical products it is about 1.5 times higher. At the same time, the share of Ukrainian deliveries with lower added value, i.e. agricultural products and minerals, is two times higher to the European Union than to the EAEU. Accordingly, the share of Ukrainian exports of semi-processed and finished goods to the EAEU is two times higher than to Europe. Along with this, the diversification of Ukrainian exports towards the EAEU is almost 20 percent higher than towards the European Union.
Upon a hypothetical accession to the EAEU, Ukraine would have a much higher weight in such an expanded union, contributing 8 percent of its total economy (3rd place out of 6 members) and almost 20 percent of its combined population (2nd place out of 6). Contrarily, if Ukraine were to join the EU28 it would make up only 1.8 percent of its economy and only 8 percent of its population.
In the end, the fact helps that there is a process of alignment of the technical regulation systems between the EAEU, the EU and Ukraine, which potentially removes a significant barrier to free trade between Kiev and the Eurasian market.
Independent studies by the EDB and the German ifo Institute came to the conclusion that trade and economic integration of Ukraine with the Eurasian Economic Union would lead to significant welfare effects for Ukraine: by 2025-30 its GDP would be 5-7 percent higher than without Eurasian integration. Kiev’s annual gains would amount to USD 12.2 bln (in 2010 prices). The country would experience a substantial increase in the share of its high-tech exports to the EAEU, especially from its aviation and shipbuilding sectors. Other Ukrainian industries that would benefit are metallurgy, electricity generation, trade services and public administration.
In-house research by the MIWI Institute comes to similar conclusions. According to a gravity model and a partial equilibrium model, mutually lifting the sanctions’ regime between Kiev and Moscow would increase Ukraine’s GDP by 1.4 to 7.8 percent, that of Russia and the EAEU by 0.4 percent.
Strikingly, as the partial equilibrium model shows, leaving the EU DCFTA in favor of joining the Eurasian Economic Union would not harm the Ukrainian economy, but actually boost Ukraine’s gross domestic product by over 18 percent. The EAEU’s GDP would be 0.6 percent higher. This result is underpinned by the synthetic control method, which shows that Ukraine’s economy could have fared much better, if it had joined the EurasEC customs union and the EAEU instead of going the path of European integration. In 2019, its GDP would have been almost 14 percent higher.
Interestingly enough, if Kiev were to join the EAEU, yet keep its deep and comprehensive free trade agreement with the European Union, then this would increase its GDP by almost a quarter (24.7 percent). The EAEU’s gross domestic product would increase by 0.7 percent and that of the EU only slightly by 0.02 percent.
A consesus estimate between the research results of the ifo Institute, the Eurasian Development Bank and the various models of the MIWI Institute puts Ukraine’s additional GDP, if it were to join the Eurasian Economic Union, at 10.9 percent. In 2019 prices this would make every Ukrainian citizen around USD 400 wealthier on average.
Policy recommendations
We have shown that (re-)initiating stronger trade and economic relations between Ukraine and the Eurasian Economic Union makes sense. But how to move forward from the frozen conflict towards some form of cooperation?
Firstly, it is obvious that the basic condition for any rapprochement would have to be an acceptable solution for all those involved of the territorial dispute around Donbass and Crimea. Since this is an economic report, the author does not pretend to have an answer on such a complex and emotionally charged political question. Nevertheless, it seems to be necessary to strive for the peaceful reintegration of Donbass into Ukraine on the basis of a decentralization (federalization) of the country’s state system outlined in the Minsk II. That such a reform, which has already been partially initiated by the Ukrainian government, may be in the economic interests of the center, is shown in a study by the Ministry of Regional Development of Ukraine: between 2014 and 2017 local budget revenues grew by almost 60 percent, with the revenues of more autonomous local communities growing 2.5 to 4.5 faster that less autonomous regions.
On the Crimean issue, and in general in Russo-Ukrainian relations, it is necessary to come to such a consensus that would allow both sides to “save face” and “declare victory”, both domestically and internationally.
Secondly, as already proposed by the Brussels-based Centre for European Policy Studies (CEPS), it would be necessary to depoliticize the track of a possible strengthening of relations between Ukraine and the EAEU and to focus on solving pragmatic technical trade- and business-related issues between the parties. It stands to reason that Belarus could take a leading role in establishing such a dialogue. Minsk already has shown itself as a successful mediator and peacemaker in the Ukrainian conflict, and it, first among others, ought to be interested in improving trade and economic relations with the Ukrainian market and business community.
Thirdly, it is necessary to internalize that any rapprochement between Ukraine and the EAEU would be impossible without establishing trust and coordination between the European and the Eurasian unions. Despite the fact that the European Commission has not yet recognized the supranational status and international legal personality of the EAEU, it is encouraging to see that for the first time in 2017 and then on a regular basis since June 2019, both commissions held meetings at department level to discuss technical issues such as industrial product conformity requirements, sanitary-phytosanitary measures and customs cooperation.
Thus, the potential rapprochement process should be conducted at two levels simultaneously – Ukraine-EAEU and EU-EAEU and preferably in the form of a trialogue.
In no case should a potential improvement in trade and economic relations between Ukraine and the EAEU be seen or presented as Kiev’s drawback from close trade and economic cooperation with the European Union or even from the country’s path of “Euro-integration”. On the one hand, both Brussels and Kiev should abandon the zero-sum game mentality in favor of a complementarity approach, when it comes to dealing with Russia and the Eurasian integration project. On the other hand, just as the Comprehensive and Enhanced Partnership Agreement (CEPA), which entered into force between the EU and Armenia (an EAEU member state) at the beginning of 2018, covers all areas of cooperation except those that are within the supranational competence of the Eurasian Economic Commission, any possible deepening of trade and economic cooperation between Ukraine and the EAEU must respect the obligations set out in the Ukraine-EU DCFTA Agreement.
Fourth, in terms of chronology of a possible rapprochement, national and regional business communities and think tanks from the EAEU, Ukraine and the EU should be the first to initiate a dia- or trialogue with the aim of establishing (restoring) business contacts, and, through this, of step-by-step trust (re-)building between Ukraine, Europe and the Eurasian Economic Union. As part of such a bottom-up approach it would make sense to establish a discourse between those entrepreneurs and sectors that would primarily benefit from the normalization of relations and from the establishment of trade and economic cooperation with the Eurasian Economic Union. For example, Belarus could take the initiative in holding an annual “Minsk Economic Forum” with the specific aim of establishing a systematic dialogue between entrepreneurs and investors from Belarus and the other EAEU member countries, as well as from Europe with their Ukrainian counterparts. Certain business associations of Germany and Ukraine, as well as the Eurasian Economic Commission could be the first support such an initiative.
Fifth, the government of Ukraine, the EEC, and the European Commission should eventually join in this dia-/trialogue. One option would be to hold informal and closed, but systematic meetings between representatives of the Ministry of Economic Development, Trade and Agriculture of Ukraine and the Eurasian Economic Commission. Just like the initiative from 2012, which was mentioned at the beginning of the report, these talks could cover the following practical issues: 1. Increasing the transparency and predictability of existing administrative and regulatory systems; 2. Negotiation of mutually acceptable solutions concerning sensitive trade barriers; 3. Exchange of information on technical regulations and standards, both on non-agro-industrial goods, as well as on sanitary-phytosanitary measures; 4. Mutual facilitation of customs procedures; 5. Cross-border cooperation between Belarus and Ukraine; 6. Cooperation in the cross-border electric market; 6. Lifting restrictions on the transit of goods and the development of transport infrastructure, including as part of the Chinese “Belt and Road” Initiative.
It is clear that the primary goal of such talks would be to push Kiev and Moscow to lift their mutual sanctions and restrictions. The Kremlin’s decision to revoke its ban on the transit of goods between Ukraine, Kazakhstan and Kyrgyzstan trough the territory of the Russian Federation at the insistence of Nursultan and Bishkek shows that the EAEU is an effective platform for such a dialogue. The lifting of these sanctions and barriers is in the interests of the Eurasian integration idea, including Russia itself, since they distort the formally unified trade policy of the EAEU and de facto create a “two-tier” customs union.
Another important aspect of these talks could be the implementation of a joint monitoring and control of the re-export of European goods to the EAEU and of Eurasian products to the EU through the territory of Ukraine by introducing international trade practices such as “rules of origin” and “regional value added” (RVO) regulations. The system of digital marking and traceability of goods launched as part of the EAEU’s 2025 Digital Agenda might also aid in their application.
In the future, subject to a gradual normalization of relations, say by the years 2025-2030, it might be viable to offer Kiev the status of an observer state with the EAEU. This format does not oblige to anything (except to a formal “abstinence from any actions that could harm the interests of the Union and its member states”), but gives the right to participate without the right to vote in all meetings of the EAEU bodies and receive all its documentation except which is deemed “confidential”. Another EU DCFTA country – Moldova – is already an observer state with the Eurasian Economic Union since May 2018.
Even further into the future Ukraine and the EAEU might consider concluding a free trade agreement and after that – a supplementary comprehensive economic partnership agreement (CEPA), such as the one between the EAEU and Singapore, signed in October 2019. Here special attention could be given to reducing non-tariff barriers, as well as creating the necessary framework for increasing trade in services, mutual FDIs, industrial and digital cooperation.
According to the aforementioned survey of the Analytical Center under the Government of the Russian Federation, conducted in the summer of 2018, Ukrainian citizens would consider the most beneficial desired effects from a hypothetical deepened cooperation with the EAEU (multiple-choice answers): creation of new jobs (33 percent), increase in household incomes (30 percent) and lower prices for goods due to the emergence of new suppliers / manufacturers (25 percent). Interviewed Ukrainian entrepreneurs named as the potentially most beneficial effects: opening of new sales markets (49 percent), lowering customs duties and facilitation of customs control (27 percent), reduction of trade barriers in the EAEU member states (26 percent), increased investments from the EAEU member states (23 percent).
More than 15 years after the launch of the “European Neighborhood Policy” (ENP) and more than a decade after the start of the EU “Eastern Partnership” (EaP) program, Western expert circles increasingly accuse them of losing their purpose and call for a rethinking and an up-grade of both initiatives. One potential option would be to turn the Eastern Partnership into a trialogue platform between the EU, the EAEU and the countries of their “shared neighborhood”.
In the end, we can once again emphasize that the ultimate goal of all the above aspirations is not to drag Ukraine from one union to another, but to create a common space of peace and prosperity “from Lisbon to Vladivostok.” After all, what is better for Ukraine itself – to be the “edge” (Ukr, окраїна, okraina) of either Europe or Eurasia or to become the cross-roads of a united continent?
Annex
Data tables
Table 1. Popular support in Ukraine for joining the EAEU (2013-2019, affirmative answer in percent of total)
| 2013a | 2014a | 2015a | 2016 | 2017 | 2018b | 2019c | |
| Population | 50 | 31 | 19 | – | – | 38 | 13 |
| Business community | – | – | – | – | – | 52 | – |
| Trend (population)a+c | 50 | 31 | 18 | 17,8 | 16,6 | 15,4 | 13 |
Source: aEDB Integration Barometer (2013-2015). bAnalytical Center of the Government of Russia (2018, deepening of trade and economic cooperation). cIlko Kucheriv Democratic Initiatives Foundation (2019). Trend based on author’s calculations.
Table 2. Positive attitudes of Russians towards Ukraine (2012-2019, affirmative answer in percent of total)
| 2012 | 2013 | 2014 | 2015 | 2016 | 2017 | 2018 | 2019 | |
| Positive | 68.2 | 70.8 | 44.1 | 28.3 | 30 | 30.6 | 33.0 | 42.3 |
Source: Yuri Levada Analytical Centre and author’s calculations.
Table 3. Ukraine – EAEU merchandise trade (2011-2018)
| in USD bln (current) | in percent of UKR exports, imports, trade turnover | in percent of EAEU exports, imports, trade turnover | |||||||
| EAEU exports to UKR | UKR imports to EAEU | UKR-EAEU total turnover | UKR exports to EAEU | UKR imports from EAEU | UKR-EAEU total turnover | EAEU exports to UKR | EAEU importss from UKR | UKR-EAEU total turnover | |
| 2011a | 37.3 | 23.9 | 61.2 | 34.9 | 45.2 | 40.5 | 6.4 | 7.3 | 6.7 |
| 2012a | 35.3 | 23.2 | 58.5 | 33.8 | 41.7 | 38.2 | 5.9 | 6.8 | 6.2 |
| 2013a | 30.0 | 20.1 | 50.1 | 31.3 | 39.1 | 35.5 | 5.1 | 5.8 | 5.4 |
| 2014 | 22.9 | 13.6 | 36.5 | 25.1 | 42.2 | 33.6 | 4.1 | 4.4 | 4.2 |
| 2015 | 13.0 | 7.7 | 20.7 | 20.2 | 34.7 | 27.4 | 3.5 | 3.7 | 3.6 |
| 2016 | 10.1 | 5.5 | 15.6 | 15.1 | 25.7 | 20.6 | 3.3 | 2.7 | 3.1 |
| 2017 | 12.5 | 6.8 | 19.3 | 15.7 | 25.2 | 20.8 | 3.2 | 2.7 | 3.0 |
| 2018 | 14.7 | 7.4 | 22.1 | 15.6 | 25.8 | 21.2 | 3.0 | 2.8 | 2.9 |
Source: EEC Statistics department, ITC Trade Map and author’s calculations. aOnly BY, KZ, RUS.
Table 4. Ukraine – EAEU merchandise trade by country composition (2011-2018)
| EAEU export to UKR
in percent of EAEU total |
UKR export to EAEU
in percent of EAEU total |
in USD bln (current) | |||||||
| BY | KZ | RUS | BY | KZ | RUS | BY export to UKR | UKR export to BY | UKR-BY total turnover | |
| 2011a | 11.1 | 7.1 | 81.8 | 8.4 | 7.4 | 84.2 | 4.1 | 2.0 | 6.1 |
| 2012a | 15.8 | 7.2 | 77.0 | 10.0 | 12.6 | 77.4 | 5.6 | 2.3 | 7.9 |
| 2013a | 14.0 | 6.8 | 79.2 | 10.2 | 11.2 | 78.6 | 4.2 | 2.1 | 6.3 |
| 2014 | 17.9 | 7.3 | 74.8 | 12.4 | 8.9 | 78.7 | 4.1 | 1.7 | 5.8 |
| 2015 | 19.4 | 9.0 | 71.5 | 12.4 | 10.8 | 74 | 2.5 | 1.0 | 3.5 |
| 2016 | 28.2 | 9.0 | 62.7 | 18.1 | 8.0 | 71.3 | 2.8 | 1.0 | 3.8 |
| 2017 | 27.0 | 9.1 | 63.8 | 18.1 | 6.8 | 72.8 | 3.4 | 1.2 | 4.6 |
| 2018 | 27.7 | 7.2 | 65.0 | 18.9 | 5.2 | 73.4 | 4.1 | 1.4 | 5.5 |
Source: EEC Statistics department, ITC Trade Map and author’s calculations. aOnly BY, KZ, RUS.
Table 5. Trade complementarity indexes for EAEU trade with Azerbaijan, Moldova, Uzbekistan, Ukraine and Tajikistan (2017, in percent)
| AZE export matches EAEU import | 6.9 | EAEU export matches AZE import | 38.0 |
| MDA export matches EAEU import | 54.9 | EAEU export matches MDA import | 43.4 |
| TJK export matches EAEU import | 25.2 | EAEU export matches TJK import | 41.5 |
| UKR export matches EAEU import | 42.3 | EAEU export matches UKR import | 50.8 |
| UZB export matches EAEU import | 36.0 | EAEU export matches UZB import | 36.6 |
Source: EEC Statistics Department, OEC database and authors calculations.
Table 6. Commodity structure and level of processing of external merchandise trade of the EAEU and Ukraine with third parties (2017, 2013 and 2018, HS2, in percent of total)
| 2017a | UKR exports tob | |||||||
| EAEU export to UKR | EAEU import from UKR | UKR export from EAEU | UKR import from EAEU | 2013 EAEU | 2013 EU | 2018 EAEU | 2018 EU | |
| By commodity composition | ||||||||
| Agro-food products | 5.3 | 12.2 | 39.6 | 9.3 | 14.8 | 17.8 | 16.5 | 30.4 |
| Mineral products | 62.7 | 1.3 | 10.2 | 25.3 | 7.6 | 20.3 | 7.3 | 14.5 |
| Chemical products | 6.0 | 18.0 | 5.1 | 19.2 | 16.4 | 26.3 | 26.4 | 17.2 |
| Wood and paper products | 3.0 | 1.6 | 4.2 | 2.8 | 6.5 | 3.9 | 6.2 | 5.7 |
| Textiles, textile products and shoes | 0.3 | 6.4 | 2.7 | 5.4 | 1.4 | 5.3 | 2.0 | 5.1 |
| Metals and metal products | 10.6 | 6.5 | 25.3 | 6.0 | 23.0 | 32.9 | 21.8 | 22.0 |
| Machinery and transport vehicles | 3.8 | 44.7 | 11.9 | 30.7 | 32.5 | 11.5 | 22.1 | 15.0 |
| Other goods | 8.3 | 9.3 | 1.0 | 1.3 | 3.1 | 1.5 | 2.4 | 3.5 |
| Total | 100 | 100 | 100 | 100 | 100 | 100 | 100 | 100 |
| By level of processingc | ||||||||
| Raw materials | – | – | – | – | 60.2 | 96.6 | 67.5 | 86.5 |
| Semi-processed products | – | – | – | – | 2.7 | 0.0 | 11.8 | 1.0 |
| Finished products | – | – | – | – | 37.1 | 3.4 | 20.6 | 12.5
|
Source: aEEC Statistics Department, OEC database and authors calculations. bITC Trade Map and authors calculations. cAuthor’s calculations using WITS and MTN classification.
Table 7. Georgraphic trade structure of Ukraine and the EAEU (2017, in percent of total)
| UKR | EAEU | |||
| Export | Import | Export | Import | |
| UKR | – | – | 3.2 | 2.7 |
| EAEU | 13.0 | 23.9 | – | – |
| EU28 | 36.2 | 39.1 | 49.8 | 40.6 |
| RoW | 50.8 | 37 | 47.0 | 56.7 |
Source: OEC, EEC Statistics Department, Eurostat and author’s calculations.
Table 8. Ukraine’s economic and geographic share in an enlarged EAEU or EU ( percent share of total, 2018)
| EAEU | EU28 | Ukraine | |
| GDP by PPP (in USD bln, current) | 4730 | 22435.3 | 390.3 |
| UKR GDP by PPP in percent of EAEU+UKR | 7.6 | ||
| UKR GDP by PPP in percent of EU28+UKR | 1.7 | ||
| Average annual population (mln people) | 184 | 513.2 | 44.6 |
| UKR average annual population in percent of EAEU+UKR | 19.5 | ||
| UKR average annual population in percent of EU28+UKR | 8.0 | ||
Source: EEC Statistics Department, World Bank Data and author’s calculations.
Table 9. Simple gravity equations for UKR-EAEU, UKR-EU, EU-EAEU and CN-EAEU (2018, based on their GPD by PPP and distance measured in km by train between administrative centers)
| Distance | Isgard gravity index | |
| UKR-EAEU | 872 | 2117.1 |
| UKR-EU | 1836 | 4769.3 |
| EU-EAEU | 2547 | 41664.3 |
| CN-EAEU | 7621 | 15740.8 |
Source: EEC Statistics Department and author’s calculations.
Table 10. Comparison of average tariff regimes between the EAEU, Ukraine and the EU (2017, 2018, in percent)
| Simple average MFN applied (2018) | Agricultural products | Non-agricultural products | Trade weighted average (2017) | Agricultural products | Non-agricultural products | |
| EAEU | 6.8 | 11.0 | 6.1 | 5.6 | 11.5 | 4.7 |
| EU | 5.2 | 12.0 | 4.2 | 3.0 | 8.1 | 2.7 |
| UKR | 4.5 | 9.2 | 3.7 | 2.8 | 5.5 | 2.6 |
| Necessary change (EAEU) | +2.3 p.p. | +1.8 p.p. | +2.4 p.p. | – | – | – |
| Necessary change (EU) | +0.7 p.p. | +2.8 p.p. | +0.5 p.p. | – | – | – |
Source: WTO World Tariff Profiles 2019 and author’s calculations.
Table 11. Geographic structure of Ukraine’s arms trade (2014-2018, in percent of total)
| EAEU | EU | US+CA | China | RoW | |
| Export | 23.8 | 0.7 | – | 27.0 | 48.5 |
| Import | 0.0 | 57.0 | 34.2 | – | 37.0 |
Source: SIPRI Arms Transfers Database and author’s calculations.
Table 12. Ad-valorem equivalents of tariff and non-tariff barriers between EAEU, EU, Ukraine and the rest of the world (2018, 1 = 100 percent)
| EVRAZ | EU | UKR | ROW | |
| EVRAZ | 1.00 | 1.42 | 2.73 | 1.62 |
| EU | 1.37 | 1.00 | 1.24 | 1.63 |
| UKR | 2.37 | 1.13 | 1.00 | 1.61 |
| ROW | 1.44 | 1.41 | 1.73 | 1.63 |
Source: Author’s estimates based on Knobel et al. (2019), Niu et al. (2018), WTO (2019).