_ Yuri Kofner, junior economist, MIWI – Institute for Market Integration and Economic Policy, Munich, 1 February 2021.
The Southern Common Market
The South American trade bloc (Mercado Común del Sur, short “Mercosur”) was incepted by the Treaty of Asunción in 1991 around the same time as the Soviet Union collapsed and the EU was founded. Its members states are Argentina, Brazil, Paraguay, and Uruguay, with the membership of Venezuela currently being suspended.
With a population of almost 300 mln people, it generated a nominal gross domestic product of around USD 2.9 trillion in 2019, placing the bloc as the 5th economy of the world.[1]
Being first and foremost a customs union, Mercosur is not only a large, but also a highly protected market. Having inked free trade agreements with Israel, Egypt, Japan, and the European Union (which is not ratified yet), in 2018 the customs union had an average MFN tariff towards the rest of the world of 13.7 percent.[2] According to a study by Niu et al. (2018), employing a gravity trade model, the average ad-valorem equivalent of non-tariff barriers of Mercosur was 76.5 percent in the year 2015.[3]
Tab 1. Extra-Mercosur trade protection (average ad-valorem estimates, in percent)
| Average MFN tariff (2018) | Average NTB AVE (2015) | |
| ARG | 13.5 | 77.0 |
| BRA | 13.4 | 76.0 |
| PRY | 9.8 | 78.0 |
| URY | 10.3 | 82.0 |
| MERC | 13.7 | 76.5 |
Source: Footnotes 1 and 2.
Despite these rather high external barriers, Mercosur itself is still of relatively little importance to its member states. In 2017, intra-union goods trade amounted to 7.6 percent of the bloc’s total goods trade; intra-union services trade made up 2.6 percent of its total trade in services; intra-union FDI inflows amounted to 3.4 percent of total foreign direct investment inflows into the Mercosur countries; and intra-union labour remittances made up 9.1 percent of all remittances flows of the Mercado Común del Sur.[4]
Furthermore, the pace of integration within Mercosur has slowed down over the past decade(s). In practice, intra-bloc trade is mired in red tape, non-tariff barriers, and private trade restriction agreements. As it happens with all integration initiatives, critical voices have increased, questioning the necessity and expediency of Mercosur.
Therefore, the purpose of this column is to use a scientific method to objectively determine for each member state the net welfare gains and losses from participation in Mercosur.
Methodology and data
To achieve this goal, the author employs a Keynesian cost-benefit model, which analyses the balances of the movement of the four factors of production within the common market.[5] This model is used by leading economic research institutes in Austria, such as the WIFO and wiiw, to estimate the economic costs and benefits of the European Union for the European member states.[6],[7]
The net economic effect for member state (i) from participation in Mercosur (BiMERC) is calculated by using the following formula:
BiMERC= Gij(ΣXij – Mij) + Sij(ΣiXij – Mij) + Cij(Σi Cinij + Coutij) + Lij(Σi Linij – Loutij)
Where:
Gij(ΣXij – Mij) is the net balance of total goods trade of member state (i) with the other Mercosur member states (j); Sij(ΣiXij – Mij) is the net balance of total services trade of member state (i) with the other Mercosur member states (j); Cij(ΣiCinij + Coutij) is the sum of total foreign direct investment inflows (liabilities) and foreign direct investment outflows (assets) of a member state (i) with the other Mercosur member states (j); Lij(ΣiLinij – Loutij) is the net balance of total remittances of labour migrants and personal money transfers between member state (i) and the other Mercosur member states (j).
Although Mercosur is only a customs union and thus formally only deals with trade in goods, we assume that thirty years of integration efforts also had a certain effect on the movement of the other three production factors. It should also be mentioned here that the member states founded the Mercosur Structural Convergence Fund (FOCEM) in 2010 to develop regional infrastructure projects with a multiplier effect on integration.
In the conducted cost-benefit analysis, the author summed up gross foreign direct investment inflows and outflows within the Southern Common Market since both directions of flows have a positive effect on the economy of a given member state. Intra-Mercosur FDI inflows into a member state increase the capital stock within the country. FDI outflows from the country to the other member states increase the country’s total ownership of assets in the other member states.
The data for goods trade was take from the WITS (UN Comtrade) database[8]; for services trade from the OECD Balanced International Trade in Services dataset[9]; for FDI flows from the ITC Investment Map[10] and the Central Bank of Brazil[11]; for labour remittances from the Bilateral Remittances Matrices provided by the World Bank.[12]
For the analysis, the author used a simple annual average value based on data for the period from 2013 to 2017 (from 2013 to 2016 for FDI flows).
Results
Before we continue with the analysis, a word should be said about the relative economic sizes of the Mercosur countries in relation to one another. From 2013 to 2017 on average, Brazil was by far the largest economy in the Southern Common Market. In it, the Brazilian GDP (USD 2.3 trillion) accounted for 81.5 percent of the total GDP of the integration bloc (USD 2.9 trillion). Argentina followed in second place with 15.7 percent (USD 452 bln). Paraguay and Uruguay only made up 1.2 (USD 33 bln) and 1.7 percent (USD 48 bln), respectively.[13]
Goods trade
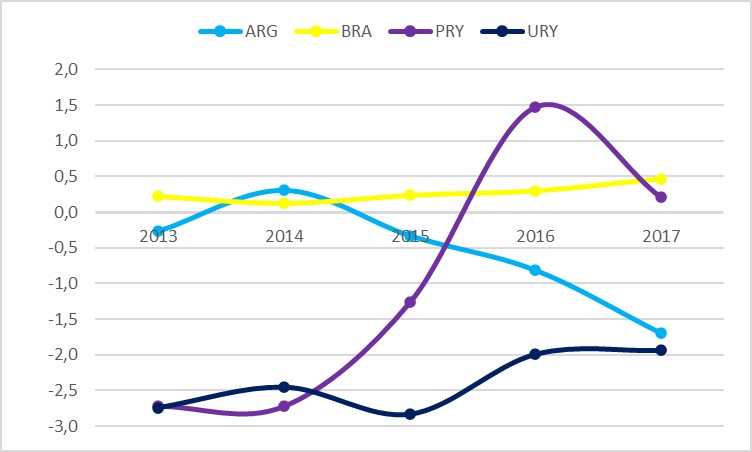
During the whole study period, Uruguay had a negative balance in goods trade with the other Mercosur member states. Montevideo was able to slightly improve its deficit from -2.7 percent in relation to GDP in 2013 to -1.9 percent in 2017. Between 2013 and 2017, Argentina’s goods trade deficit with the other union states increased from -0.3 percent of GDP to -1.7 percent. Paraguay, by contrast, was able to turn its deficit of -2.7 percent of GDP into a surplus of 0.5 percent. Only Brazil, over the entire study period, had a trade surplus with the rest of the southern common market at 0.3 percent of GDP on average (Chart 1).
Chart 1. Intra-Mercosur goods trade balances (2013-2017, in relation to GDP measured in constant 2010 USD)
Source: Estimates by the author and footnote 7.
Services trade
While Argentina, Brazil and Paraguay maintained fairly balanced balances in services trade with their common market partners over the entire analysed period, Uruguay was able to boast significant surpluses in this sector, which, however, gradually declined from 2 percent of GDP in 2013. year to 0.9 percent in 2017 (Chart 2).
Thus, it would be especially in the interests of Asuncion to reach binding agreements on the consequent removal of barriers to free services trade within the Southern Common Market.
Chart 2. Intra-Mercosur services trade balances (2013-2017, in relation to GDP measured in constant 2010 USD)

Source: Estimates by the author and footnote 8.
Capital flows
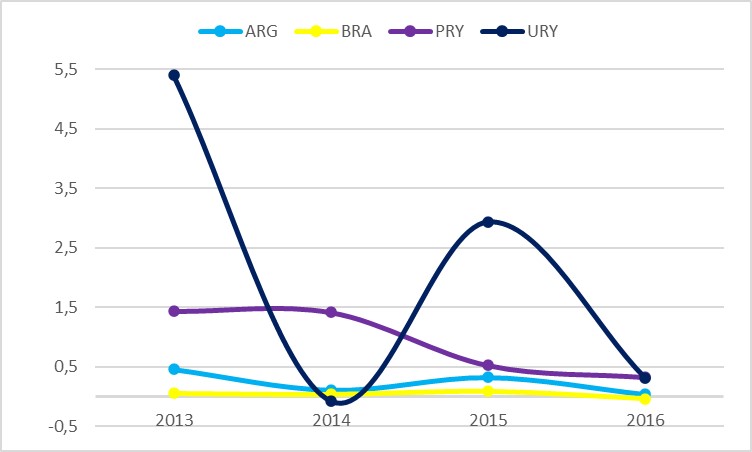
Between 2013 and 2016, mutual direct foreign investment between all member states decreased; most significantly and with large fluctuations in Uruguay: from 5.4 to 0.3 percent of GDP. In absolute terms, the capital flows were naturally greatest into and from Argentina and Brazil, which, however, in relation to their much larger gross national product made up an insignificant proportion: 0.2 and almost 0 percent on average, respectively (Chart 3).
Chart 3. Intra-Mercosur capital flows (2013-2016, in relation to GDP measured in constant 2010 USD)
Source: Estimates by the author and footnotes 9 and 10.
Labour remittances
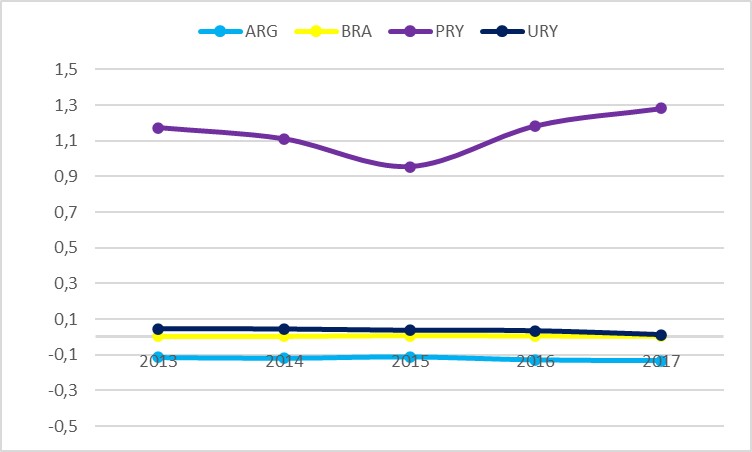
Over the entire analysed period, Argentina had a negative balance of remittances of USD 1 billion on average, or -0.1 percent of GDP, which means that more labour migrants from the other Mercosur member states arrived and worked in Argentina than vice versa. The movement of labour within MERCOSUR was of minor importance for Brazil and Uruguay. The situation is different for Paraguay, which was a net donor of labour resources within the union: Uruguayan labour migrants working in the other member states transferred home an average of USD 380 million, which was equivalent to 1.1 percent of the country’s GDP (Chart 4).
Thus, both Paraguay, as a net labour donor, and Argentina, as a net recipient, would benefit the most from the creation of a single labour market within Mercosur.
Chart 4. Intra-Mercosur labour remittances (2013-2017, in relation to GDP measured in constant 2010 USD)
Source: Estimates by the author and footnote 11.
Net welfare effects
Comparing and summing up the results of the above made cost-benefit analysis, we can state that in the Keynesian (or, more precisely, mercantilist) understanding, Brazil, Paraguay and Uruguay have net benefited from integration within Mercosur.
In absolute numbers, integration has yearly “added” the most (USD 6.5 billion) to Brazil’s gross domestic product, primarily due to a positive goods trade balance with the other member states.
Despite its goods trade deficit, direct investment flows and the surplus in services trade have given the Uruguayan economy an average of 709 billion annually.
Within the Mercado Común del Sur, a significant net balance in remittances from labour migrants, as well as intra-bloc capital flows, helped Paraguay to offset the goods trade deficit with its partner countries. In the end this ultimately added 345 million to the country’s economy.
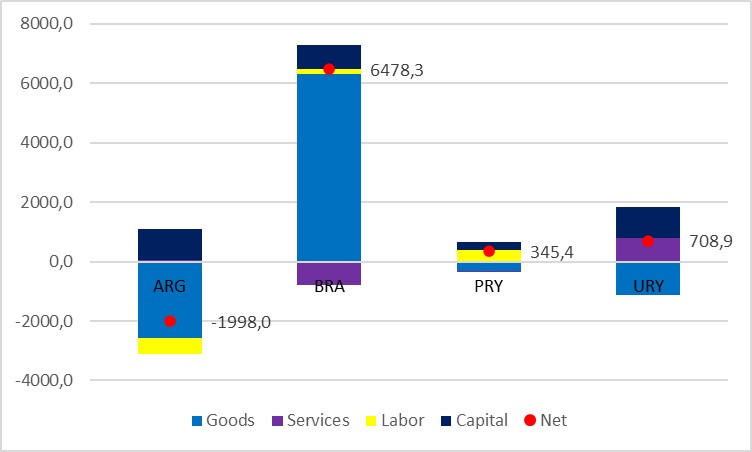
Only Argentina ended up “losing” almost USD 2 billion on average per year within Mercosur, mainly due to being a net importer of goods and labour resources from the other member countries, and despite positive capital flows (Chart 5. Table 2).
Chart 5. Net welfare effect of Mercosur (2013-2017 average, in USD million)
Source: Estimates by the author.
Table 2. Net welfare effect of Mercosur (2013-2017 average, in USD million)
| Goods | Services | Labor | Capital | Net | |
| ARG | -2556.9 | 44.3 | -550.2 | 1064.7 | -1998.0 |
| BRA | 6318.0 | -802.4 | 152.8 | 809.8 | 6478.3 |
| PRY | -307.1 | -22.1 | 380.8 | 293.7 | 345.4 |
| URY | -1139.4 | 780.2 | 16.5 | 1051.5 | 708.9 |
Source: Estimates by the author.
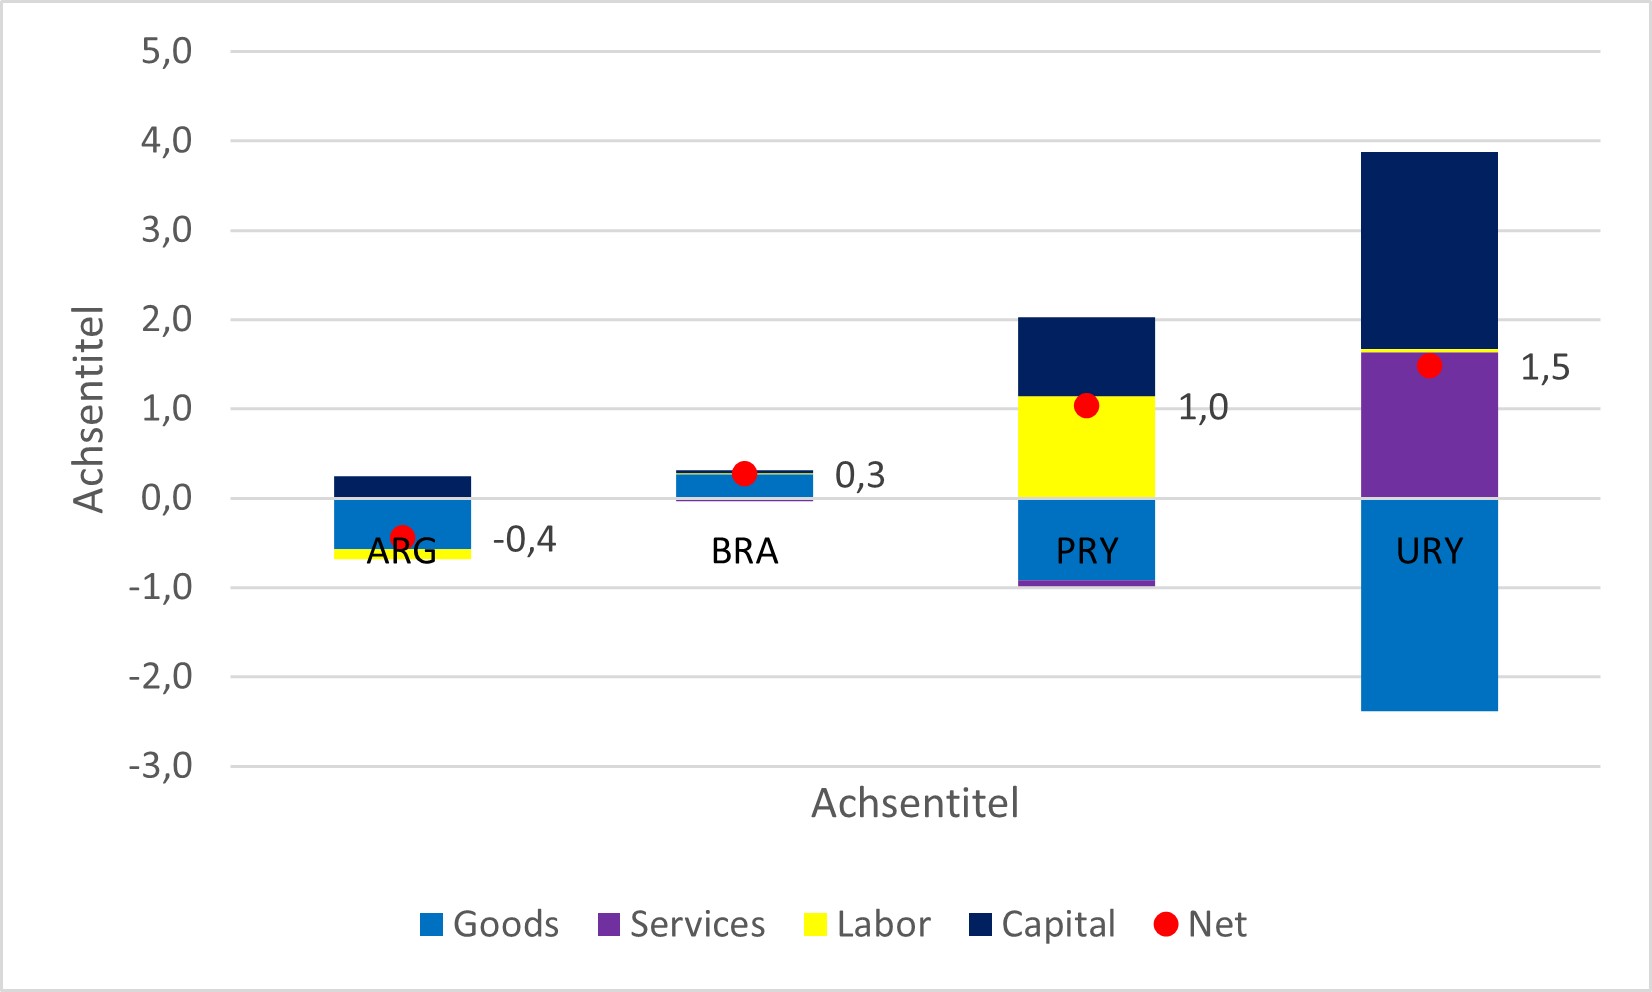
Putting the absolute values obtained above in relation to GDP (2013-2017 average in constant 2010 USD), one can estimate the relative importance of the Southern Common Market to its member states (Chart 6, Table 3).
In terms of GDP, Uruguay and Paraguay benefited the most from Mercosur: trade and economic ties with the other partners of the integration bloc gave them on average 1.5 and 1 percent of their economies, respectively. As net importers of goods, they benefited comparatively more from investment flows (both), labour migration (Paraguay) and net exports of services (Uruguay).
At the same time, the Southern Common Market was of relatively minor importance for Brazil and Argentina. As a result of the movement of the four factors of production, Mercosur added 0.3 percent to the Brazilian economy, primarily due to net goods exports, and “subtracted” 0.4 percent from the Argentine economy, due to its goods trade deficit, labour remittance outflows, and despite beneficial capital flows with its Mercosur partners.
Chart 6. Net welfare effect of Mercosur (2013-2017 average, in relation to GDP measured in constant 2010 USD)
Source: Estimates by the author.
Table 3. Net welfare effect of Mercosur (2013-2017 average, in relation to GDP measured in constant 2010 USD)
| Goods | Services | Labor | Capital | Net | |
| ARG | -0.57 | 0.01 | -0.12 | 0.24 | -0.44 |
| BRA | 0.27 | -0.03 | 0.01 | 0.03 | 0.28 |
| PRY | -0.92 | -0.07 | 1.14 | 0.88 | 1.04 |
| URY | -2.39 | 1.63 | 0.03 | 2.20 | 1.48 |
Source: Estimates by the author.
Discussion and policy recommendations
The cost-benefit model has one important drawback associated with the Keynesian (mercantilist) approach, which does not take into account the process of domestically creating added value from external inputs.[14]
Therefore, in the case of Argentina, three nuances should be noted. First, as already seen, Mercosur’s net effect on the Argentine economy is relatively insignificant, either way or the other.
Secondly, the 0.1 percent deduction from GDP associated with the outflow of remittances from migrant labourers working in Argentina does not take into account the added value these migrants created while in the country.
Thirdly, Argentina’s goods trade deficit may not be bad in itself. More important is the structure of imports, exports, and domestic consumption. For example, the net effect can be positive if imports are used to process them into higher value-added goods, which are then either consumed domestically or exported to third countries. This, for example, is the case with Belarus, which imports large quantities of crude oil from Russia, processes them in its refineries and then exports finished petroleum products with a higher added value to the European Union.[15]
However, at least in terms of processing and re-export of goods, this hypothesis was not confirmed in the case of Argentina: In its goods import from the other Mercosur member states, finished goods dominated and made up 77 percent, while in the export structure from Argentina to the rest of the world, the share of finished goods was 52 percent (Chart 7). E.g., transport vehicles and machinery made up almost 60 percent of Argentine imports from Brazil, Paraguay, and Uruguay, while agri-food products alone accounted for 70 percent of the country’s exports to all non-Mercosur countries.
Chart 7. Export sophistication of MERC – ARG – RoW goods trade (2017, in percent of total)
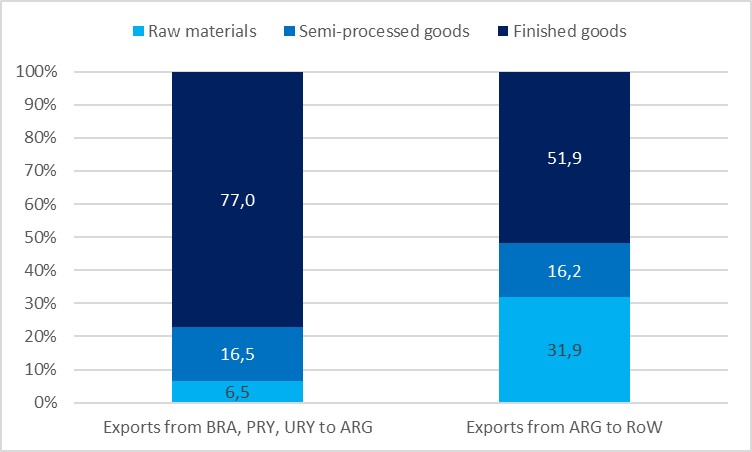
Source: Estimates by the authors using WITS (UN Comtrade) and MTN classification.
In this regard, Buenos Aires could initiate expert discussions and high-level talks on the prospects for a coordinated industrial policy and intergovernmental industrial cooperation within the Southern Common Market. The Structural Convergence Fund (FOCEM) could play a leading role in this potential new policy area.
Further, Paraguay, which benefits the most from exporting part its labour force to the other member states, should raise the issue of creating a single labour market within Mercosur, including national treatment in matters of employment, income taxes, basic social security, and pensions.
Uruguay, which benefits the most from the net export of services, should call on its Mercosur partners to adopt and implement an agenda on creating a common market for services and on the gradual liberalization of mutual trade in services.
The author hopes that in the 20s of the 21st century, the Mercosur member states will be able to reinvigorate their integration project, which rather deflated over the past decade(s). After all, a smart deepening of economic integration through the mutual elimination of barriers to the free movement of production factors, as well as the creation of new essential integration institutions, e.g., in industrial policy and digitization, will help the participating countries receive and increase welfare gains from the Southern Common Market.
Notes
[1] Measured in constant 2010 USD based on data by the World Bank.
[2] Estimated by the author using WTO tariff profiles and the share of the member states in total extra-Mercosur goods imports in 2018 based on WITS (UN Comtrade) data.
[3] Niu Z., Liu C., Gunessee S., Milner C. (2018). Non‑tariff and overall protection: evidence across countries and over time. URL: https://ideas.repec.org/a/spr/weltar/v154y2018i4d10.1007_s10290-018-0317-5.html
[4] Estimates by the author based on the databases, which are listed in the “Methodology and data” chapter of this column.
[5] Another approach would be to estimate the costs of disintegration and equate them with the economic benefits of the integration project. For example, this has been done by Felbermayr et al. (2018) on the EU, using a trade gravity and general equilibrium model (URL: https://www.ifw-kiel.de/experts/ifw/gabriel-felbermayr/undoing-europe-in-a-new-quantitative-trade-model-12767/); and by Kofner (2020) on the EAEU, using a partial-equilibrium GSIM model (URL: https://miwi-institut.de/archives/114).
[6] Bachtrögler-Unger J., Holzner M.; et. al. (2020). Overcoming the net position thinking in EU member states. WIFO; wiiw. URL: https://miwi-institut.de/archives/544
[7] A similar cost-benefit analysis was already conducted by the author in: Kofner Y. (2020). Who wins and who loses from the Eurasian Economic Union? MIWI Institute. URL: https://miwi-institut.de/archives/534
[8] WITS UN Comtrade Database (2021). URL: https://wits.worldbank.org/
[9] OECD-WTO Balanced Trade in Services dataset (BaTIS) (2021). URL: http://www.oecd.org/sdd/its/balanced-trade-statistics.htm
[10] ITC (2021). Investment Map. URL: https://www.investmentmap.org/investment/time-series-by-country
[11] Banco Central do Brasil (2021). Statistics. URL: https://www.bcb.gov.br/en/statistics
[12] World Bank (2021). Migration and Remittances Data. URL: https://www.worldbank.org/en/topic/migrationremittancesdiasporaissues/brief/migration-remittances-data
[13] Estimates by the author using World Bank Data. Measured in constant 2010 US dollars.
[14] For an excellent presentation on this issue: Kooths S. (2021). Mythos Außenbeitrag – Wie ein Saldo die Wirtschaftspolitik verwirrt. BSP Business School Berlin. URL: https://www.kooths.de/download/presentations/2021-01-28-kooths_BSP-Vorlesungsmarathon-Aussenbeitrag.pdf
[15] Kofner Y. (2020). Is the Belarussian trade deficit with Russia really so bad? MIWI Institute. URL: https://miwi-institut.de/archives/385