_ Yuri Kofner, junior economist, MIWI – Institute for Market Integration and Economic Policy. Munich, 26 February 2021.
Introduction
On 1 January 2021, the African Continental Free Trade Area (AfCFTA) partially began operation. It is the largest free trade area in the world in terms of the number of participating countries. The agreement was brokered by the African Union (AU) and connects 1.3 billion people across 54 of the 55 African countries with a combined gross domestic product (GDP) valued at USD 3.4 trillion (almost 3 percent of global GDP).[1]
The agreement initially requires members to remove tariffs from 90 percent of goods, allowing free access to commodities, goods, and partially services across the continent.[2]
In the short run, the United Nations Economic Commission for Africa estimates a strong positive effect, in that the agreement will boost intra-African trade by 52 percent by 2022.[3] And according to a recent study by the World Bank, the AfCFTA will also have a substantial long-term effect by boosting Africa’s total income by USD 450 billion by 2035 (a gain of 7 percent) and increase Africa’s exports by USD 560 billion, mostly in manufacturing. As a result, the agreement could lift 30 million Africans out of extreme poverty and boost the incomes of nearly 68 million others who live on less than USD 5.50 a day.[4]
Beyond a free trade area, the African Union has also the more than ambitious goal of creating a customs union[5] and even a monetary union with a single currency and an African central bank as early as 2023.[6]
Even before the COVID-crisis, in 2019 the governor of the Bank of Namibia Ipumbu Shiimi argued that the idea of a monetary union and single currency “was off the table” because it was unrealistic in the short- and middle term due to too significant macroeconomic disparities between the AU member states. Mr. Schiimi added that the single currency idea could be realized within the timeframe of the 2063 Agenda, i.e., in the long run.[7]
Methodology
The aim of this study is to estimate the potential trade and welfare effects of various stages of African economic integration: 1. the AfCFTA; 2. a potential AU customs union; and 3. a potential currency union. Special attention will be given to the question if the idea of introducing a single currency is viable from a trade (in goods) perspective.
In order to do this, the author will use a gravity trade model first developed by Anderson (1979)[8], and further augmented by Santos, Silva et Tenrenyo (2006)[9] on consistency with heteroskedasticity and accounting for zero trade flows; by Fally (2015)[10] on using fixed effects to match multilateral resistances consistent with structural terms; and by Anderson, Larch et Yotov (2015)[11] on using Poisson pseudo-maximum likelihood estimation (PPML). The latter also introduced a three-step estimation procedure with a baseline scenario, a counterfactual scenario, and a full endowment general equilibrium, – all of which will be applied in this simulation.
For the purposes of this model, the author constructed a new database, which includes data on bilateral manufactured goods trade flows for 169 countries in the year 2015, on bilateral population-weighted distance, a contiguity dummy, a common currency dummy, a dummy for being in a free trade area, and a dummy for being in a customs union based on four different datasets provided by the WTO[12], the CEPII[13], the United States International Trade Commission[14], and De Sousa (2014).[15]
One baseline scenario (status quo of trade flows) and three counterfactual scenarios were defined: Firstly, where 45 countries of the African Union[16] create a common free trade area; secondly, where they create a customs union; and thirdly, where they introduce a single common currency (Formula 1):
| (1) | Xij = exp(b1lnDISTij + b2CNTGij + b3BRDRij + b4_COMCURij + b5_RTAij + b6_CUij pi + cj) + eij |
Where Xij is merchandise trade flow trade flow from exporter i to importer j; DISTij is the population-weighted distance between i and j; CNTGij is a contiguity dummy; BRDRij is a border / international trade dummy; COMCURij is a dummy if the exporter i and importer j share a common currency; RTAij is a dummy if the exporter i and importer j are part of a free trade agreement; CUij is a dummy if the exporter i and importer j are part of a customs union; pi is the exporter fixed effects; cj is the importer fixed effects; eij is the error term.
The counterfactual scenarios are implemented by setting the respective dummies for the 45 analysed African countries from zero to one.
Results
According to the results of the gravity model and general equilibrium procedure, the creation of the African Continental Free Trade Area will increase total African exports by almost 18 percent and the total real GDP of the African continent by 1 percent. If the 45 African countries studied were to establish a customs union, their exports would increase by 25 percent. As a result, total real GDP of Africa would increase by 2 percent. However, adding a monetary union with single currency on top would increase exports from the African countries only by another 1 percent and the total African real gross domestic product only by another 0.1 percent.
On average, the AfCFTA will make every African citizen USD 53 richer (in terms of GDP per capita in constant USD). The creation of a customs union will double this amount to an increase of USD 100 per capita. Introducing a monetary union would only add another USD 3 per person on top.
The estimates show that African economic integration in terms of the AfCFTA and up to creating a customs union would be advisable. However, the relatively small economic benefit of introducing a single currency in Africa is unlikely to outweigh the likely costs of such a monetary union, e.g. the fixed exchange rates and the loss of national sovereignty over monetary policy – especially between the African countries, which have very divergent and fluctuating macroeconomic parameters.
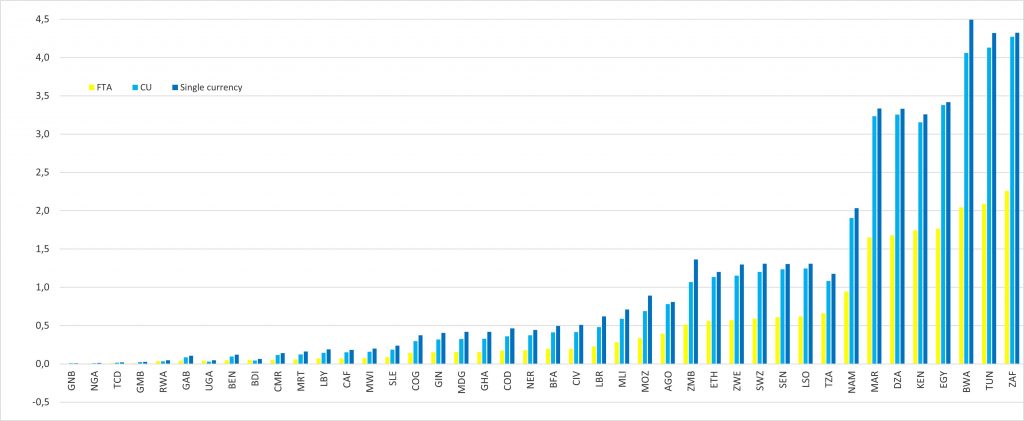
In terms of real GDP increase, the following African nations would benefit the most from economic integration within the African Union: Namibia, Morocco, Algeria, Kenya, Egypt, Botswana, Tunisia, and, especially, South Africa. Their real gross domestic product will increase by 1 to 2.3 percent from the AfCFTA; by 2 to 4.3 percent from a customs union; and by 2 to 4.5 percent from a customs union in pair with a single currency area.
Interestingly, the simulation shows that Nigeria, which for a long time opposed signing the African continental free trade agreement over concerns that it would hurt local manufacturers and entrepreneurs[17], would indeed gain the second least from African integration (after Guinea-Bissau). All stages of African integration would increase Nigerian real GDP by only 0.01 percent. Therefore, in order to interest the Nigerian Federal Republic, which makes up one fifth of the continent’s economy and has a population of 200 million people, to participate in a further deepening of integration, all AU member states should identify potential areas of trade and economic cooperation that would bring tangible economic benefits to the country. These could include, for example, joint projects on transport infrastructure, industrial cooperation and digitization, an agreement on labour migration, as well as generous phasing-in periods for trade liberalization.
Chart 1. Export change from African integration (in percent)
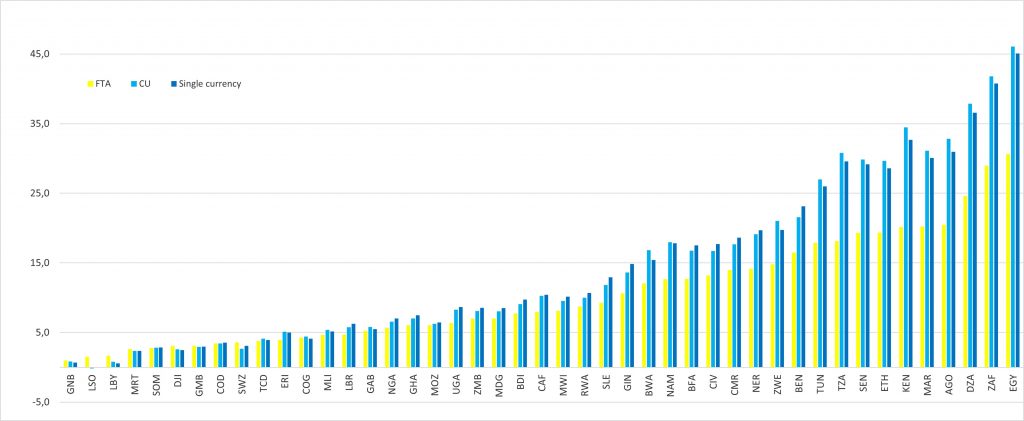
Source: Estimates by the author; FTA: free trade area, CU: customs union.
Chart 2. Real welfare change in manufacturing from African integration (in percent)
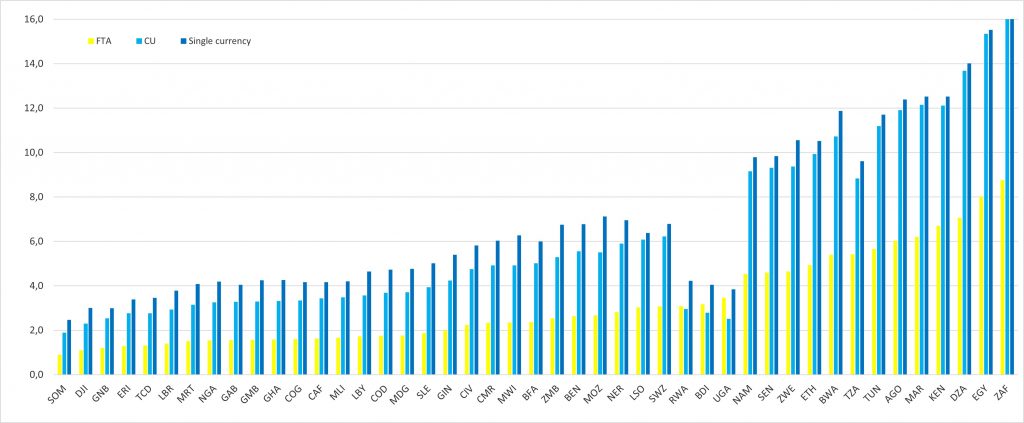
Source: Estimates by the author; FTA: free trade area, CU: customs union.
Chart 3. Real GDP change from African integration (in percent)
Source: Estimates by the author; FTA: free trade area, CU: customs union.
Tab. 1. Export and real welfare change from African integration (in percent)
| Export change | Real welfare change in manufacturing | |||||
| FTA | CU | Single currency | FTA | CU | Single currency | |
| AGO | 20.4 | 32.8 | 31.0 | 6.0 | 11.9 | 12.4 |
| BDI | 7.7 | 9.1 | 9.7 | 3.2 | 2.8 | 4.0 |
| BEN | 16.5 | 21.6 | 23.1 | 2.6 | 5.6 | 6.8 |
| BFA | 12.7 | 16.8 | 17.5 | 2.4 | 5.0 | 6.0 |
| BWA | 12.0 | 16.8 | 15.4 | 5.4 | 10.7 | 11.9 |
| CAF | 8.0 | 10.3 | 10.4 | 1.6 | 3.4 | 4.2 |
| CIV | 13.2 | 16.7 | 17.7 | 2.2 | 4.8 | 5.8 |
| CMR | 14.0 | 17.7 | 18.6 | 2.3 | 4.9 | 6.0 |
| COD | 3.4 | 3.4 | 3.6 | 1.8 | 3.7 | 4.7 |
| COG | 4.3 | 4.4 | 4.1 | 1.6 | 3.3 | 4.2 |
| DJI | 3.1 | 2.6 | 2.5 | 1.1 | 2.3 | 3.0 |
| DZA | 24.6 | 37.9 | 36.6 | 7.1 | 13.7 | 14.0 |
| EGY | 30.6 | 46.1 | 45.1 | 8.0 | 15.4 | 15.5 |
| ERI | 3.9 | 5.1 | 5.0 | 1.3 | 2.8 | 3.4 |
| ETH | 19.3 | 29.7 | 28.6 | 4.9 | 9.9 | 10.5 |
| GAB | 5.3 | 5.8 | 5.5 | 1.6 | 3.3 | 4.0 |
| GHA | 6.1 | 7.0 | 7.5 | 1.6 | 3.3 | 4.3 |
| GIN | 10.6 | 13.6 | 14.9 | 2.0 | 4.2 | 5.4 |
| GMB | 3.1 | 2.9 | 3.0 | 1.6 | 3.3 | 4.2 |
| GNB | 1.0 | 0.8 | 0.7 | 1.2 | 2.5 | 3.0 |
| KEN | 20.1 | 34.5 | 32.7 | 6.7 | 12.1 | 12.5 |
| LBR | 4.7 | 5.8 | 6.3 | 1.4 | 2.9 | 3.8 |
| LBY | 1.7 | 0.8 | 0.6 | 1.7 | 3.6 | 4.6 |
| LSO | 1.5 | -0.2 | 0.0 | 3.0 | 6.1 | 6.4 |
| MAR | 20.2 | 31.1 | 30.1 | 6.2 | 12.2 | 12.5 |
| MDG | 7.0 | 8.0 | 8.5 | 1.8 | 3.7 | 4.8 |
| MLI | 4.6 | 5.4 | 5.2 | 1.7 | 3.5 | 4.2 |
| MOZ | 6.1 | 6.3 | 6.4 | 2.7 | 5.5 | 7.1 |
| MRT | 2.6 | 2.4 | 2.4 | 1.5 | 3.2 | 4.1 |
| MWI | 8.1 | 9.5 | 10.1 | 2.3 | 4.9 | 6.3 |
| NAM | 12.7 | 18.0 | 17.8 | 4.5 | 9.2 | 9.8 |
| NER | 14.2 | 19.1 | 19.7 | 2.8 | 5.9 | 7.0 |
| NGA | 5.7 | 6.6 | 7.0 | 1.6 | 3.3 | 4.2 |
| RWA | 8.7 | 10.0 | 10.7 | 3.1 | 3.0 | 4.2 |
| SEN | 19.3 | 29.8 | 29.1 | 4.6 | 9.3 | 9.8 |
| SLE | 9.3 | 11.8 | 12.9 | 1.9 | 3.9 | 5.0 |
| SOM | 2.8 | 2.8 | 2.9 | 0.9 | 1.9 | 2.5 |
| SWZ | 3.6 | 2.7 | 3.1 | 3.1 | 6.2 | 6.8 |
| TCD | 3.8 | 4.1 | 3.9 | 1.3 | 2.8 | 3.5 |
| TUN | 17.9 | 27.0 | 26.0 | 5.7 | 11.2 | 11.7 |
| TZA | 18.1 | 30.8 | 29.6 | 5.4 | 8.8 | 9.6 |
| UGA | 6.4 | 8.3 | 8.7 | 3.5 | 2.5 | 3.8 |
| ZAF | 29.0 | 41.8 | 40.8 | 8.8 | 16.6 | 16.8 |
| ZMB | 7.0 | 8.1 | 8.6 | 2.5 | 5.3 | 6.8 |
| ZWE | 14.8 | 21.0 | 19.7 | 4.6 | 9.4 | 10.6 |
Source: Estimates by the author; FTA: free trade area, CU: customs union.
Tab. 2. Real GDP and GDP per capita change from African integration
| Real GDP change (in percent) | GDP per capita change (in constant USD) | |||||
| FTA | CU | Single currency | FTA | CU | Single currency | |
| AGO | 0.4 | 0.8 | 0.8 | 12.3 | 24.2 | 25.2 |
| BDI | 0.1 | 0.0 | 0.1 | 0.1 | 0.1 | 0.1 |
| BEN | 0.0 | 0.1 | 0.1 | 0.6 | 1.2 | 1.5 |
| BFA | 0.2 | 0.4 | 0.5 | 1.6 | 3.4 | 4.1 |
| BWA | 2.0 | 4.1 | 4.5 | 165.4 | 328.4 | 363.6 |
| CAF | 0.1 | 0.2 | 0.2 | 0.3 | 0.6 | 0.7 |
| CIV | 0.2 | 0.4 | 0.5 | 3.4 | 7.2 | 8.8 |
| CMR | 0.1 | 0.1 | 0.1 | 0.8 | 1.8 | 2.2 |
| COD | 0.2 | 0.4 | 0.5 | 0.7 | 1.5 | 2.0 |
| COG | 0.1 | 0.3 | 0.4 | 3.1 | 6.5 | 8.1 |
| DJI | – | – | – | – | – | – |
| DZA | 1.7 | 3.3 | 3.3 | 78.9 | 152.9 | 156.6 |
| EGY | 1.8 | 3.4 | 3.4 | 53.2 | 101.7 | 102.9 |
| ERI | – | – | – | – | – | – |
| ETH | 0.6 | 1.1 | 1.2 | 3.4 | 6.8 | 7.2 |
| GAB | 0.0 | 0.1 | 0.1 | 3.8 | 8.0 | 9.9 |
| GHA | 0.2 | 0.3 | 0.4 | 2.9 | 6.2 | 7.9 |
| GIN | 0.2 | 0.3 | 0.4 | 1.4 | 2.9 | 3.7 |
| GMB | 0.0 | 0.0 | 0.0 | 0.1 | 0.2 | 0.2 |
| GNB | 0.0 | 0.0 | 0.0 | 0.0 | 0.1 | 0.1 |
| KEN | 1.7 | 3.2 | 3.3 | 21.6 | 39.0 | 40.3 |
| LBR | 0.2 | 0.5 | 0.6 | 1.2 | 2.5 | 3.2 |
| LBY | 0.1 | 0.1 | 0.2 | 5.7 | 11.9 | 15.5 |
| LSO | 0.6 | 1.2 | 1.3 | 8.4 | 16.9 | 17.7 |
| MAR | 1.7 | 3.2 | 3.3 | 56.1 | 109.8 | 113.2 |
| MDG | 0.2 | 0.3 | 0.4 | 0.8 | 1.6 | 2.1 |
| MLI | 0.3 | 0.6 | 0.7 | 2.2 | 4.7 | 5.6 |
| MOZ | 0.3 | 0.7 | 0.9 | 2.0 | 4.1 | 5.2 |
| MRT | 0.1 | 0.1 | 0.2 | 1.0 | 2.2 | 2.8 |
| MWI | 0.1 | 0.2 | 0.2 | 0.4 | 0.8 | 1.0 |
| NAM | 0.9 | 1.9 | 2.0 | 54.4 | 109.7 | 117.3 |
| NER | 0.2 | 0.4 | 0.4 | 1.0 | 2.1 | 2.5 |
| NGA | 0.0 | 0.0 | 0.0 | 0.1 | 0.3 | 0.3 |
| RWA | 0.0 | 0.0 | 0.0 | 0.3 | 0.3 | 0.4 |
| SEN | 0.6 | 1.2 | 1.3 | 9.6 | 19.6 | 20.7 |
| SLE | 0.1 | 0.2 | 0.2 | 0.4 | 0.9 | 1.2 |
| SOM | – | – | – | – | – | – |
| SWZ | 0.6 | 1.2 | 1.3 | 28.6 | 57.7 | 63.0 |
| TCD | 0.0 | 0.0 | 0.0 | 0.1 | 0.1 | 0.2 |
| TUN | 2.1 | 4.1 | 4.3 | 91.9 | 181.8 | 190.2 |
| TZA | 0.7 | 1.1 | 1.2 | 6.5 | 10.6 | 11.6 |
| UGA | 0.0 | 0.0 | 0.0 | 0.4 | 0.3 | 0.5 |
| ZAF | 2.3 | 4.3 | 4.3 | 165.8 | 313.9 | 317.6 |
| ZMB | 0.5 | 1.1 | 1.4 | 8.5 | 17.7 | 22.5 |
| ZWE | 0.6 | 1.2 | 1.3 | 6.8 | 13.6 | 15.4 |
Source: Estimates by the author; FTA: free trade area, CU: customs union.
Notes
[1] African Union (2021). The AfCFTA Start of Trading Ceremony Webinar. URL: https://au.int/en/newsevents/20210101/afcfta-start-trading-ceremony-webinar
[2] Forty-four African countries sign a free-trade deal”. The Economist. March 22, 2018.
[3] Witschge, Loes (March 20, 2018). “African Continental Free Trade Area: What you need to know”. Al-Jazeera.
[4] World Bank (2020). Welfare effects of the African Continental Free Trade Area. URL: https://miwi-institut.de/archives/279
[5] African Union (2021). CFTA – Continental Free Trade Area. URL: https://au.int/en/ti/cfta/about
[6] African Union (2021). Key Transformational Outcomes of Agenda 2063. URL: https://au.int/en/agenda2063/outcomes
[7] Bundesbank, MIWI Institute (2019). European experience for monetary policy and macroeconomic integration. URL: https://miwi-institut.de/archives/164
[8] Anderson, J. E. (1979). A Theoretical Foundation for the Gravity Equation. The American Economic Review, 69(1), 106–116.
[9] Santos Silva, J. M. C. & Tenreyro, S. (2006). The log of gravity. The Review of Economics and Statistics, 88(4), 641–658.
[10] Fally, T. (2015). Structural gravity and fixed effects. Journal of International Economics, 97, 76–85.
[11] Anderson, J. E., Larch, M. & Yotov, Y. V. (2015). Estimating General Equilibrium Trade Policy Effects: GE PPML. LeBow College of Business, Drexel University School of Economics Working Paper Series, WP 2016–06, 1–24.
[12] Monteiro, Jose-Antonio (2020), “Structural Gravity Dataset of Manufacturing Sector: 1980-2016″, World Trade Organization, Geneva.
[13] Head, K. and T. Mayer, (2014), “Gravity Equations: Toolkit, Cookbook, Workhorse.”Handbook of International Economics, Vol. 4,eds. Gopinath, Helpman, and Rogoff, Elsevier.
[14] Borchert, I., Larch, M., Shikher, S., and Yotov, Y. (2020), “The International Trade and Production Database for Estimation (ITPD-E)”, International Economics, forthcoming.; Tamara Gurevich and Peter Herman, (2018). The Dynamic Gravity Dataset: 1948-2016. USITC Working Paper 2018-02-A.
[15] De Sousa, J. (2012). The currency union effect on trade is decreasing over time. Economics Letters, 117(3), 917-920.
[16] Complete data was available for only 45 of the 55 member states of the African Union.
[17] AfricaNews (2018). Nigeria’s Buhari explains failure to sign continental free trade agreement. URL: https://www.africanews.com/2018/03/23/nigeria-s-buhari-explains-failure-to-sign-continental-free-trade-agreement//
One comment