_ Yuri Kofner, junior economist, MIWI – Institute for Market Integration and Economic Policy. Munich, 08 March 2021.
With the signing of RCEP (Regional Comprehensive Economic Partnership) in November 2020, the largest free trade area in the world will be created in the Asia-Pacific region. The proposed trade agreement includes 15 East Asian countries (ASEAN, China, Japan, Korea, Australia, and New Zealand), which account for almost a third of world economic output, world trade and the world’s population.
The RCEP free trade agreement is the Chinese response to the failed TPP (Trans-Pacific Partnership) agreement of 2016, which was terminated just a few days after Donald Trump took office. China seized the opportunity and plunged into the resulting power vacuum to wrap a mega-deal without American involvement.
The RCEP agreement between 14 Asia-Pacific countries and China is putting the EU under pressure to act. “The EU should strengthen its trade relations with Asian partners,” recently advised ifo economists Teti et Hildenbrand (2021).[1] Their paper also describes in more detail the content and history of the agreement, as well as intra-RCEP trade structure.
Methodology
Thus, the aim of the following study is to estimate the potential trade and welfare effects of both the RCEP FTA and a potential free trade agreement between the EU and RCEP.
In order to do this, the author will use a gravity trade model first developed by Anderson (1979)[2], and further augmented by Santos, Silva et Tenrenyo (2006)[3] on consistency with heteroskedasticity and accounting for zero trade flows; by Fally (2015)[4] on using fixed effects to match multilateral resistances consistent with structural terms; and by Anderson, Larch et Yotov (2015)[5] on using Poisson pseudo-maximum likelihood estimation (PPML). The latter also introduced a three-step estimation procedure with a baseline scenario, a counterfactual scenario, and a full endowment general equilibrium, – all of which will be applied in this simulation.
For the purposes of this model, the author constructed a new database, which includes data on bilateral manufactured goods trade flows for 169 countries in the year 2015, on bilateral population-weighted distance, a contiguity dummy, a common currency dummy, a dummy for being in a free trade area, and a dummy for being in a customs union based on four different datasets provided by the WTO[6], the CEPII[7], the United States International Trade Commission[8], and De Sousa (2014).[9]
One baseline scenario (status quo of trade flows) and two counterfactual scenarios were defined: Where the East Asian countries create the RCEP free trade area; secondly, where the EU and the RCEP countries create a free trade area (Formula 1):
|
(1) |
Xij = exp(b1lnDISTij + b2CNTGij + b3BRDRij + b4_COMCURij + b5_RTAij + b6_RTAplusij + b7_CUij + pi + cj) + eij |
Where Xij is merchandise trade flow trade flow from exporter i to importer j; DISTij is the population-weighted distance between i and j; CNTGij is a contiguity dummy; BRDRij is a border / international trade dummy; COMCURij is a dummy if the exporter i and importer j share a common currency; RTAij is a dummy if the exporter i and importer j are part of a simple free trade agreement; RTAplusij is a dummy if the exporter i and importer j are part of a deep free trade agreement CUij is a dummy if the exporter i and importer j are part of a customs union; pi is the exporter fixed effects; cj is the importer fixed effects; eij is the error term.
The counterfactual scenarios are implemented by setting the respective dummy for a simple FTA for the RCEP and RCEP-EU countries from zero to one. In other words, the simulation takes the global average effect of being in free trade area and applies it to the RCEP and RCEP-EU countries.
Results
According to the results of the gravity model and general equilibrium procedure, the Regional Comprehensive Economic Partnership will have a significant positive welfare effect on the participating East Asian countries. The biggest winners of the free trade agreement are Korea, Singapore, Vietnam and China: their real GDP could be boosted by 9.4, 11.5, 13.1 and even 20.6 percent. The real GDP of the two developing nations of Laos and Cambodia could increase by 1.4 and 3.2 percent respectively, making each Lao and Cambodian citizen richer by 26 and 41 UDS respectively (in terms of GDP per capita in constant USD).
In turn, the trade aversion effects of the RCEP agreement will decrease the real gross domestic product of the EU by 0.1 percent on average.
Chart 1. Real GDP change from RCEP FTA (in percent)
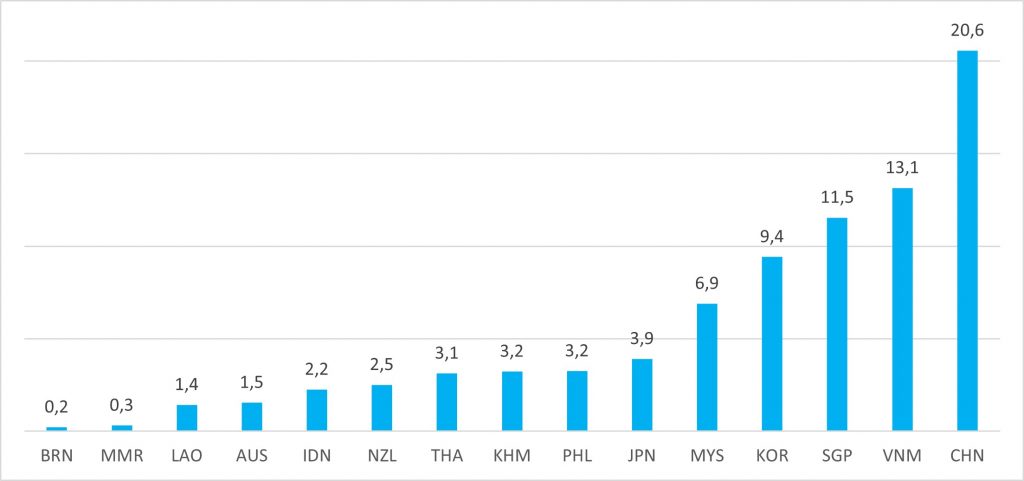 Source: Estimates by the author. MIWI Institute.
On the contrary, implementing a free trade agreement between the EU with the RCEP countries, as suggested by the ifo Institute, would increase the European Union GDP by 0.3 percent. The new member states of the EU would gain most from this free trade agreement with Asia: the respective real GDP of Hungary, the Czech Republic, Slovakia, Lithuania, and Estonia would increase by 0.7 to 1.1 percent. The real GDP of France, Germany and Italy would increase by 0.1 to 0.3 percent.
Chart 2. Real GDP change from additional RCEP – EU FTA (in percent)
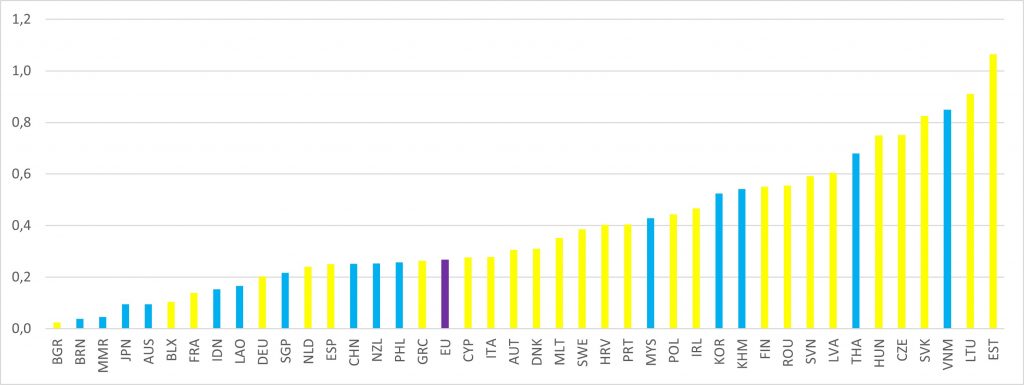 Source: Estimates by the author. MIWI Institute.
Interestingly, the simulation results show that the EU-RCEP FTA seems to have a much less significant trade and welfare effect than the RCEP agreement itself, – especially on the participating East Asian countries. E.g. the EU-RCEP free trade agreement would increase Vietnam’s real GDP by another 0.8 percent, that of China only by another 0.3 percent.
Tab. 1. Real GDP change from RCEP and potential RCEP-EU FTA (in percent)
|
RCEP |
RCEP-EU FTA |
||||||
|
AUS |
1.5 |
AUS |
0.1 |
AUT |
0.3 |
ITA |
0.3 |
|
BRN |
0.2 |
BRN |
0.0 |
BLX |
0.1 |
LTU |
0.9 |
|
CHN |
20.6 |
CHN |
0.3 |
BGR |
0.0 |
LVA |
0.6 |
|
IDN |
2.2 |
IDN |
0.2 |
CYP |
0.3 |
MLT |
0.4 |
|
JPN |
3.9 |
JPN |
0.1 |
CZE |
0.8 |
NLD |
0.2 |
|
KHM |
3.2 |
KHM |
0.5 |
DEU |
0.2 |
POL |
0.4 |
|
KOR |
9.4 |
KOR |
0.5 |
DNK |
0.3 |
PRT |
0.4 |
|
LAO |
1.4 |
LAO |
0.2 |
ESP |
0.3 |
ROU |
0.6 |
|
MMR |
0.3 |
MMR |
0.0 |
EST |
1.1 |
SVK |
0.8 |
|
MYS |
6.9 |
MYS |
0.4 |
FIN |
0.6 |
SVN |
0.6 |
|
NZL |
2.5 |
NZL |
0.3 |
FRA |
0.1 |
SWE |
0.4 |
|
PHL |
3.2 |
PHL |
0.3 |
GRC |
0.3 |
EU |
0.3 |
|
SGP |
11.5 |
SGP |
0.2 |
HRV |
0.4 |
||
|
THA |
3.1 |
THA |
0.7 |
HUN |
0.7 |
||
|
VNM |
13.1 |
VNM |
0.8 |
IRL |
0.5 |
||
Source: Estimates by the author. MIWI Institute.
Tab. 2. GDP per capita change from RCEP and potential RCEP-EU FTA (in constant USD)
|
RCEP |
RCEP-EU FTA |
||||||
|
AUS |
877 |
AUS |
54 |
AUT |
154 |
ITA |
99 |
|
BRN |
66 |
BRN |
12 |
BLX |
49 |
LTU |
169 |
|
CHN |
1698 |
CHN |
21 |
BGR |
2 |
LVA |
101 |
|
IDN |
100 |
IDN |
7 |
CYP |
88 |
MLT |
102 |
|
JPN |
1919 |
JPN |
47 |
CZE |
182 |
NLD |
133 |
|
KHM |
41 |
KHM |
7 |
DEU |
96 |
POL |
77 |
|
KOR |
2700 |
KOR |
150 |
DNK |
204 |
PRT |
99 |
|
LAO |
26 |
LAO |
3 |
ESP |
84 |
ROU |
67 |
|
MMR |
5 |
MMR |
1 |
EST |
222 |
SVK |
173 |
|
MYS |
860 |
MYS |
54 |
FIN |
272 |
SVN |
162 |
|
NZL |
974 |
NZL |
99 |
FRA |
61 |
SWE |
223 |
|
PHL |
108 |
PHL |
9 |
GRC |
63 |
||
|
SGP |
6790 |
SGP |
127 |
HRV |
66 |
||
|
THA |
202 |
THA |
44 |
HUN |
132 |
||
|
VNM |
274 |
VNM |
18 |
IRL |
371 |
||
Source: Estimates by the author. MIWI Institute.
Notes
[1] Teti F., Hildenbrand H.M. (2021). RCEP, die größte Freihandelszone der Welt: Was beinhaltet der Mega-Deal, und mit welchen Auswirkungen ist zu rechnen? ifo Institut. URL: https://www.ifo.de/publikationen/2021/aufsatz-zeitschrift/rcep-die-groesste-freihandelszone-der-welt-was-beinhaltet
[2] Anderson, J. E. (1979). A Theoretical Foundation for the Gravity Equation. The American Economic Review, 69(1), 106–116.
[3] Santos Silva, J. M. C. & Tenreyro, S. (2006). The log of gravity. The Review of Economics and Statistics, 88(4), 641–658.
[4] Fally, T. (2015). Structural gravity and fixed effects. Journal of International Economics, 97, 76–85.
[5] Anderson, J. E., Larch, M. & Yotov, Y. V. (2015). Estimating General Equilibrium Trade Policy Effects: GE PPML. LeBow College of Business, Drexel University School of Economics Working Paper Series, WP 2016–06, 1–24.
[6] Monteiro, Jose-Antonio (2020), “Structural Gravity Dataset of Manufacturing Sector: 1980-2016″, World Trade Organization, Geneva.
[7] Head, K. and T. Mayer, (2014), “Gravity Equations: Toolkit, Cookbook, Workhorse.”Handbook of International Economics, Vol. 4,eds. Gopinath, Helpman, and Rogoff, Elsevier.
[8] Borchert, I., Larch, M., Shikher, S., and Yotov, Y. (2020), “The International Trade and Production Database for Estimation (ITPD-E)”, International Economics, forthcoming.; Tamara Gurevich and Peter Herman, (2018). The Dynamic Gravity Dataset: 1948-2016. USITC Working Paper 2018-02-A.
[9] De Sousa, J. (2012). The currency union effect on trade is decreasing over time. Economics Letters, 117(3), 917-920.