_ Yuri Kofner, economist, MIWI Institute. Munich, 4 January 2023.
“I categorically deny that a strong expansion should by law be associated with a general increase in prices.”
– Ludwig Erhard (1964).[1]
Introduction
In January 2022, the Deutsche Bundesbank published a table with the full purchasing power equivalents of historical amounts in German currencies from 1810 to 2021.[2] It shows, for example, that in 1871 a southern German thaler was worth 24.1 euros at 2021 prices.
Purchasing power equivalents were calculated using a comprehensive approach based on a representative ‘shopping basket’ of all goods and services purchased by households for current consumption purposes.
Although the Bundesbank emphasizes the uncertainties and limited informative value of these estimates, they provide a very interesting insight into Germany’s monetary and economic history.
In the first part of this analysis, I will give a brief overview and comment on this purchasing power time series (Chart 1). In the second part, I will use the data to create a time series of annual consumer price inflation from 1873 to 2023.[3] In the third part I will give interpretations of various interesting monetary aspects of the history of inflation in Germany.
Depreciation of German currencies between 1873 and 2023
Chart 1. Purchasing power loss of German currencies (1873-2023, in euros from 2021)
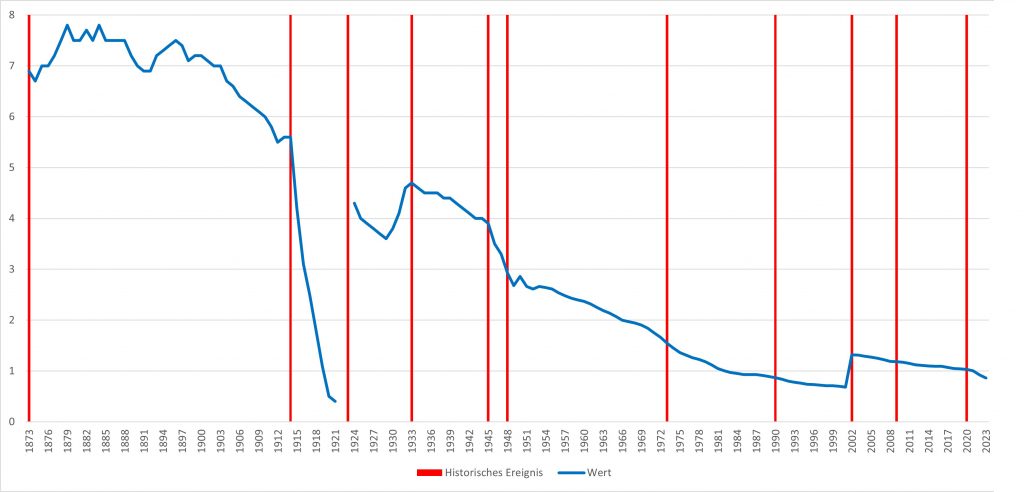
Source: Own representation based on Bundesbank (2022) and IMF (2022). Note: Historical event (red), value (blue).
The data from the Bundesbank, as shown in chart 1, clearly shows the loss of purchasing power of German currencies over time. While a gold-based mark in the Wilhelminian Empire was worth between 7 and 8 euros from the founding of the empire in 1871, it began to lose value relatively quickly from 1903 onwards.
After the detachment of the mark from the gold standard in 1914, coupled with immense national debt to finance military spending in the First World War, the value of the mark devalued radically, which erupted in the hyperinflation of 1923 (due to the insanely high inflation rates they are not shown in the table / chart for 1922 / 23).
Thanks to the introduction of the Rentenmark in November 1923 and the gold-core-based Reichsmark (1 RM = 4.2 gold-backed USD) in 1924 by Gustav Stresemann and Hjalmar Schacht, monetary value stabilized somewhat in the “Stresemann era” of the Weimar Republic. The global economic crisis of 1929 and the deflation that followed can be clearly seen in the increase in purchasing power of the RM.
In the Nazi planned economy (1933-1945) there was only a gradual depreciation of the Reichsmark, which is not meaningful due to the ubiquitous price controls, the financing trick of the Mefo bills (introduced by the same Hjalmar Schacht),[4] forced labour and wartime requisitions.
The drastic depreciation after the defeat in 1945 was only stopped by the currency reform of Ludwig Erhard: In 1948 he introduced the D-Mark based on a fixed exchange rate to the gold-based USD (as part of the Bretton Woods system) and, more importantly, he lifted all price controls without prior consent of the western occupying powers – one of the main factors in the “German economic miracle” of the 1950s and 1960s.[5]
In the further history of the Federal Republic of Germany, the decline in purchasing power of the currency was more or less gradual, accelerated somewhat by the first oil crisis (1973), reunification (1990) and the corona restrictions coupled with massive fiscal and monetary expansion (2020). Interestingly, for the oil crisis and reunification, the accelerated depreciation can actually be seen in the data a few years earlier – from 1968 and 1987 respectively. The introduction of the euro in 2002 can be seen in the data and charts as a nominal doubling of the currency value.
Annual consumer price inflation between 1873 and 2023
Methodology
Using the purchasing power time series provided by the Bundesbank, a time series of annual consumer price inflation in Germany from 1873 to 2023 can be calculated (Formula 1):
Formula 1
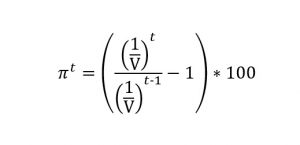
where pt is the annual consumer price inflation in year t and V is the purchasing power of the respective German currency in euros from 2021.
To verify the accuracy of this methodology, I compared the results with data on annual consumer price inflation from 1950 to 2022 from the Federal Statistical Office (Destatis).[6] It shows that the Bundesbank’s purchasing power data and my methodology are quite meaningful as the difference between my results and the Destatis data has a median of -0.04 and a mode of 0.
In further steps I corrected the one outlier for 2002, where the introduction of the euro (DM 1.96 was exchanged for 1 euro) would have resulted in an unreal annual deflation of 48.5 percent. The actual CPI this year was 1.3 percent. I’ve also added the inflation forecasts for 2022 and 2023 provided by the International Monetary Fund.[7]
Chart 2. Annual consumer price inflation rate of German currencies (1873-2023, percent change compared to same period last year)
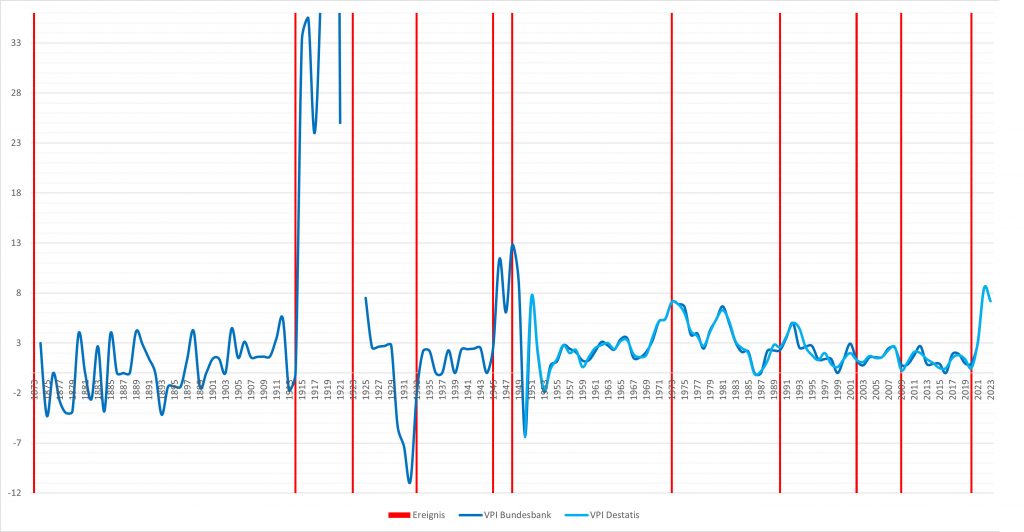 Source: Own illustration based on Bundesbank (2022), Destatis (2022) and IMF (2022).
In chart 2 one can see how well the inflation rate estimates based on the Bundesbank data (dark blue line) match the inflation rate data from Destatis (light blue line, from 1950 onwards).
Interpretation of the inflation history of German currencies between 1873 and 2023
Due to a mixture of various inflationary factors – energy transition, Western sanctions, expansive monetary policy, CO2 pricing, unloading of previously pent-up consumer spending after the corona restrictions were lifted – the inflation rate in Germany jumped to a historic high of 8.5 percent in 2022.[8] This was the highest level since post-war inflation peaked in 1948 at 12.8 percent.
Goldmark and the Wilhelmine economic miracle
After the unification of the empire by Otto von Bismarck, Germany experienced phenomenal economic growth. It became a leader in the electrical industry, mechanical engineering, precision mechanics, optics and the chemical industry. For example, in the paint industry and in pharmacy, German stock corporations had a world monopoly. Its progressive welfare state, education system and research were admired around the world. Economists call it the “Wilhelminian economic miracle”.[9]
Despite rapid growth rates of the gross national product (2.7 percent annually on average),[10] the inflation rates (0.8 percent annually on average) of the gold-based mark in the Wilhelminian Empire were even lower than in the fiat-based euro phase (2002-2019) with low inflation (1.4 percent on an annual average) but also creeping economic growth (1.3 percent on an annual average).[11]
This comparison suggests that rapid economic growth does not necessarily have to lead to a price gallop – as long as the economic order is liberal, the money supply limited and the currency is stable, e.g., through the gold standard.
Table 1. Economic growth and inflation in the German Empire (1973-1913, in percent)
| 1873-1879 | 1880-1889 | 1890-1889 | 1900-1913 | 1873-1913 | |
| Average annual change in gross national product | 2.1 | 2.8 | 3.0 | 3.7 | 2.7 |
| Average annual rate of inflation or deflation | -2.0 | 0.8 | 0.0 | 1.8 | 0.6
|
Source: Deutsche Bundesbank (2022) and Burhop C. (2011).
The first 12 years after the founders’ crash (Gründerkrach) in 1873 were even characterized by deflation (-2 to -1.1 percent on average over the year), although GDP per capita grew by an average of 1.3 percent per year, which shows that deflation does not necessarily follow consumption backlog, unemployment and political turmoil. In fact, the Austrian school favours deflation over inflation[12] and criticizes the 2 percent inflation target of contemporary mainstream economics.[13]
War economy and hyperinflation
The experience of hyperinflation is still deep in the subconscious of the German national psyche. Although it peaked in 1923, the data in Chart 2 shows that the period of extremely high consumer price inflation began directly with the decoupling of the mark from the gold standard in 1914 and the debt financing of the First World War effort. Between 1913 and 1918, the Reich’s debts rose from 4.8 billion to 105 billion marks,[14] i.e., from 27 billion to 189 billion euros measured in terms of 2021 purchasing power. During the five years of war the prices for consumer goods and services in the empire therefore rose by a third each year.
The turmoil of the first years of the Weimar Republic was characterized by an extremely deficit Reich budget, high war debts (105 billion marks or 189 billion euros according to purchasing power of 2021), increased social spending for veterans, widows and orphans, cessions of territory and reparation claims according to the Versailles Treaty – 223 billion gold marks at the beginning (1,245 billion euros according to purchasing power of 2021 or over a third of German GDP in 2021).[15] These burdens of the lost war erupted in skyrocketing annual price increases from 64 percent in 1919 to 120 percent in 2020 to 1 billion percent in November 2023.
The miracle of the Rentenmark
It must be the irony of fate that hyperinflation was stopped and relative monetary stability (2.7 percent on average annually in the years 1925 to 1928) was regained thanks to two measures and to two opposing statesmen: Both thanks to Erzberger’s far-reaching tax reform – first and painful attempts to consolidate the Reich budget (doubling the tax rate from 8 percent in 1913 to 15 percent in 1925),[16] and also thanks to the Rentenmark, first proposed by Karl Helfferrich, whose rhetorical attacks led to the assassination of the same Matthias Erzberger in 1921.
The Rentenmark was psychologically effective because it was officially covered by a land charge of 6 percent of national industrial and agricultural property (which, in contrast to the real levies of the Reichsnotopfer of 1919 and the 1952 burden equalization, only existed on paper) and effective in fact because its issuance was strictly limited to 3.2 billion.
In 1924, the Reichsmark, which was linked to the Rentenmark and the US gold standard (RM 4.2 for USD 1), replaced the mark of the old German Empire. This further helped to stabilize the currency value.
Finally, that same year, the Reichsbank issued a brief but complete halt to new lending, an unprecedented measure—but it sent a strong signal.
Great Depression, financial tricks and forced economy
Between 1930 and 1933, consumer prices fell at an average annual rate of 6.4 percent. Modern proponents of Keynesian economics, such as Phillip Heimberger, blame the deflation in the wake of the Great Depression for the rise of Nazism in Germany, and use this argument avidly to warn against government spending cuts in today’s crises like the Corona “pandemic”.[17]
However, it would be wrong to define a monocausal reason for the establishment of the Nazi dictatorship. There were a variety of causes – not just economic. In terms of macroeconomic factors, it was a triple whammy of previous hyperinflation, which impoverished the German middle class,[18] Heinrich Brünig’s austerity policies,[19] and immense mass unemployment. Deflation was more of a side effect of the severe economic recession of -13 to -17 percent of GDP per capita in 1931-32, and the massive unemployment rate, which widened from 3.8 percent in 1925 to 43.8 percent in 1932 (Chart 3).
Figure 3. Annual GDP growth per capita and unemployment rate in Germany (1919-1960, in percent)
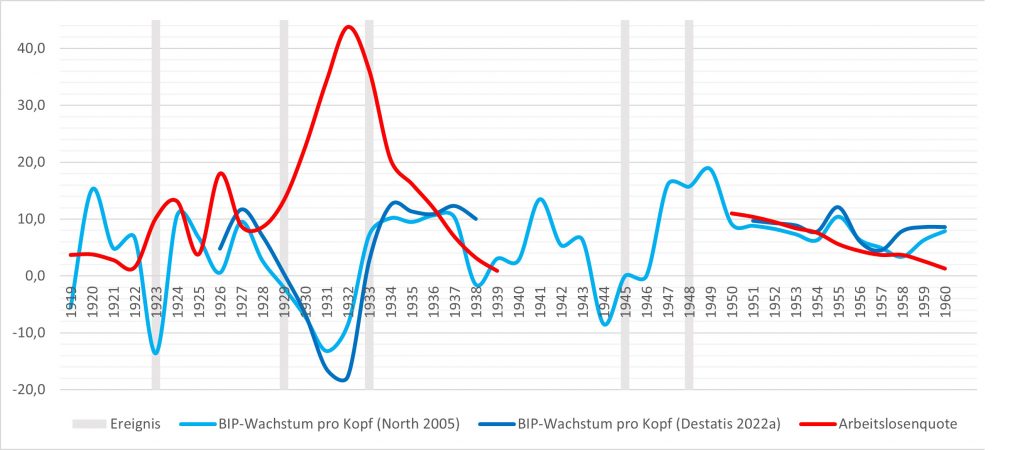
Source: Own representation based on Metz R. (2005),[20] Destatis (2022a), Destatis (2022b),[21] Sensch J. (2016).[22] Note: GDP per capita based on North (light blue), GDP per capita based on Destatis (dark blue), unemployment rate (red).
In addition, austerity measures from the Brünig era cannot be compared with modern demands for a return to the “lean state”. Unfortunately, Germany has already developed from a healthy, “athletic” welfare state (Sozialstaat) into an unhealthy, oversized welfare state (Wohlfahrtsstaat): in 1929, the state share was around 27 percent of GDP, the social insurance share was only 7.5 percent.[23] By 2021, the state ratio in Germany has doubled to 51.6 percent and social spending has almost tripled to 21.7 percent of economic output.
During the 1931 banking crash resulting from the Great Depression, the Reichsbank had to move away from the gold currency standard by effectively restricting the Reichsmark’s convertibility – a move in line with the other powers of the time.
The fact is that the first half of the Nazi regime, i.e., from 1933 to 1939, was characterized by a strong economic upswing (annual GDP growth rates of over 8 percent), a reduction in unemployment and low consumer price inflation of around 0.7 percent annually.
Despite the fiscally expansive job creation measures in the civil and armaments industries amounting to 10.1 billion RM in 1933 and 1934 (46.6 billion euros in purchasing power parity of 2021), the initially limited expansion of the money supply certainly played an important role to keep inflation down.[24]
But one must never forget that this boom arose from the bones of the national socialist planned economy: in 1933 the trade unions were dissolved, which formally made a wage-price spiral impossible. And in 1936 Hitler declared a general price freeze.[25]
Another factor was that by 1938 the official national debt was formally reduced by 44 percent. However, also with a sleight of hand called the Mefo bills, which accounted for almost two-thirds of the total Reich debt up to 1938, but was not counted as such in the balance sheets to circumvent the armaments limitation of the Versailles Treaty (chart 4).
Chart 4. Reich debt (1913-1945, in euros by purchasing power of 2021)
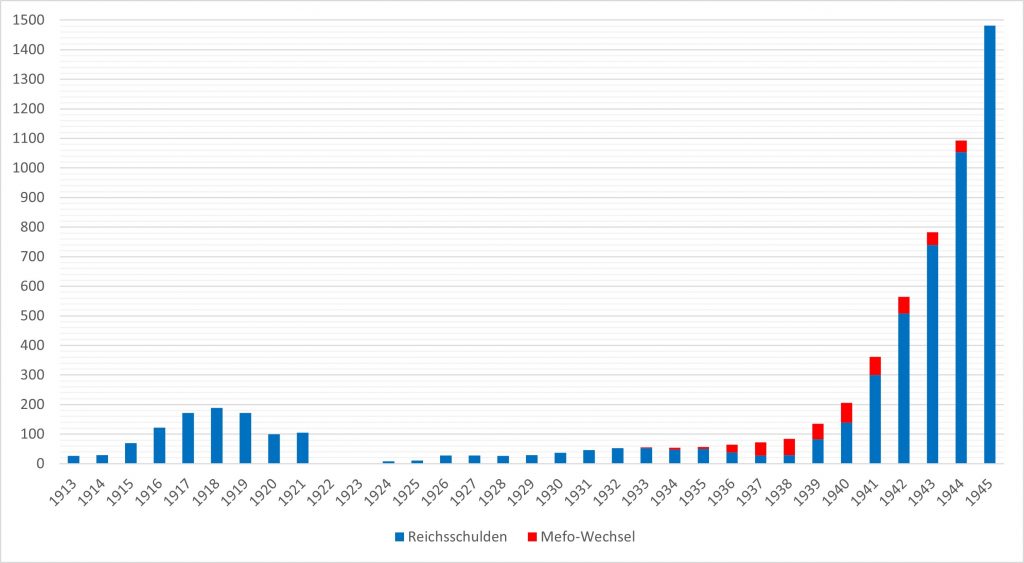
Source: Sensch J. (2009). Note: Reich debt (dark blue), Mefo debt (red).
When the first Mefo bill should have been repaid after 1938, the last semblance of currency and financial policy caution was thrown overboard instead in order to gear Germany completely towards an economy of destruction and war. By 1945 the national debt had risen to 380 billion RM (nearly 1.5 trillion euros in 2021 prices).
During the war years, the official rate of inflation was still low – about 2 percent annually. This picture is again distorted by price controls and wartime rationing. The actual devaluation of money became apparent on the growing black market, which can be seen from the fact that in the first three post-war years the average annual inflation rate was 10.1 percent.
In addition, inflation was partially “exported” to the occupied territories by forcing the subjugated national banks to accept so-called “Reichskreditkassenscheine” as payment from the occupiers.
Ordoliberal economic miracle
With the currency reform of 1948 and the liberalization of prices, the latter even without the prior consent of the allies, Ludwig Erhard was able to stop the high inflation of the post-war period. The now almost worthless Reichsmark was exchanged for D-Marks at a ratio of 10 to 0.65 or 10 to 1.
Confidence in the stability of the new currency was strengthened by the fact that under the Bretton Woods system (which the Federal Republic of Germany joined immediately after it was founded in 1949), the Deutsche Mark was pegged to the USD in a rate corridor of +/- 1 percent. The American dollar was not only the currency of the world’s leading (trade) power, but was yet again backed by gold.[26]
The 1950s and partly the 1960s were the founding years of the modern German social market economy based on ordoliberal principles, above all, according to Walter Eucken, the free price mechanism and currency stability.[27]
The result was the so-called “German economic miracle”. Despite renewed rapid economic growth rates of 8.2 percent in the 1950s and 4.4 percent in the 1960s, consumer price inflation was low at just 1.2 and 2.4 percent, respectively. This shows once again that economic prosperity can be achieved without currency debasement if it is based on market-liberal reforms.
The relatively restrained expansion of the money supply in the economy has certainly helped to limit price increases (Chart 5).
Chart 5. M3 money supply in Germany and the euro area in relation to GDP (1955-2021, in percent)
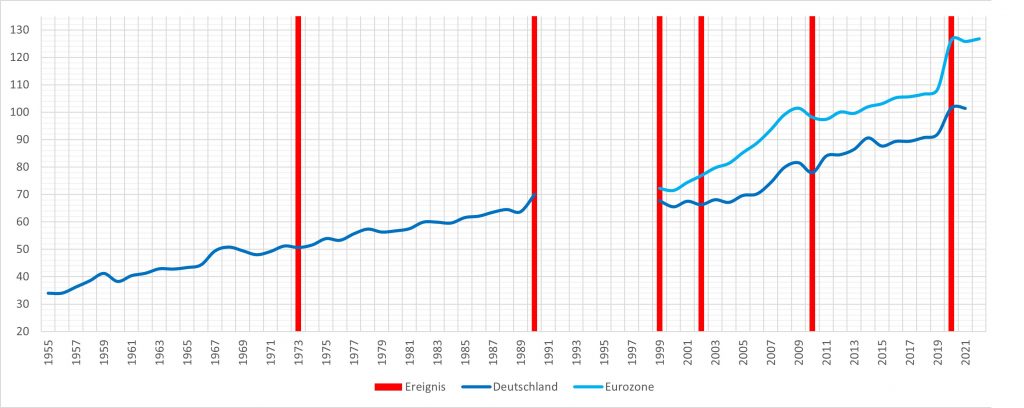
Source: Own illustration based on Sprenger B. (2002),[28] Deutsche Bundesbank (2022a),[29] ECB (2022),[30] Eurostat (2022).[31] Note: Germany (dark blue), Euro area (light blue).
The gold core-based Bretton Woods system had another advantage, as it helped the Bundesbank build the national gold reserves – from 0 in 1950 to over 4,000 tons at its peak in 1968 and around 3,600 tons in 1973.[32] However, until 2013 70 percent of German gold reserves were deposited abroad (45 percent in the USA). By 2021, still only half of Germany’s total gold stocks (3,359 tons) are stored domestically.[33]
Fiat money and stagflation
The 1970s and 1980s were characterized by elevated annual inflation rates of 4.9 and 2.9 percent, respectively. The reasons were the expansive fiscal policy of the Social Democratic government (between 1970 and 1975 public spending jumped from 38.5 to 48.8 percent of GDP[34] and the public debt ratio doubled between 1970 and 1989 from under 20 to around 40 percent),[35] the oil crises of 1973 and 1981, which acted as supply-side shocks, and the collapse of the Bretton Woods system in 1973.
The increasing deficit policy of the United States, which also became necessary to finance the Vietnam War, forced the Bundesbank to sell over 40 billion DM between 1971 and 1973 in order to maintain the fixed exchange rate against the USD. This increased money supply and thus domestic inflationary pressures. In 1973 Washington D.C. finally gave up the gold standard. Both the American dollar and the Deutschmark eventually became fiat currencies.[36]
Reunification, monetary union and stagflation again
In the decade between reunification and the introduction of the euro, consumer prices rose by an average of 2.5 percent per year. Although the stable D-Mark had become the second most important reserve currency in the world (14.1 percent of the global currency reserves by 1997),[37] the European monetary union was decided, according to Hans-Werner Sinn, primarily for political and ideological reasons.[38]
Along with the D-Mark, Germany also relinquished national sovereignty over its monetary policy.[39] Since then, the Bundesbank has been unable to autonomously conduct open market operations and set interest rates in order to influence domestic price and economic developments. Unfortunately, in order to meet the government financing needs of the southern European countries, the ECB has lowered the key interest rate significantly – from 3-4 percent in 1999 to 0-0.25 percent in 2021 (chart 6) – and bought government bonds on a massive scale (quantitative easing). As a result, the money supply in the euro area rose from 4,667 billion euros in 1999 to over 16,000 billion euros in 2021, thus exceeding its economic output by a quarter (chart 5).
As a result, the ECB’s ultra-loose monetary policy cost German savers over 1,243 billion euros gross between 2010 and 2022, or almost 15,000 euros per citizen.[40]
Chart 6. Key interest rate policy of the Bundesbank and ECB (1948-2022, in percentages)
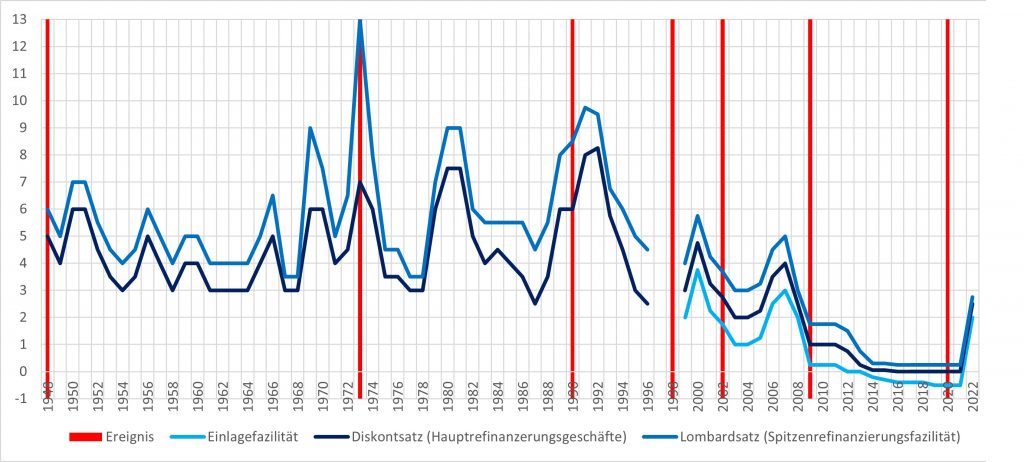
Source: Own illustration based on Deutsche Bundesbank (2022c)[41] and Deutsche Bundesbank (2022d).[42] Note: Deposit facility (light blue), discount rate or main refinancing operations (dark blue), lombard rate or marginal lending facility (blue).
Over the past two decades, consumer price inflation in Germany has been fairly low, averaging 1.6 percent per year in the 2000s and 1.3 percent in the 2010s. Researchers are concerned with the question of how this was possible despite low and negative interest rates. ECB reports point to cost-cutting factors such as trade globalization and digitalization.[43] Other studies indicate that higher inflation did take place – just in other areas: real estate and capital assets.[44]
Due to the exchange rate peg in the euro area, the Bundesbank’s Target II claims have exploded from 17.5 billion euros in 1999 to 1.234 billion euros in 2022.[45]
Finally, leading economists like Hans-Werner Sinn,[46] as well as libertarian economists like Thorsten Polleit,[47] warned that an external spark would unload pent-up inflationary pressures. This is exactly what happened in the form of the cyclical recovery after the lifting of corona restrictions in 2021 and the Ukraine war in 2022. As a result, consumer price inflation rose to 8.5 percent in 2022 and could reach 9.5 percent in 2023. Supply-side burdens from the left-green federal government in the form of increased bureaucracy, CO2 pricing and the energy transition certainly play another important price-driving role.[48]
Conclusion
The overview of the German currency and inflation history from 1873 to 2023 shows that under a free economic order – see the Wilhelmine and Erhard economic miracles – rapid growth in prosperity can be achieved without significant price increases and that both the gold standard and national sovereignty in monetary policy are important factors for monetary stability. These findings should be taken into account in future monetary policy decisions by free-conservative German governments.
Sources
[1] Erhard L. (1964). Wohlstand für Alle. Ullstein Verlag, Berlin.
[2] Deutsche Bundesbank (2022). Kaufkraftvergleiche historischer Geldbeträge. URL: https://www.bundesbank.de/de/statistiken/konjunktur-und-preise/erzeuger-und-verbraucherpreise/kaufkraftvergleiche-historischer-geldbetraege-775308
[3] The analysis begins in 1873, because it was only from this point in time that the Bundesbank’s time series no longer stated the purchasing power equivalents in Prussian thalers and southern German guilders, but in marks. Although the gradual introduction of the mark began immediately after the founding of the Reich in 1871, it was not until 1876 that it became the sole valid currency for the entire German Reich.
[4] Bossone B., Labini S. (2016). Macroeconomics in Germany: The forgotten lesson of Hjalmar Schacht. World Bank Group. URL: https://miwi-institut.de/archives/2490
[5] Monson C. (2022). The Myth That the Marshall Plan Rebuilt Germany’s Economy After WWII. Foundation for Economic Education. URL: https://miwi-institut.de/archives/1762
[6] Destatis (2022). Verbraucherpreisindizes für Deutschland. Lange Reihen ab 1948. URL: https://www.destatis.de/DE/Themen/Wirtschaft/Preise/Verbraucherpreisindex/Publikationen/Downloads-Verbraucherpreise/verbraucherpreisindex-lange-reihen-pdf-5611103.pdf?__blob=publicationFile&v=5
[7] IMF (2022). World Economic Outlook, October 2022: Countering the Cost-of-Living Crisis. URL: https://www.imf.org/en/Publications/WEO/Issues/2022/10/11/world-economic-outlook-october-2022
[8] It should be noted that leading German economic institutes indicate an even higher annual inflation rate of 9 percent for 2022 and 9.6 percent for 2023: Gemeinschaftsdiagnose (2022). Energiekrise: Inflation, Rezession, Wohlstandsverlust. Herbst 2022. URL: https://gemeinschaftsdiagnose.de/wp-content/uploads/2022/10/GD_2022-2.pdf
[9] Plumpe W. (2021). Ein wilhelminisches Wirtschaftswunder? Goethe-Universität Frankfurt. URL: https://www.wirtschaftsdienst.eu/inhalt/jahr/2021/heft/4/beitrag/ein-wilhelminisches-wirtschaftswunder.html
[10] Burhop, C. (2011). Wirtschaftsgeschichte des Kaiserreichs 1871-1918. Vandenhoeck & Ruprecht. URL: https://www.utb.de/doi/book/10.36198/9783838534541
[11] Destatis (2022a). Volkswirtschaftliche Gesamtrechnungen Bruttoinlandsprodukt, Bruttonationaleinkommen, Volkseinkommen. Lange Reihen ab 1925. URL: https://www.destatis.de/DE/Themen/Wirtschaft/Volkswirtschaftliche-Gesamtrechnungen-Inlandsprodukt/Tabellen/inlandsprodukt-volkseinkommen1925-pdf.pdf?__blob=publicationFile
[12] Kessler O. (2022). Warum Deflation besser wäre als Inflation. Liberales Institut. URL: https://www.libinst.ch/?i=warum-deflation-besser-ware-als-inflation
[13] Seidl C. (2022). Inflation in Germany: Brainwashing by the ECB. Christian-Albrechts-University Kiel. URL: https://miwi-institut.de/archives/2364
[14] Sensch J. (2009). Schulden der öffentlichen Haushalte in Deutschland von 1881 bis 1980. GESIS Datenarchiv, Köln. histat.
[15] Lapp K. (1957). Die Finanzierung der Weltkriege 1914/18 und 1939/45 in Deutschland. Hochschule für Wirtschafts- und Sozialwissenschaften, Nürnberg. GESIS Datenarchiv, Köln. histat.
[16] Bach S., Buggeln M. (2020). Geburtsstunde des modernen Steuerstaats in Deutschland 1919/1920. DIW. URL: https://www.wirtschaftsdienst.eu/inhalt/jahr/2020/heft/1/beitrag/geburtsstunde-des-modernen-steuerstaats-in-deutschland-1919-1920.html
[17] Heimberger P. (2021). Fiscal austerity and the rise of the Nazis. wiiw. URL: https://braveneweurope.com/philipp-heimberger-fiscal-austerity-and-the-rise-of-the-nazis
[18] Sinn H.W. (2020). Keine „Fehlinterpretation der Wirtschaftsgeschichte“ – Eine Replik auf Philipp Heimberger. Handelsblatt. URL: https://www.handelsblatt.com/meinung/homo-oeconomicus/homo-oeconomicus-keine-fehlinterpretation-der-wirtschaftsgeschichte-eine-replik-auf-philipp-heimberger/26731772.html
[19] Ettmeier S., Kriwoluzky A. (2022). Austeritätspolitik der Ära Brüning hat den Wirtschaftseinbruch verstärkt und die Arbeitslosigkeit erhöht. DIW. URL: https://www.diw.de/documents/publikationen/73/diw_01.c.842834.de/22-24-1.pdf
[20] Metz R. (2005). Säkulare Trends der deutschen Wirtschaft. Deutsche Wirtschaftsgeschichte – ein Jahrtausend im Überblick. GESIS Datenarchiv, Köln. histat.
[21] Destatis (2022b). Arbeitslosenquote der Bundesrepublik Deutschland in den Jahren 1950 bis 2021. URL: https://de.statista.com/statistik/daten/studie/1127090/umfrage/arbeitslosenquote-der-bundesrepublik-deutschland/
[22] Sensch J. (2016). Entwicklung der Arbeitslosigkeit in Deutschland 1887 – 2000. GESIS Datenarchiv, Köln. histat.
[23] James H. (1988). Einnahmen, Ausgaben und Verschuldung des Deutschen Reichs in den Haushaltsjahren 1926/27 bis 1932/33. Deutschland in der Weltwirtschaftskrise 1924-1936. URL: https://de.statista.com/statistik/daten/studie/249970/umfrage/staatshaushalt-der-weimarer-republik/
[24] Pentzlin H. (1980). Hjalmar Schacht. Leben und Wirken einer umstrittenen Persönlichkeit. Ullstein.
[25] Tooze A., Martin J. (2015). The economics of the war with Nazi Germany. Columbia University. URL: https://adamtooze.com/wp-content/uploads/2016/03/Tooze-Martin-Economics-of-War-Against-Hitler-CambHistWW2Vol3.pdf
[26] Mueller A. (2018). What Happened at Bretton Woods? AIER. URL: https://www.aier.org/article/what-happened-at-bretton-woods/
[27] Eucken W. (1952). Grundsätze der Wirtschaftspolitik. Tübingen.
[28] Sprenger B. (2002). Das Geld der Deutschen. GESIS Datenarchiv, Köln. histat.
[29] Deutsche Bundesbank (2022a). Lange Zeitreihen zur Wirtschaftsentwicklung in Deutschland. Dezember 2022. URL: https://www.bundesbank.de/resource/blob/843330/e688ba7371465d50bc078fcf7cd77bb1/mL/0-lange-zeitreihen-data.pdf
[30] EZB. (2022). Entwicklung der Geldmenge M3 in der Eurozone von 1999 bis August. URL: https://de.statista.com/statistik/daten/studie/241829/umfrage/entwicklung-der-geldmenge-m3-in-der-euro-zone/
[31] Eurostat (2022). GDP and main components. URL: https://ec.europa.eu/eurostat/databrowser/view/NAMA_10_GDP__custom_4359909/default/table?lang=en
[32] Beermann J. (2022). Das Gold der Deutschen. Deutsche Bundesbank. URL: https://www.bundesbank.de/de/presse/reden/das-gold-der-deutschen-897330
[33] Deutsche Bundesbank (2022b). Verteilung der Goldreserven der Deutschen Bundesbank auf die einzelnen Lagerorte von 2011 bis 2021. URL: https://de.statista.com/statistik/daten/studie/245363/umfrage/lagerorte-der-goldreserven-der-deutschen-bundesbank/
[34] BMF (2022). Entwicklung der Staatsquote. URL: https://www.bundesfinanzministerium.de/Datenportal/Daten/offene-daten/haushalt-oeffentliche-finanzen/s12-entwicklung-der-staatsquote/s12-entwicklung-der-staatsquote.html
[35] Holtfrerich C.L. (2015). Staatsschulden: Ursachen, Wirkungen und Grenzen. Freie Universität Berlin. URL: https://www.wirtschaftsdienst.eu/inhalt/jahr/2015/heft/8/beitrag/staatsschulden-ursachen-wirkungen-und-grenzen.html
[36] Deutsche Bundesbank (2013). 1973: Das Ende von Bretton Woods – Als die Kurse schwanken lernten. URL: https://www.bundesbank.de/de/aufgaben/themen/1973-das-ende-von-bretton-woods-als-die-kurse-schwanken-lernten-663622
[37] Deutsche Bundesbank (1997). Die Rolle der D-Mark als internationale Anlage- und Reservewährung. URL: https://www.bundesbank.de/resource/blob/691414/4fc9f0a56d44a730e2a5134a92b9f326/mL/1997-04-dmark-data.pdf
[38] Sinn H.W. (2014). The Euro Trap. Oxford Press.
[39] For a more detailed critique: Kofner Y. (2021). 20 years of the euro – a view from the German right. MIWI Institute. URL: https://miwi-institut.de/archives/1627
[40] Stappel M. (2020). Historisch hohe Sparquote. DZ Bank. URL: https://www.dzbank.de/content/dzbank/de/home/die-dz-bank/presse/schwerpunktthemen/2020/2020-10-28_hohe_sparquote.html | Stappel M. (2021). Über 116 Milliarden Euro Wertverlust: Negativer Realzins belastet Geldvermögen privater Haushalte in Deutschland. DZ Bank. URL: https://www.dzbank.de/content/dzbank/de/home/die-dz-bank/presse/schwerpunktthemen/2021/ueber-116-milliardeneurowertverlustnegativerrealzinsbelastetgeld.html | Stappel M. (2022). Trotz Zinswende: Hohe Inflation sorgt für 395 Milliarden Euro Kaufkraftverlust beim Geldvermögen. DZ Bank. URL: https://www.dzbank.de/content/dzbank/de/home/die-dz-bank/presse/schwerpunktthemen/2022/trotz-zinswende-hoheinflationsorgtfuer395milliardeneurokaufkraft.html
[41] Deutsche Bundesbank (2022c). Diskont- und Lombardsatz der Deutschen Bundesbank. URL: https://www.bundesbank.de/resource/blob/650692/1a207bb54d6fe0b23e1335e163c0967c/mL/s510ttdiskont-data.pdf
[42] Deutsche Bundesbank (2022d). EZB-Zinssätze. URL: https://www.bundesbank.de/resource/blob/607806/ed1133bb2235fefd00ea4625ecac7115/mL/s510ttezbzins-data.pdf
[43] E.g.: Ciccarelli M., Osba C. (2017). Low inflation in the euro area: Causes and consequences. ECB. URL: https://www.ecb.europa.eu/pub/pdf/scpops/ecbop181.en.pdf | Koester G. et al. (2021). Understanding low inflation in the euro area from 2013 to 2019: cyclical and structural driver. ECB. URL: https://www.ecb.europa.eu/pub/pdf/scpops/ecb.op280~697ef44c1e.en.pdf
[44] Daniel Gros D., Shamsfakhr F. (2021). The rising cost of housing. CEPS. URL: https://www.ceps.eu/the-rising-cost-of-housing/
[45] Deutsche Bundesbank (2022e). TARGET2-Saldo. URL: https://www.bundesbank.de/de/aufgaben/unbarer-zahlungsverkehr/target2/target2-saldo/target2-saldo-603478
[46] Sinn H.W. (2020). Corona und die wundersame Geldvermehrung in Europa. ifo Institut. URL: https://www.youtube.com/watch?v=L-dCADYr2AM
[47] Polleit T. (2020). Ob kontrolliert oder explosiv: An einer Geldentwertung führt kein Weg vorbei. Universität Bayreuth. URL: https://www.focus.de/finanzen/boerse/experten/teuerung-ob-kontrolliert-oder-explosiv-an-einer-geldentwertung-fuehrt-kein-weg-mehr-vorbei_id_12472952.html
[48] Kofner Y. (2022). Economic policy of Germany’s new coalition government: economic and welfare effects. MIWI Institute. URL: https://miwi-institut.de/archives/1617
8 comments