_ Yuri Kofner, junior economist, MIWI – Institute for Market Integration and Economic Policy. Munich, 9 September 2020.
Research question
Since and even before the inception of the Eurasian Economic Union (EAEU) in 2015, a debate has been going on about which of the five member states – Armenia, Belarus, Kazakhstan, Kyrgyzstan, and Russia – win and which lose from the post-Soviet integration project.
More often than not, a potential constructive debate about this important question is prevented by various problems. It is often conducted in an unscientific manner and has a politically motivated bias. Usually, the parties only see the (opportunity) costs, wich their country or sector experience from the integration process, while often citing in their argumentation only individual most striking barriers, without seeing the bigger picture.
Also, the imperial and Soviet past, as well as the modern Russo-Western confrontation impose their mark on the public discourse. For this reason, many political scientists and journalists from Russia express the opinion that only the other member states benefit from the Eurasian Economic Union, through which, ostensibly, Moscow, directly and indirectly, bestows them with economic benefits.
In the other EAEU member states, one usually hears the opposite opinion, according to which they incur only losses from the alliance with Russia, which the Kremlin allegedly needs not for economic benefit, but only for prestige and political dominance over its neighbors.
Therefore, the purpose of this study is to use a scientific method to objectively determine for each member state the net welfare gains and losses from participation in the EAEU.
Methodology and data
To achieve this goal, the author employs the cost-benefit analysis, which is used by leading economic research institutes in Austria, such as the wifo and wiiw, to estimate the economic costs and benefits of the European Union for the European member states.[1]
The net economic effect for member state (i) from participation in the EAEU (BiEAEU) is calculated using the following formula:
BiEAEU = Gij(ΣXij – Mij) + tiEAEU + Sij(ΣiXij – Mij) + Cij(ΣiXij + Mij) + Lij(ΣiXij – Mij)
Where,
Gij(ΣXij – Mij) is the net balance of total goods trade of member state (i) with the other EAEU member states (j); tiEAEU the revenue from total import customs duties, which member state (i) receives according to the agreed redistribution quota; Sij(ΣiXij – Mij) is the net balance of total services trade of member state (i) with the other EAEU member states (j); Cij(ΣiXij + Mij) is the sum of total foreign direct investment inflows (liabilities) and foreign direct investment outflows (assets) of a member state (i) with the other EAEU member states (j); Lij(ΣiXij – Mij) is the net balance of total remittances of labor migrants and personal money transfers between member state (i) and the other EAEU member states (j).
The data were taken from the annual publications of the EEC Statistics department of the Eurasian Economic Commission (EEC)[2], as well as from the WITS (UN Comtrade) database.[3] For the analysis, the author used a simple annual average value based on data for the period from 2015 to 2018. Mirror data had to be calculated for Armenia and Kyrgyzstan for services trade and FDI flows in 2015.
Goods trade (including fuels trade)
In 2015-2018, all the EAEU member states, except for Russia, had a negative balance in intra-union goods trade – including fuels trade. During this period, the trade deficit increased for Armenia and significantly for Belarus and Kazakhstan. The deficit of Kyrgyzstan diminished slightly. Meanwhile, Russia’s surplus in goods trade with other member states grew significantly.
The negative trade balance had the greatest negative impact on the Belarusian and Kyrgyz economies. Formally, it deducted from their GDP 15,4 and 19,3 percent, respectively, on average annually. The positive balance gave Russia 1.1 percent of its gross domestic product.
Interestingly, even though Kazakhstan is a large net exporter of energy resources (oil, coal, and natural gas), it still had a deficit in intra-EAEU goods trade, which suggests that the net proceeds from fuels exports to the EAEU members were unable to compensate for the costs of importing goods from them.
Table 1. Intra-EAEU goods trade balance (2015-2018, in USD mln, with fuels trade)
| 2015 | 2016 | 2017 | 2018 | Average (2015-2018) | Change between 2015 and 2018 (in percent) | In relation to GDP (2015-2018 average, in percent) | |
| ARM | -732,6 | -668,8 | -743,2 | -752,2 | -724,2 | 2,7 | -6,4 |
| BLR | -6199,8 | -3996,4 | -6064,9 | -8828,3 | -6272,4 | 42,4 | -15,4 |
| KAZ | -6091,3 | -5933,4 | -7255,6 | -8050,6 | -6832,7 | 32,2 | -4,1 |
| KGZ | -1654,9 | -1178,7 | -1322,2 | -1520,5 | -1419,1 | -8,1 | -19,3 |
| RUS | 14640 | 12310,4 | 16284,9 | 19680,9 | 15729,1 | 34,4 | 1,1 |
Source: EEC Statistics Department and author’s calculations.
Customs revenues
The EAEU is primarily a customs union with a single customs territory. Between 2015 and 2018, the EAEU collected a total amount of import customs revenues of USD 12.5 billion on average annually from duties on goods import from third parties.
Table 2. Factual collections of EAEU import customs revenues (2015-2018, in USD mln)
| 2015 | 2016 | 2017 | 2018 | Average (2015-2018) | Percentage change (2015-2018) | |
| ARM | 128,7 | 115,5 | 150,4 | 166,1 | 140,2 | 29,1 |
| BLR | 543,6 | 484,8 | 584,0 | 623,6 | 559,0 | 14,7 |
| KAZ | 63,0 | 52,5 | 50,2 | 111,7 | 69,4 | 77,3 |
| KGZ | 138,0 | 191,4 | 239,3 | 265,7 | 208,6 | 92,5 |
| RUS | 9149,7 | 8205,9 | 9094,9 | 19498,0 | 11487,1 | 113,1 |
| EAEU | 10023,0 | 9050,1 | 10118,8 | 20665,1 | 12464,3 | 106,2 |
Source: EEC Statistics Department and author’s calculations.
The average shares of factually collected amounts of import customs revenues of the member states in the total amount of collected customs revenues of the union for this period were as follows:
- Armenia – 1.125 percent;
- Belarus – 4.485 percent;
- Kazakhstan – 0.556 percent;
- Kyrgyzstan – 1.674 percent;
- Russia – 92.161 percent.
However, according to Art. 26 and Appendix 5 to the EAEU Treaty, as part of the EAEU customs union, all amounts of import customs duties collected by the national customs authorities are first credited to a joint account, after which the total amount is redistributed to the member states according to a certain quota. In the latest edition, this distribution quota was as follows:
- Armenia – 1.220 percent;
- Belarus – 4.860 percent;
- Kazakhstan – 6.955 percent;
- Kyrgyzstan – 1,900 percent;
- Russia – 85.065 percent.
Thus, under this redistribution agreement, thanks to transfers from the Russian Federation, the other member states receive higher amounts of import customs revenues than they collect in reality.
Table 3. Agreed distribution of total EAEU import customs revenues (2015-2018, in USD mln)
| 2015 | 2016 | 2017 | 2018 | Average (2015-2018) | Difference to factually collected customs duties (2015-2018 average) | In relation to GDP (2015-2018 average, in percent) | |
| ARM | 122,3 | 110,4 | 123,4 | 252,1 | 152,1 | 11,9 | 1,3 |
| BLR | 487,1 | 439,8 | 491,8 | 1004,3 | 605,8 | 46,8 | 1,5 |
| KAZ | 697,1 | 629,4 | 703,8 | 1437,3 | 866,9 | 797,5 | 0,5 |
| KGZ | 190,4 | 172,0 | 192,3 | 392,6 | 236,8 | 28,2 | 3,2 |
| RUS | 8526,1 | 7698,5 | 8607,6 | 17578,8 | 10602,7 | -884,4 | 0,7 |
| EAEU | 10023,0 | 9050,1 | 10118,8 | 20665,1 | 12464,3 | 0 | – |
Source: EEC Statistics Department and author’s calculations.
Chart 1. Change in national customs revenues due to quota (transfers) and gross national customs revenues in relation to GPD (2015-2018 average)
![]()
Source: EEC Statistics Department and author’s calculations.
Kazakhstan received the largest transfer: on average, it received USD 800 million more annually than it collects factually. In aggregate, revenues from import customs duties added 0.5 percent to the republic’s GDP.
Services trade
During the study period, only the Russian Federation, but also, interestingly, Belarus had a net surplus in intra-union services trade of over USD 560 mln on average per annum. Moreover, the services trade surplus of Belarus increased by almost 9 percent and, in comparison with the other member states, was of greater importance for the Belarusian economy. In other words, Minsk significantly benefits from the common services market.
Although the tourism business in Armenia and Kyrgyzstan has a high potential, it is obvious that the export of tourism services could not compensate for the import of services from the other EAEU member states.
Table 4. Intra-EAEU services trade balance (2015-2018, in USD mln)
| 2015 | 2016 | 2017 | 2018 | Average (2015-2018) | Change between 2015 and 2018 (in percent) | In relation to GDP (2015-2018 average, in percent) | |
| ARM | -22,4 | -71,9 | -77,9 | -88,0 | -65,1 | 292,3 | -0,6 |
| BLR | 505,8 | 516,7 | 685,8 | 550,9 | 564,8 | 8,9 | 1,4 |
| KAZ | 50,1 | -271,7 | -530,4 | -151,2 | -225,8 | -401,8 | -0,1 |
| KGZ | 9,1 | -6,2 | -434,8 | -113,7 | -136,4 | -1349,5 | -1,9 |
| RUS | 961,8 | 546,6 | 630,0 | 735,3 | 718,4 | -23,5 | 0,05 |
Source: EEC Statistics Department and author’s calculations.
Intra-union services trade played practically no significant role for the Russian economy, which, perhaps, indicates insufficient integration and development of the common services market.
FDI flows
In the conducted cost-benefit analysis, the author summed up gross foreign direct investment inflows and outflows within the union since both directions of flows have a positive effect on the economy of a given member state. Intra-EAEU FDI inflows into the member state increase the capital stock within the country. FDI outflows from the country to the other member states increase the country’s total ownership of assets in the other member states.
Intra-union capital investment flows were the highest in relation to the GDP of Kyrgyzstan and Belarus, with almost 3 and 1.5 percent, respectively. However, in both cases, they tended to decrease. All the while, gross investment flows to and from Kazakhstan with the other member states doubled between 2015 and 2018.
Table 5. Intra-EAEU gross FDI inflows and outflows (2015-2018, in USD mln)
| 2015 | 2016 | 2017 | 2018 | Average (2015-2018) | Change between 2015 and 2018 (in percent) | In relation to GDP (2015-2018 average, in percent) | |
| ARM | 130,4 | -90,9 | -0,9 | 161,6 | 50,1 | 23,9 | 0,4 |
| BLR | 767,6 | 590,0 | 514,7 | 645,7 | 629,5 | -15,9 | 1,5 |
| KAZ | 422,9 | 779,3 | 802,8 | 858,6 | 715,9 | 103,0 | 0,4 |
| KGZ | 512,6 | 279,5 | 78,1 | -13,9 | 214,1 | -102,7 | 2,9 |
| RUS | 2207,4 | 1587,3 | 1497,5 | 1341,9 | 1658,5 | -39,2 | 0,1 |
Source: EEC Statistics Department and author’s calculations.
Labor remittances and personal transfers
The creation of the single labor market is one of the main success stories of Eurasian integration. The common labor market of the union can be divided into two groups: two net recipients of labor migration – Russia and Kazakhstan, along with three net donors of labor migration – Kyrgyzstan, Armenia, and Belarus. Consequently, the first group had a net deficit in labor remittances and personal money transfers, while the second group had a net surplus.
As expected, remittances from labor migrants working mainly in Russia and Kazakhstan were of immense importance to the Kyrgyz economy, and quite important as well to Armenia, with almost 24 and 6 percent in relation to their GDP, respectively. Interestingly, the net surplus of remittances to Armenia narrowed, while it increased significantly to Kyrgyzstan. All the while, Kazakhstan has managed to notably reduce its net deficit of remittances.
Table 6. Intra-EAEU labor remittances and personal transfers balance (2015-2018, in USD mln)
| 2015 | 2016 | 2017 | 2018 | Average (2015-2018) | Change between 2015 and 2018 (in percent) | In relation to GDP (2015-2018 average, in percent) | |
| ARM | 760,4 | 577,2 | 735,0 | 605,9 | 669,6 | -20,3 | 5,9 |
| BLR | 607,7 | 651,4 | 836,3 | 766,6 | 715,5 | 26,1 | 1,8 |
| KAZ | -2613,9 | -1554,9 | -2057,3 | -1545,6 | -1942,9 | -40,9 | -1,2 |
| KGZ | 1303,9 | 1587,7 | 1988,5 | 2099,9 | 1745,0 | 61,1 | 23,7 |
| RUS | -3033,0 | -3860,2 | -4678,8 | -5284,6 | -4214,1 | 74,2 | -0,3 |
Source: EEC Statistics Department and author’s calculations.
Net welfare effects (with fuels trade)
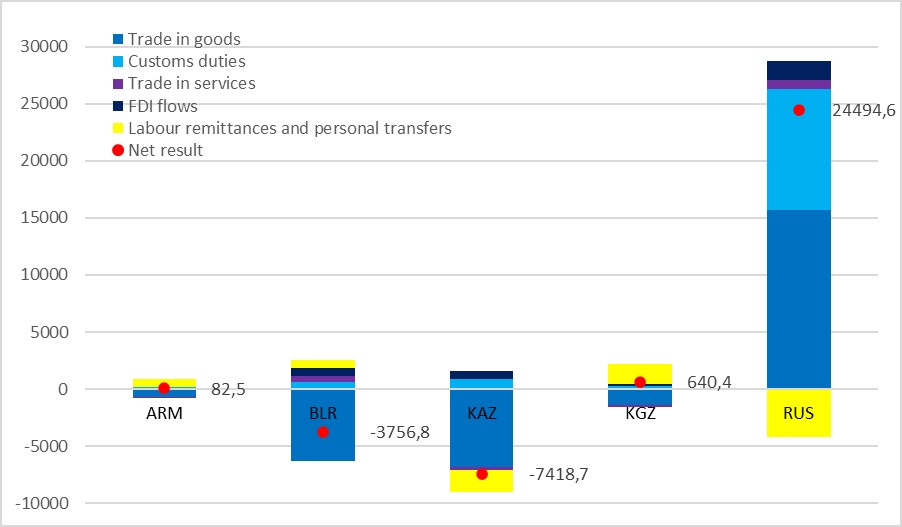
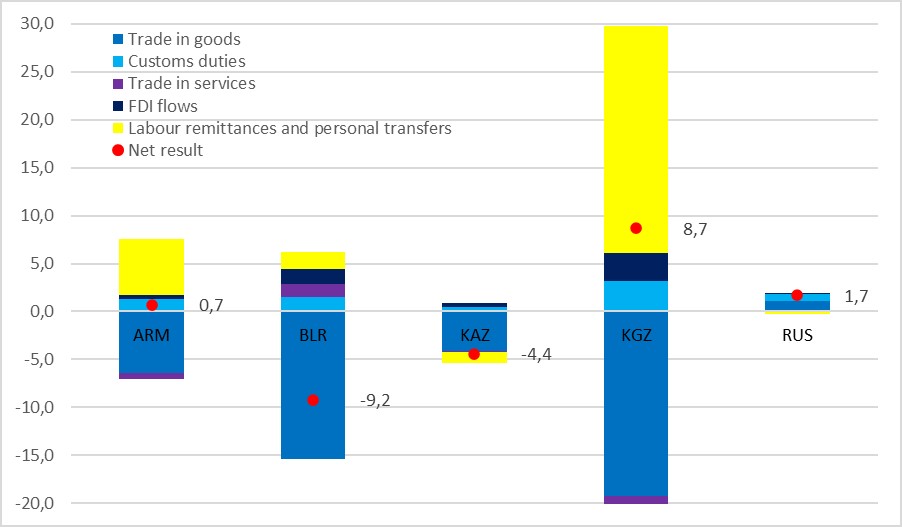
Taking into account intra-union energy trade, Armenia, Kyrgyzstan as well as the Russian Federation were the net beneficiaries from participating in the Eurasian Economic Union, which added 0.7, 8.7, and 1.7 percent to their national GDP, respectively.
Thanks to labor migration and despite the cost of energy imports, Kyrgyzstan was the main beneficiary of Eurasian integration.
Kazakhstan and Belarus formally lost out from membership in the EAEU. In both cases, this was mainly due to an intra-union goods trade deficit, but for opposite reasons. The significant 9.2 percent net deduction from Belarus’ GDP is attributable to a deficit in energy trade with the Russian Federation. Whereas, although Kazakhstan is a net exporter of energy resources and receives large customs revenue transfers, it could not compensate for the trade deficit with the other union member states in other goods categories, which lead to an overall deduction of 4.4 percent of the country’s gross domestic product.
Table 7. Net welfare effects of EAEU membership (2015-2018 yearly average, in USD mln, including fuels trade)
| Goods trade (including fuels) | Import customs duties | Services trade services | FDI flows | Labour remittances and personal transfers | Net welfare effect | Net welfare effect in relation to GDP (2015-2018 average, in percent) | |
| ARM | -724,2 | 152,1 | -65,1 | 50,1 | 669,6 | 82,5 | 0,7 |
| BLR | -6272,4 | 605,8 | 564,8 | 629,5 | 715,5 | -3756,8 | -9,2 |
| KAZ | -6832,7 | 866,9 | -225,8 | 715,9 | -1942,9 | -7418,7 | -4,4 |
| KGZ | -1419,1 | 236,8 | -136,4 | 214,1 | 1745,0 | 640,4 | 8,7 |
| RUS | 15729,1 | 10602,7 | 718,4 | 1658,5 | -4214,1 | 24494,6 | 1,7 |
Source: EEC Statistics Department and author’s calculations.
Chart 2. Net welfare effects of EAEU membership (2015-2018 yearly average, in USD mln, including fuels trade)
Source: EEC Statistics Department and author’s calculations.
Chart 3. Net welfare effects of EAEU membership (2015-2018 yearly average, in relation to GDP, including fuels trade)
Source: EEC Statistics Department and author’s calculations.
However, before making final conclusions, the author would like to repeat the cost-benefit analysis, but with excluding fuels trade from the equation.
Goods trade (excluding fuels trade)
The energy market takes up a special role in the Eurasian Economic Union. In aggregate, the EAEU has a huge stock of energy resources:
- 1/5 of the world’s natural gas reserves and more than 50 percent of global exports;
- more than 1/5 of the world’s coal reserves and 4.9 percent of international production;
- 8 percent of world oil reserves, 14.2 percent of global production and 18 percent of world exports;
- 1 percent of world electricity production.[4]
Mineral products make up almost 1/3 of the EAEU’s internal trade and almost 2/3 of its trade with the rest of the world.
Table 8. Share of mineral products in the EAEU’s internal and external trade structure (in |%, 2014-2018)
| 2015 | 2016 | 2017 | 2018 | Average (2015-2018) | |
| Share of mineral products in intra-EAEU trade | 33,4 | 27,1 | 27,7 | 28,7 | 29,2 |
| Share of mineral products in extra-EAEU trade | 65,6 | 60,6 | 62,6 | 67,2 | 64,0 |
Source: EEC Statistics Department and the author’s calculations.
In this regard, firstly, to create equal and non-discriminatory conditions for industrial competition between the EAEU member states, it is planned to accomplish by 2025 the formation of common markets for oil, petroleum products, and natural gas, as well as the formation of a common electricity market.
Secondly, due to the great dependence on extra-union energy exports on the part of the economies of Russia, Kazakhstan and Belarus (Minsk exports petroleum products to Europe refined from Russian crude oil), especially these three initiator countries of the EAEU would like to see the bloc’s single internal market as an opportunity for more trade diversification.
Due to the above-mentioned special role of the energy sector in the EAEU, the author considers it possible to assess the EAEU’s welfare effect assuming the deduction of fuels trade, i.e. coal, oil and petroleum products, as well as natural gas.
Table 9. Intra-EAEU goods trade balance (2015-2018, in USD mln, without fuels trade)
| 2015 | 2016 | 2017 | 2018 | Average (2015-2018) | Change between 2015 and 2018 (in percent) | In relation to GDP (2015-2018 average, in percent) | |
| ARM | -433,2 | -334,0 | -352,4 | -346,6 | -366,5 | -20,0 | -3,3 |
| BLR | 2883,4 | 2889,5 | 2138,6 | 989,6 | 2225,3 | -65,7 | 5,5 |
| KAZ | -7015,5 | -5913,8 | -7444,9 | -7883,2 | -7064,4 | 12,4 | -4,2 |
| KGZ | -1543,8 | -1064,2 | -1257,7 | -1456,4 | -1330,5 | -5,7 | -18,1 |
| RUS | 7396,4 | 6225,5 | 9174,1 | 9308,0 | 8026,0 | 25,8 | 0,5 |
Source: WITS (UN Comtrade) and author’s calculations.
In trade in non-energy goods, not only Russia but also Belarus had a positive balance with the other member states of the integration bloc. The latter’s average annual net surplus in intra-union non-fuels trade was over USD 2 bln, which shows that the EAEU is a vital export market for the Belarussian industry and agri-food sector.
Net welfare effects (without fuels trade) and concluding remarks
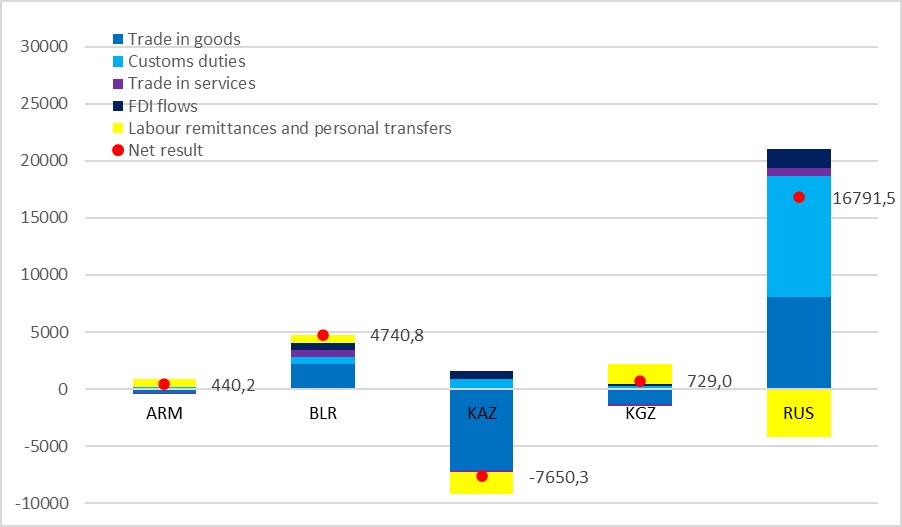
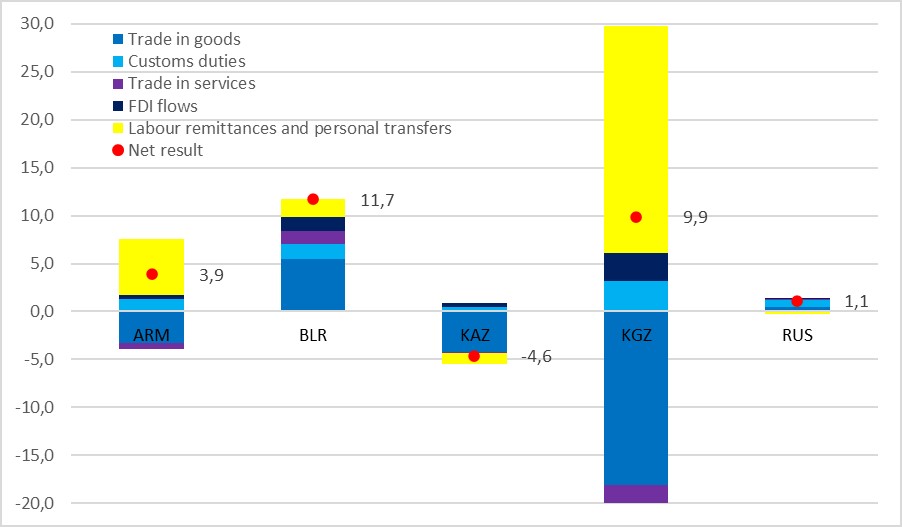
Not taking into account fuels trade, all EAEU member states, except for Kazakhstan, have benefited from membership in the Eurasian Economic Union.
Table 10. Net welfare effects of EAEU membership (2015-2018 yearly average, in relation to GDP, in percent, excluding fuels trade)
| Goods trade (excluding fuels) | Import customs duties | Services trade services | FDI flows | Labour remittances and personal transfers | Net welfare effect | |
| ARM | -3,3 | 1,3 | -0,6 | 0,4 | 5,9 | 3,9 |
| BLR | 5,5 | 1,5 | 1,4 | 1,5 | 1,8 | 11,7 |
| KAZ | -4,2 | 0,5 | -0,1 | 0,4 | -1,2 | -4,6 |
| KGZ | -18,1 | 3,2 | -1,9 | 2,9 | 23,7 | 9,9 |
| RUS | 0,5 | 0,7 | 0,05 | 0,1 | -0,3 | 1,1 |
Source: EEC Statistics Department and author’s calculations.
Chart 4. Net welfare effects of EAEU membership (2015-2018 yearly average, in USD mln, excluding fuels trade)
Source: EEC Statistics Department and author’s calculations.
Chart 5. Net welfare effects of EAEU membership (2015-2018 yearly average, in relation to GDP, excluding fuels trade)
Source: EEC Statistics Department and author’s calculations.
Except for trade in energy products, Belarus had a net surplus on all items of its balance of payments with the other member states. As a result, Minsk was the main beneficiary from the Eurasian Economic Union, which added 11.7 percent to the republic’s GDP on average annually.
In second place was Kyrgyzstan. EAEU membership added almost 10 percent to its GDP on average annually, mainly due to remittances from labor migrants, but also due to foreign direct investment and the redistribution of customs revenues.
Participation in the common EAEU market gave the Armenian economy almost 4 percent on average annually. Net labor remittances and redistribution transfers of customs revenues were also the main net contributors.
The analysis showed that the EAEU is, contrary to popular belief, not an exclusively geopolitical project for the Kremlin, as the union brings Russia concrete net welfare benefits in the amount of 1.1 percent of its GDP without fuels trade and of 1.7 percent of GDP with fuels trade.
The case with Kazakhstan
With and without fuels trade, Kazakhstan was the only member state, which experienced a negative welfare effect from participation in the EAEU – with a formal deduction of 4.4 to 4.6 percent of its GDP on average annually. The main reason for this was the negative goods trade balance with the other member states of the union, which, in the author’s opinion, is neither caused nor exacerbated by the country’s membership in the EAEU, but rather by Kazakhstan’s one-sided industrial structure, which is based mainly on the export of carbon fuels, minerals, and metals.
Moreover, a study by the Vienna Institute for International Economic Research (wiiw) from 2018 using a gravity model found that thanks to the creation of the Eurasian customs union, factual export volumes from Kazakhstan to Belarus were on average 2-3 times higher in 2010-2015 than they could have been without its establishment.[5] This suggests, that without the EAEU, Kazakhstan‘s goods trade deficit with the post-Soviet region could have been even worse.
Nursultan could not compensate for its intra-union goods trade deficit neither by positive and doubling investment flows, nor by the high level of customs revenues transfers, nor with services exports, as, for example, France is doing in the EU’s single internal market. At least Kazakhstan is not forced to compensate for the intra-union goods trade deficit by increasing its sovereign debt, as is the case with Italy within the eurozone.[6] Rather, Kazakhstan is compensating for its deficit within the EAEU through a significant surplus in trade with countries outside the union, which in 2015-2018 amounted to an average of USD 25.1 billion annually.
Of all the EAEU member states, Kazakhstan has one of the most liberal and attractive tax, labor, and investment regimes. In this regard, to reduce the goods trade deficit within the union, the republic could stronger promote the EAEU’s industrial cooperation agenda with the expectation of locating joint ventures on its national territory.
Moreover, an earlier study conducted by the author using a gravity model and a product space model showed that there is a high potential for intra-union industrial cooperation in the production of motor vehicles and that final assembly would be most cost-effective in Kazakhstan.[7]
Another important policy track would be to accelerate the work of the Eurasian Economic Commission on concluding free trade agreements with third parties, such as with India, Egypt, and South Korea. In fact, it would be important here to go further than simply lowering tariff barriers, by concentrating more on cooperation agreements in services trade and investment.
Overall, it is important to emphasize that regarding a trade deficit as necessarily bad is not entirely correct, as this continues the rather simplistic Keynesian-mercantilist school of thought.[8] For a more comprehensive assessment, it would be necessary to analyze not only the trade balance but also its value-added structure.
The relevance of the single economic space for the EAEU as a whole
Using the data above, the author also estimated, that intra-union trade in goods and services, mutual investments, mutual labor remittances, and personal money transfers, as well as all collected import customs revenues combined, made up 5 percent of the EAEU’s gross domestic product on average annually for 2015-2018.
Without customs duties collected on the external border of the integration bloc, the economic significance of the single internal market is 4.2 percent of the EAEU‘s GDP.[9]
Notes:
[1] Bachtrögler-Unger et al. (2020). Overcoming the net position thinking in EU member states. Austrian Society for European Politics. URL: https://oegfe.at/2020/07/net-position-thinking-eu/
[2] EEC Statistics Department. URL: http://www.eurasiancommission.org/ru/act/integr_i_makroec/dep_stat/union_stat/Pages/default.aspx
[3] WITS World Bank. URL: https://wits.worldbank.org/
[4] Seidakhmetova B. (2020). How Kazakhstan’s initiatives in the EAEU contribute to overcoming the crisis. (In Russian). URL: https://365info.kz/2020/05/kak-initsiativy-kazahstana-v-eaes-sposobstvuyut-vyhodu-iz-krizisa
[5] Adarov A. (2018). Trade effects of Eurasian economic integration to date. wiiw Monthly Report April 2018. URL: https://wiiw.ac.at/monthly-report-no-4-2019-dlp-4887.pdf
[6] Sinn H.W. (2020). The Italian tragedy: problems of the Eurozone and four potential solutions. MIWI Institute. URL: https://miwi-institut.de/archives/389
[7] Kofner Y. (2020). EAEU industrial cooperation: promising products with intra-union demand. . MIWI Institute. URL: https://miwi-institut.de/archives/426
[8] Kooths S. (2020). How to steer trade policy so that it mutually benefits economies and societies globally? IfW Kiel. URL: https://www.kooths.de/download/presentations/2020-06-19-kooths_FNF-EngageEconomyEurope21.pdf
[9] However, it should be added that both indicators are given without taking into account the multiplier effect.
3 comments